Citing
© 2008, Commission on the Protection of the Black Sea Against Pollution
ISBN 978-9944-245-33-3
For bibliographic purposes this document may be cited as:
BSC, 2008. State of the Environment of the Black Sea (2001 - 2006/7). Edited by Temel Oguz. Publications of the Commission on the Protection of the Black Sea Against Pollution (BSC) 2008-3, Istanbul, Turkey, 448 pp.
This document has been prepared with the financial assistance of the European Union.
The designations employed and the presentation of the material in this publication do not imply the expression of any opinion whatsoever on the part of the Commission on the Protection of the Black Sea Against Pollution nor of the European Union concerning the legal status of any country, territory, city or area or of its authorities, or concerning delimitation of its frontiers or boundaries. Moreover, the views expressed do not necessarily represent the decision or the stated policy of the Commission on the Protection of the Black Sea Against Pollution nor of the European Union, nor does citing of trade names or commercial processes constitute endorsement.
This publication may be reproduced in whole or in part and in any form for educational or non-profit purposes without special permission from the copyright holder, provided acknowledgement of the source is made. Commission on the Protection of the Black Sea Against Pollution would appreciate receiving a copy of any publication that uses this publication as a source.
No use of this publication may be made for resale or for any other commercial purpose whatsoever without prior permission in writing from the Permanent Secretariat of the Black Sea Commission on the Protection of the Black Sea Against Pollution.
Cover design: Nilufer Akpinar
Cover images: Photos of Mnemiopsis leidyi and Beroe ovata by Ahmet E. Kideys; Satellite images are from EC-Joint Research Centre, Global Environment Monitoring Unit Ocean Colour Archive, http://oceancolour.jrc.ec.europa.eu/; as presented in Fig. 2.4.8a of this report.
Published by Referans Çeviri Hizmetleri, Yazılım ve Yayıncılık Ltd. on behalf of the Commission on the Protection of the Black Sea Against Pollution. Printing and binding: Artus Basım Tel: (0212) 289 88 80
Preface and Acknowledgements
More than 60 prominent scientists working on the Black Sea ecosystem have contributed to this report. Despite this is the most comprehensive report on the State of Environment of the Black Sea for the period 2001-2007, limitation in the systematically collected data and indicators, makes a conclusive inference difficult on the real state of the ecosystem of this sea.
Chapter 1, within two sub-chapters, presents introductory information on the Black Sea physico-chemical characteristics and geology/history. Chapter 2 deals with one of the most important problems of the Black Sea, the Eutrophication. Chapter 3, dealing with Chemical Pollution, has several subchapters of different pollutant groups. Radioactive pollution is dealt in Capter 4. States of phytoplankton, zooplankton, macrophytobenthos, zoobenthos are presented in Chapters 5, 6, 7 and 8, respectively. The fisheries is the subject of Chapter 9 and mammals of Chapter 11. Socio-economic pressures and impacts are included in Chapter 11. The overall assessment of the report summarizing all these issues is given in Chapter 12.
Contributions to Chapter 4 were provided with partial support from the International Atomic Energy Agency's Technical Co-operation Project RER/2/003 for "Marine Environmental Assessment in the Black Sea Region.
Thanks to UNDP/GEF BSERP Project personnel and earlier Permanent Secretariat staff for their support at the initial stages of the preparation of this report, all authors and especially to the chief editor Prof Temel Oguz for their scientific contributions, to the Advisory Group members of the Commission on the Protection of the Black Sea Against Pollution for their comments, Mr Kiril Iliev for formatting, Ms Nilufer Akpınar for preparing for printing and all other organizations and people who kindly provided data, information and other input. Special thanks go to Dr Violeta Velikova, not only for her personal scientific contribution in the entire report, but also for her organizational and thorough efforts making compilation of this comprehensive report possible.?
Prof Ahmet E. Kideys
Executive Director
Permanent Secretariat
Commission on the Protection of the Black Sea Against Pollution
Dolmabahce Sarayı, 2. Hareket Koşku,
34353 Beşiktaş, Istanbul, Turkey
Authors of the State of Environment Report
Valeria Abaza, National Institute for Marine Research and Development "Grigore Antipa" (NIMRD), Constanta, Romania abaza@alpha.rmri.ro
VladimirAkatov, Maykop State Technological University, Maykop, Russia
Yelda Aktan, Faculty of Fisheries, Istanbul University, Istanbul, Turkey yaktan@istanbul.edu.tr
Elena Arashkevich, P.P.Shirshov Institute of Cceanology Russian Academy of Sciences, Russian Federation aelena@ocean.ru
Alexei Birkun,Jr., Brema Laboratory,
Simferopol, Ukraine alexeibirkun@home.cris.net
Laura Boicenco, National Institute for Marine Research and Development "Grigore Antipa" (NIMRD), Constanta, Romania laura_boicenco@cier.ro
Margarita V. Chikina, P.P.Shirshov Institute of Oceanology, RAS, Moscow, Russia
AdrianaCociasu, National Institute for Marine Research and Development (NIMRD), Constanta, Romania acociasu@alpha.rmri.ro
Georgi M. Daskalov, CEFAS Lowestoft laboratory, Lowestoft, Suffolk, United Kingdom georgi.daskalov@cefas.co.uk
Kristina Dencheva, Institute of Oceanology, Bulgarian Academy of Sciences, Varna, Bulgaria,
Yury Denga, Ukrainian Scientific Centre of the Ecology of Sea, Odessa, UKRAINE lawmd@te.net.ua
Camelia Dumitrache, National Institute for Marine Research and Development"Grigore Antipa" (NIMRD), Constanta, Romania iulia@alpha.rmri.ro
Victor N.Egorov, The A.O. Kovalevsky Institute of Biology of the Southern Seas, NASU, Sevastopol, Ukraine v.yegorov@ibss.org.ua
Sergei B. Gulin, The A.O. Kovalevsky Institute of Biology of the Southern Seas, NASU, Sevastopol, Ukraine
Vakhtang Gvakharia, Gamma, Tbilisi, GEORGIA
TsiuriGvarishvili, Georgian Marine Ecology and Fisheries Research Institute (MEFRI), Batumi, Georgia ciuri-gvarishvili@rambler.ru
Ludmila Kamburska, Institute of Oceanology, Bulgarian Academy of Sciences, Varna, Bulgaria lyudmila.kamburska@jrc.it
MeryKhalvashi, Georgian Marine Ecology and Fisheries Research Institute, Batumi, Georgia merikhal@rambler.ru
Ahmet Erkan Kideys, Bahcelievler Mahallesi, Aki Sokak, No 11, Uskudar, Istanbul, Turkey kideys@gmail.com
Douglas Knowler, School of Resource and Environmental Management Simon Fraser University, Burnaby, British Columbia, Canada djk@sfu.ca
Tzenka Konsulova, Institute of Oceanology, BAS, Varna, Bulgaria konsulova@io-bas.bg
Alexander Korshenko, State Oceanographic Institute, Moscow, RUSSIA korshenko@mail.ru
Nikita V. Kucheruk, P.P.Shirshov Institute of Oceanology, RAS, Moscow, Russia kucheruk@ocean.ru
Gennady V. Laptev, Ukrainian Hydrometeorological Institute, Kiev, Ukraine
Nino Machitadze, Gamma, Tbilisi, Georgia n_machitadze@yahoo.com
Olga V.Maximova,, P.P.Shirshov Institute of Oceanology RAS, Moscow, Russian Federation
EteriMickashavidze, Georgian Marine Ecology and Fisheries Research Institute (MEFRI), Batumi, Georgia
VeselinaMihneva, Institute of Fishing Resources, Varna, Bulgaria
Alexander Mikaelyan, P.P.Shirshov Institute of Oceanology RAS, Moscow, Russia mikael@ocean.ru
GalinaMinicheva, Odessa Branch, Institute of Biology of the Southern Seas, NASU, Odessa, Ukraine minicheva@eurocom.od.ua
Natalia Yu. Mirzoyeva, The A.O. Kovalevsky Institute of Biology of the Southern Seas, NASU, Sevastopol, Ukraine
SnejanaMoncheva, Institute of Oceanology,
Bulgarian Academy of Sciences, Varna, Bulgaria snejm@mail.varna.techno-link.com
Natalia A. Moruchkova, P.P.Shirshov Institute of Oceanology RAS, Moscow, Russian Federation
Eteri Musaeva, P.P.Shirshov Institute of oceanology Russian Academy of Sciences
Dina Nesterova, Odessa Branch, Institute of Biology of the Southern Seas, NASU, Odessa, Ukraine
Alexei I. Nikitin, SE SPA "Typhoon" of Roshydromet, Obninsk, Russia
TemelOguz, Institute of Marine Sciences, Middle East Technical University, Erdemli, Turkey oguz@ims.metu.edu.tr
AndraOros, National Institute for Marine Research and Development, Constanta, Romania andra@alpha.rmri.ro
Iolanda Osvath, Marine Environment Laboratories, International Atomic Energy Agency, Monaco
I.Osvath@iaea.org
Bayram Ozturk, Turkish Marine Research Foundation (TUDAV), Istanbul, Turkey ozturkb@istanbul.edu.tr
NicolaePanin, National Institute of Marine Geology and Geo-ecology GeoEcoMar, Romania panin@geoecomar.ro
G.G. Polikarpov, The A.O. Kovalevsky Institute of Biology of the Southern Seas, NASU, Sevastopol, Ukraine
LeonidPolishchuk, Odessa Branch, Institute of Biology of the Southern Seas, NASU, Odessa, Ukraine
Nikolai Revkov, Institute of Biology of the Southern Seas, NASU, Sevastopol, Ukraine nrevkov@yandex.ru
Fatih Sahin, Sinop University, Fisheries Faculty, 57000 Sinop, Turkey fthshn@hotmail.com
Alis Sburlea, National Institute for marine research and development "Grigore Antipa", Constanta, Romania,
MuratSezgin, Sinop University, Faculty of Fisheries, Sinop, Turkey msezgin@omu.edu.tr
Tamara Shiganova,, P.P.Shirshov Institute of oceanology Russian Academy of Sciences shiganova@ocean.ru
Vladislav A. Shlyakhov, YugNIRO, Kerch, Crimea, Ukraine fish@kerch.com.ua
Uliana V. Simakova, P.P.Shirshov Institute of Oceanology RAS, Moscow, Russian Federation
KremenaStefanova, Institute of Oceanology, Bulgarian Academy of Sciences, Varna, Bulgaria stefanova@www.io-bas.bg
Nikolai A.Stokozov, The A.O. Kovalevsky Institute of Biology of the Southern Seas, NASU, Sevastopol, Ukraine
Ahmet Nuri Tarkan, Mugla University, Faculty of Fisheries Mugla, Turkey tarkann@mu.edu.tr
FlorinTimofte, National Institute for Marine Research and Development "Grigore Antipa" (NIMRD), Constanta, Romania
Valentina Todorova, Institute of Oceanology, BAS, Varna, Bulgaria vtodorova@io-bas.bg
FundaUstun, Sinop University, Fisheries Faculty, Sinop, Turkey fundaustun@hotmail.com
MadonnaVarshanidze, Georgian Marine Ecology and Fisheries Research Institute (MEFRI), Batumi, Georgia mvarshanidze@yahoo.com
Violeta Velikova, 29 Inebolu Sokak, Kabatas, Istanbul, Turkey velikova_violeta@yahoo.com
AlexanderVershinin, P.P. Shirshov Institute of Oceanology Academy of Sciences, Russian Federation, alexander.vershinin@yahoo.com
Oleg V. Voitsekhovych, Ukrainian Hydrometeorological Institute, Kiev, Ukraine voitsekh@voi.vedos.kiev.ua
Table of Contents
CHAPTER 1A. GENERAL OCEANOGRAPHIC PROPERTIES:Â PHYSICO-CHEMICAL AND CLIMATIC FEATURES (T. Oguz)
1A.1. Main physical and chemical features
1.2.2. Circulation characteristics
CHAPTER 1B GENERAL OCEANOGRAPHIC PROPERTIES:Â GEOGRAPHY, GEOLOGY AND GEOCHEMISTRY (N. Panin)
1B.1 Geographic position and physiography
1B.2. Geology of the Black Sea
1B.3. Water and sediment supply from rivers
1B.4. Sedimentary systems of the Black Sea
1B.5. Past environmental and sea level changes in the Black Sea
CHAPTER 2 THE STATE OF EUTROPHICATION (T. Oguz et al.)
2.2. Long-term changes in river nutrient loads
2.3. Long-term changes in nutrient concentrations
2.4. Surface chlorophyll concentration_
2.5. Surface and near-bottom oxygen concentrations
2.6. Conclusions and key assessments
CHAPTER 3 THE STATE OF CHEMICAL POLLUTION (A. Korshenko et al.)
3.1. The State Of Total Petroleum Hydrocarbons (TPHs)
3.2. The State Of Chlorinated Pesticides
3.2.2. Bottom Sediments and Biota
3.3. The State Of Trace Metals
3.3.1. Ukrainian sector of the Black Sea - Northwestern region
3.3.2. Russian sector of the Black Sea - Northeastern region_
3.3.3. Georgian sector of the Black Sea - Southeastern region
3.3.4. Romanian sector of the Black Sea – Western region_
CHAPTER 4 THE STATE OF RADIOACTIVE POLLUTION (V. Egorov et al.)
4.2. Concentrations and inventories of radionuclides in the water column_
4.3. Concentrations and inventories of radionuclides in sediment
4.4. Radionuclides in marine biota
CHAPTER 5 THE STATE OF PHYTOPLANKTON (D. Nesterova et al.)
5.3. Long-term changes in algal blooms
5.4. Conclusions and recommendations
CHAPTER 6 THE STATE OF ZOOPLANKTON (T. Shiganova et al.)
CHAPTER 7 THE STATE OF MACROPHYTOBENTHOS (G. Minicheva et al.)
7.6. Northeastern (Russian) shelf area
CHAPTER 8 THE STATE OF ZOOBENTHOS (N. Revkov et al.)
8.3.1. Peculiarities of zoobenthos during the previous state of ecosystem_
8.3.2. Peculiarities of zoobenthos during the present state of ecosystem_
8.4.1. Characteristics of major zoobenthic communities
8.4.2. Spatial patterns of diversity, abundance and biomass distribution
8.4.3. Assessment of recent ecological state
8.4.4. Long-term trends in species diversity, abundance and biomass
CHAPTER 9 THE STATE OF MARINE LIVING RESOURCES (V. Shlyakhov & G. Daskalov)
9.2. The state of key anadromous fishes
9.3. The state of key pelagic fishes
9.3.4. Ecosystem effects on pelagic fisheries
9.4. The state of populations of key demersal fishes
9.4.4. Striped and red mullets
9.5.2. Sea snail (Rapana spp.)
CHAPTER 10 THE STATE OF CETACEAN POPULATIONS (A. Birkun)
10.2. Harbour porpoise (Phocoena phocoena relicta Abel, 1905)
10.2.6. Past and ongoing threats
10.3. Short-beaked common dolphin (Delphinus delphis ponticus)
10.3.6. Past and ongoing threats
10.4. Common bottlenose dolphin (Tursiops truncatus ponticus)
10.4.6. Past and ongoing threats
10.5. Conservation tools and strategies
10.5.2. International and regional instruments
10.5.4. Conservation plan for Black Sea cetaceans
Appendix B. Conservation Plan for Black Sea Cetaceans: aims of actions proposed
Appendix C. Conservation Plan for Black Sea Cetaceans: actions and activities of high priority
CHAPTER 11 SOCIO-ECONOMIC PRESSURES AND IMPACTS (D. Knowler)
11.2. Valuing the Environmental Goods and Services Provided by the Black Sea
11.3. Socio-economic and Institutional Pressures
11.4. Consequences of Environmental Change in the Black Sea
11.5. Sustainability: Progress and Prospects
CHAPTER 12 OVERALL ASSESSMENT OF THE PRESENT STATE OF BLACK SEA ECOSYSTEM (T. Oguz et al.)
12.2. Mesoscale variability of the circulation system_
12.3. Climatic regulation of the Black Sea
12.4. Eutrophication/Nutrient enrichment
12.6. Biodiversity change, habitat destruction, alien species invasions
12.7. Status of marine living resources
List of Tables
Table 3.1.5. TPHs concentrations in different water layers along the Russian coast in 2002-2006.
Table 5.1. Taxonomic composition of Black Sea phytoplankton in Ukraine waters.
Table 5.3. Phytoplankton species distributed along the Turkish Coast of Black Sea.
Table 7.2. Long term changes in the species composition of algae of the Zernov Phyllophora Field.
Table 7.6. Changes in species structure of different types of macrophytes in Varna Bay.
Table 7.7. Changes in saprobic structure of macrophytes in Varna Bay in the years of investigation.
Table 7.8. Bulgarian and Black Sea macroalgae taxonomic composition.
Table 7.9. Comparison of floristic indices along the Bulgarian coastline.
Table 7. 11. Dominancy in division level among of Black Sea coast of Turkey (Aysel et al., 2005).
Table 8.1. Basic taxa of macrozoobenthos along the NW and Crimean coastlines.
Table 8.6. Some indicator zoobenthic species in the southern Black Sea.
Table 8.8. Number of stations made during surveys on R/V “Akvanavtâ€.
Table 9.6. Fish stocks protection measures for whiting implemented by the Black Sea countries.
Table 9.9. Some studies carried out in the Black Sea regions on turbot stocks.
Table 9.11. Landings of mullets in the Black Sea according to the official statistics (tons).
Table 9.12. Landings of Mediterranean mussel and sea snail in the Black Sea (tons).
Table 9.13. Indicators for the fisheries in the Black Sea for 1970 – 2005 (Caddy’s method) .
Table 10.1. Taxonomic status of Black Sea marine mammals.
Table 10.2. Geographic range of Black Sea cetaceans.
Table 10.5. Life history parameters of Black Sea cetaceans.
Table 10.6. Known (documented) threats to Black Sea cetaceans1
Table 11.1. Estimated Value of Black Sea Coastal Wetlands (US$/ha/yr)
Table 11.2. Living Marine Resources of the Black Sea and their Values.
Table 11.3. Demographic Data for the Black Sea Countries and their Coastal Zones, Selected Years.
Table 11.4. Selected Economic Data for the Black Sea Countries, 1995 to 2000 and 2001 to 2005.
Table 11.6. Fishery Statistics for the Black Sea during 1995-2000 and 2001-2005.
Table 11.7... General Tourism Statistics for Black Sea Countries.
Table 11.9. Degree of Health Risk Associated with Various Aspects of Black Sea Pollution.
Table 11.11. Preliminary Socio-economic Indicators for the Black Sea.
List of figures
Fig. 1B.1. Geomorphologic zoning of the Black Sea (after Ross et al.,1974, Panin and Ion, 1997).
Fig. 1B.2. Tectonic sketch of the Black Sea Region (after Dinu et al., 2003; Panin et al., 1994).
Fig. 1B.4. Main sedimentary environments in the northwestern Black Sea (after Panin et al., 1998).
Fig. 3.1.1. Average Total Petroleum Hydrocarbons distribution (mg/l) at 11-20 September 1998.
Fig. 3.1.3. Division of the Russian coastal waters in terms of TPHs pollution.
Fig. 3.1.5. Oil spills in the northeastern part of the Black Sea in 2006 and 2007.
Fig. 3.3.1 Concentration of cadmium (µg/l) in Ukrainian marine waters in 1995-2000.
Fig. 3.3.2 Concentration of mercury (µg/l) in Ukrainian marine waters in 1995-2000.
Fig. 3.3.3. Concentration of lead (µg/l) in Ukrainian marine waters in 1995-2000.
Fig. 3.3.4 Concentration of zinc (µg/l) in Ukrainian marine waters in 1995-2000.
Fig. 3.3.5 Concentration of copper (µg/l) in Ukrainian marine waters in 1995-2000.
Fig. 3.3.6 Concentration of arsenic (µg/l) in Ukrainian marine waters in 1995-2000.
Fig. 3.3.7 Concentration of chromium (µg/l) in Ukrainian marine waters in 1995-2000.
Fig. 3.3.9. Trace metal average values (2000 – 2005) in seawater along Romanian littoral
Fig. 3.3.10. Trace metal average values (2000 – 2005) in sediments along Romanian littoral
Fig. 5.1. Phytoplankton species diversity by taxonomic classes in the Bulgarian shelf.
Fig. 5.5c. Number of blooming species in the coastal area of the Odessa Bay.
Fig. 5.6. Change in annual-mean density and biomass of phytoplankton in 1983-2006 in Constanta.
Fig. 5.12. Average annual abundance and biomass of phytoplankton in Georgian waters in 1992-2005.
Fig. 6.13. N. scintillans spring-autumn mean abundance (ind.m-3) along the Bulgarian coastal waters.
Fig. 7.5. Biomass distribution of macrophytes along the investigated transects in 1994.
Fig. 7.8. Map for the coastal regions along the Turkish coast of the Black Sea.
Fig. 7.10. Cystoseira biomass dynamics (1970s: Kalugina-Gutnik, 1975).
Fig. 7.11. Phyllophora biomass dynamics. Data source for 1970s: Kalugina-Gutnik (1975).
Fig. 8.6. Benthic belts of the Black Sea shelf (from Zaika, 1998, with additions).
Fig. 8.10. Long-term changes of macrozoobenthos biomass at the western coast of Crimea.
Fig. 8.17 – Changes in zoobenthic average biomass at different depths in the pre-Danubian sector.
Fig. 8.18. Change of species diversity in the Constanta marine sector between 1993 and 2002.
Fig. 8.34. Location of sampling transects in 2001-2007.
Fig. 9.1. Commercial exploitation of Marine Living Resources in the Black Sea in 1996 – 2005.
Fig. 9.2. Total capture production of Marine Living Resources in the Black Sea in 1989 – 2005.
Fig. 9.3. Total capture production of main anadromous fishes in the Black Sea during 1989 – 2005.
Fig. 9.5. Changes in Pontic shad catches in the Black Sea basin in 1989 – 2005.
Fig. 9.7. Total catch of main pelagic fishes in the Black Sea during 1989 – 2005.
Fig. 9.11. Total catch of main demersal fishes in the Black Sea during 1989 – 2005.
Fig. 9.19. Total catch of main mollusks in the Black Sea in 1989 – 2005.
Fig. 9.20. Harvesting of striped venus in the Black Sea along the Turkish coasts.
Fig. 9.21. Total capture production of main water plants in the Black Sea in 1989 -2005.
CHAPTER 1A. GENERAL OCEANOGRAPHIC PROPERTIES: PHYSICO-CHEMICAL AND CLIMATIC FEATURES (T. Oguz)
Middle East Technical University, Erdemli, Turkey
1A.1. Main physical and chemical features
The Black Sea is a strongly stratified system; its stratification within the upper 100 m layer (10% of the entire water column) varies up to a density of st ~5 kg m-3 (Fig. 1A.2.1) and is an order of magnitude greater than, for example, in the neighboring Mediterranean Sea. The pycnocline corresponding to the density surface st ~16.2 kg m-3 approximately conforms to 150 m depth within the interior cyclonic cell or may extend to 200 m within coastal anticyclones. The deep homogenous layer that has a thickness of 2000 m within the abyssal plain of the sea possesses almost vertically uniform characteristics below 200 m within the range of values of temperature (T) of ~ 8.9-9.1oC, salinity (S) of ~ 22-22.5, and st ~ 17.0-17.3 kg m-3. The deepest part of the water column approximately below 1700 m involves homogeneous water mass formed by convective mixing due to the bottom geothermal heat flux during the last several thousands of years (Murray et al., 1991).
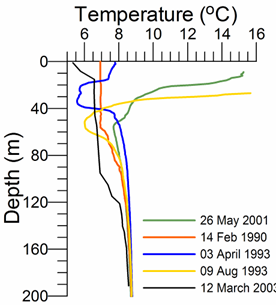
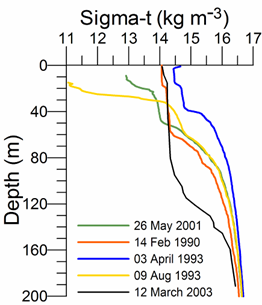
Fig. 1A.2.1. Vertical variations of temperature (oC) and density (expressed in terms of sigma-t, kg m-3) at various locations of the interior basin during different months representing different types of vertical structures (the data are retrieved from the IMS-METU data base; http: sfp1.www.ims.metu.tr/ODBMSDB/).
The upper 50-60 m is homogenized in winter with T~6-7 oC, S ~18.5-18.8, st ~14.0-14.5 kg m-3 when the northwestern shelf and near-surface levels of the deep basin exposed to strong cooling by successive cold-air outbreaks, intensified wind mixing, and evaporative loss. Two examples are depicted in Fig. 1A.2.1 for the interior cyclonic cell at the time of intermediate level convection event during 14 February, 1990 and immediately after one of the most severe winters of the last century (April 3, 1993) during which the mixed layer temperature reduced to ~5.5 oC. Yet another observation of winter convection event within an anticyclonic eddy closer to the southern coast (41.39oN, 30oE) during March 2003 is shown in Fig. 1A.2.1. This event cooled the surface mixed layer to 6.5��C within 90 m layer that is roughly twice deeper than those observed in the cyclonic interior basin.
As the spring warming stratifies the surface water, the remnant of the convectively-generated cold layer is confined below the seasonal thermocline and forms the Cold Intermediate Layer (CIL) of the upper layer thermohaline structure (Fig. 1A.2.1). Following severe winters, the CIL may preserve its structure for the rest of the year, but it may gradually warm up and loose its character in the case of warm winter years. These alternative structures are shown in Fig. 1A.2.1. Stratification in summer months comprises a surface mixed layer with a thickness of 10-20 m with T~22-26oC, S~18-18.5 and st ~10.5-11.5 kg m-3.
An important feature of the upper layer physical structure is the intensity of diapycnal mixing that controls ventilation of the CIL and oxygen deficient zone and nutrient entrainment from its subsurface source in winter months. According to the recent microstructure measurements (Gregg and Yakushev, 2005 and Zatsepin et al. 2007), the vertical diffusivity attains its maximal values on the order of 10-3����� 10-4 m2 s−1 in the surface mixed layer (0�����15 m), but decreases to�� 10-5�����10-6 m2 s−1 across the seasonal thermocline (15�����30 m). An increase in the diapycnal diffusivity is observed in the CIL to the range 2�����6 x 10⁻⁵ m2 s−1. Below the base of the CIL, it rapidly decreases to its background values of 1�����4���10-6 m2 s−1. Consequently, turbulent fluxes near the base of CIL are too weak to renew the oxygen deficient Suboxic Layer (SOL).
The Mediterranean underflow that is characterized typically by T~13-14 oC and S~35-36 upon issuing from the Bosporus modifies considerably by mixing with the upper layer waters and enters the shelf with T~12-13 oC and S~28-30. In the shelf, its track is regulated by small scale topographic variations. As it spreads out as a thin layer along the bottom, it is diluted by entrainment of relatively colder and less saline CIL waters and is barely distinguished by its slight temperature and salinity differences from the ambient shelf waters up on issuing the shelf break. The modified Mediterranean water is then injected in the form of thin multiple layers at intermediate depths (150-250 m) (Hiscoock & Millero, 2006; Glazer et al, 2006). Signature of the Mediterranean inflow within the interior parts of the basin can be best monitored up to 500 m, where the residence time of the sinking plume varies from ~10 years at 100 m depth to ~400 years at 500 m (Ivanov and Samodurov, 2001; Lee et al., 2002).
The upper layer biogeochemical structure that overlies the deep and lifeless anoxic pool (except anaerobic bacteria) involves four distinct layers (Fig. 1A.2.2). The uppermost part extending to the depth of 1% light level (a maximum thickness of nearly 50 m) characterizes active biological processes (e.g. nutrient uptake, plankton grazing, mortality, microbial loop, etc.), high oxygen concentrations (~300 ��M) and seasonally varying nutrient and organic material concentrations supplied laterally from rivers and coastal zones and vertically from sub-surface levels through vertical mixing. In the interior basin, surface mixed layer waters are poor in nutrients for most of the year except occasional incursions from coastal regions and by wet precipitation. Below the seasonal thermocline and in the deeper part of the euphotic zone, nutrient concentrations increase due to their recycling as well as continuous supply from the nutricline. Nitrate accumulation in this light-shaded zone generally supports summer subsurface phytoplankton production. In winter, nutrient stocks in the euphotic zone are renewed from the nutricline depths through upwelling, vertical diffusion and seasonal wind and buoyancy-induced entrainment processes and depleted by biological utilization.
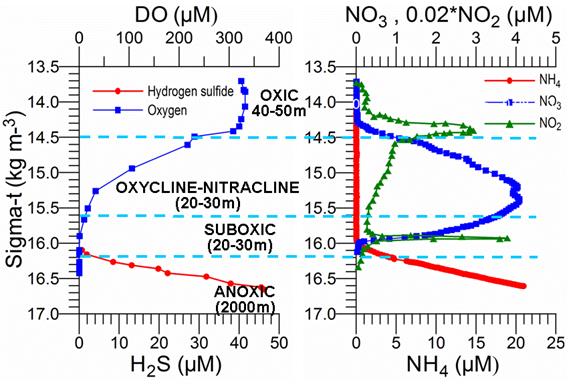
Fig. 1A.2.2.�� O2 and H2S profiles (left) and NO3, NO2 and NH4 profiles (right) versus density expressed in sigma-t (kg m-3) in the center of the eastern gyre of the Black Sea during May 2003. The data source: http://www.ocean.washington.edu/cruises/Knorr2003/index.html.
The euphotic layer oxygen concentration undergoes pronounced seasonal variations within a broad range of values from about 250 to 450 ��M. The period from the beginning of January until mid-March exhibits vertically uniform mixed layer concentrations of ~300-350 ��M, ventilating the upper ~50 m of the water column as a result of convective overturning. The rate of atmospheric oxygen input in the ventilation process is proportional to the excess of saturated oxygen concentration over the surface oxygen concentration. The maximum contribution of oxygen saturation is realized towards the end of February during the period of coolest mixed layer temperatures, coinciding with the maximum and deepest winter oxygen concentrations during the year. After March, initiation of the warming season is accompanied by oxygen loss to the atmosphere and decreasing solubility, thus reducing oxygen concentrations within the uppermost 10 m to 250 ��M during the spring and summer months. A subsequent linear trend of increase across the seasonal thermocline links low near-surface oxygen concentrations to relatively higher sub-thermocline concentrations. Depending on the strength of summer phytoplankton productivity, the sub-thermocline concentrations exceed 350 ��M in summer.
The upper boundary of oxycline where oxygen concentration starts decreasing from ~300 μM corresponds to st ~14.4�����14.5 kg m-3 (35�����40 m) isopycnal surfaces in cyclonic regions (Fig. 1A.2.2) and st ~14.0�����14.2 kg m-3 (70�����100 m) in coastal anticyclonic regions (Fig. 1A.2.3). The lower boundary of oxycline is defined by 10 μM oxygen concentration located generally at st ~15.6 kg m-3. Oxygen concentrations finally vanish above the anoxic interface located at st ~16.2 kg m-3. The oxygen deficient (O2 < 10 ��M), non-sulfidic layer having a thickness of 20-to-40 m coinciding with the lower nitracline zone is referred to as the "Suboxic Layer (SOL)" (Fig. 1A.2.2). Since identified by Murray et al. (1989, 1991), it has been observed consistently all over the basin with almost similar characteristics. Analyzing the available data after the 1960s, Tugrul et al. (1992), Buesseler et al. (1994) and Konovalov and Murray (2001) showed that the suboxic zone was present earlier, but it was masked in the observations because of low sampling resolution and contamination of water samples with atmospheric oxygen. These earlier observations measured dissolved oxygen concentrations more than 10 ��M inside the sulfidic layer (Sorokin, 1972; Faschuk, et al., 1990; Rozanov et al., 1998).
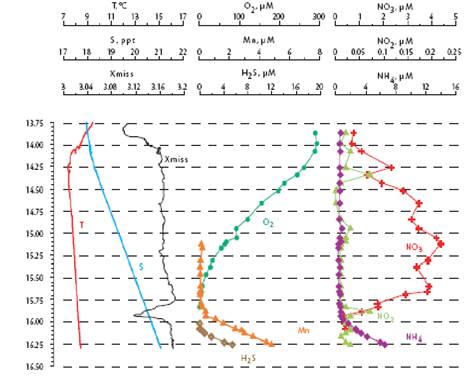
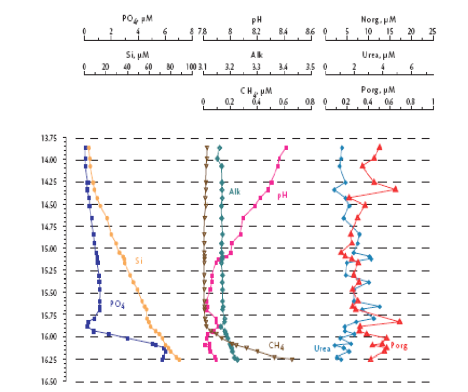
Fig. 1A.2.3. Vertical distribution of temperature (T), salinity (S), transmission (Trans), oxygen (O2), hydrogen sulfide (H2S), total manganese (Mn2+), silicates (Si), nitrates (NO3), nitrites (NO2), ammonia (NH4), urea (Urea), phosphates (PO4), and organic phosphorus (Porg) at a summer station near Gelendzhik, along the eastern coast of the Black Sea. Concentrations of chemical parameters are in μM (after Yakushev et al., 2005).
The SOL structure is subject to temporal and regional modifications during the periods of enhanced phytoplankton production in the surface layer. For example, the R.V Knorr May-June 2001 survey conducted within the western basin during a phytoplankton bloom episode (Oguz and Ediger, 2007) showed gradual change in the position of the oxycline and the upper boundary of the SOL up to σt~15.15 kg m-3 within less than a month.�� On the other hand, the oxygen profiles in the southwestern Black Sea shelf-slope region displayed another extreme case with lenses of high oxygen content (~20 μM) within the Suboxic Layer and its interface with the anoxic layer due to the intrusions of relatively oxygen rich Mediterranean underflow (Hiscoock & Millero, 2006; Glazer et al, 2006). In anticyclones, the upper boundary of SOL is located at deeper levels (~15.8 kg m-3) and therefore the SOL is relatively shallow (around 10-20 m) (Oguz et al., 2003).
Only a small fraction (~10%) of particulate flux is exported to deeper anoxic part of the sea (Lebedeva and Vostokov, 1984; Karl and Knauer, 1991). This loss is compensated excessively by lateral nitrogen supply mainly from the River Danube, by wet deposition and nitrogen fixation. The nutrient fluxes of anthropogenic origin are transported across the shelf and around the basin through the Rim Current system, and spread ultimately over the interior basin and form a major source of nitrate enrichment of the euphotic zone, while some is lost through Bosporus surface flow (Polat and Tugrul, 1995). The river influence markedly weakens toward the south along the coast and offshore for most of the year due to photosynthetic consumption of dissolved inorganic nutrients and sedimentation within the northwestern and western shelves. The river supply gives rise to a high N/P ratio within northwestern-western shelf that makes phosphate as the primary limiting nutrient along the coastal zone. The outer shelf appears to possess weakly nitrogen or phosphorus limited system, but the interior basin and major part of the sea is strongly nitrogen limited.
When nitrate profiles are plotted against density, the position of its peak concentration (6.0 �� 2.0 ��M) coincides approximately with the st ~15.5 �� 0.1 kg m-3 level (Figs. 1.2.2 and 1.2.3). Some degree of variability is, however, observed in its position and concentration in the western interior basin particularly in the vicinity of the wide topographic slope zone adjacent to the northwestern shelf. The nitrate structure is accompanied by occasional peaks of ammonium and nitrite on the order of 0.5 ��M and 0.1 ��M, respectively, near the base of the euphotic zone due to inputs from excretion and aerobic organic matter decomposition following subsurface plankton production (Fig. 1A.2.2). They, however, rapidly deplete below the euphotic zone.��
Within the oxygen deficient layer below st ~15.6 kg m-3, organic matter decomposition via denitrification, and oxidation of reduced manganese and iron result in a sharp decrease of nitrate concentration to trace values at st ~16.0 kg m-3 isopycnal surface (Figs. 1.2.2 and 1.2.3). As nitrate is reduced to nitrogen gas, nitrite formed as an intermediate product marks the limits of denitrification zone; its peak concentration up to 0.2 ��M is usually observed at st ~15.85��0.05 kg m-3 (Fig. 1A.2.2 and 1.2.3). Nitrite is often used to oxidize ammonium (the anammox reaction; NO2-+NH4+→N2) as documented recently (Kuypers et al., 2003). The deep sulphide-bearing waters contain no measurable nitrate, but constitute large pools of ammonium and dissolved organic nitrogen. Ammonium concentration increases sharply below st ~16.0 kg m-3, reach at values of 10 ��M at 150 m (st ~16.5 kg m-3) and 20 ��M at 200 m (st ~16.8 kg m-3) (Fig. 1A.2.3). The gradient of ammonium profiles in the vicinity of the suboxic-anoxic interface suggests no ammonium supply to the euphotic zone from the anoxic region.
The vertical structure of phosphate concentration resembles nitrate in the upper layer but has a more complex structure in the suboxic-anoxic layers (Fig. 1A.2.3). Phosphate concentrations increase gradually within the deeper part of euphotic layer up to a maximum value of 1.0-1.5 ��M around st ~15.6 kg m-3, and then decreases to minimum of about 0.5 ��M at st ~15.9��0.1 kg m-3 where nitrite locally displays a peak. It then increases abruptly to peak values of 5.0-8.0 ��M near st ~16.2 kg m-3 that coincides with the first appearance of sulfide in the water column and therefore coincides with the anoxic boundary. Formation of this peak has been explained by dissolution of phosphate-associated iron and manganese oxides. Silicate possesses a relatively simple vertical structure with a steady increase of concentrations below the euphotic layer up to about 70-75 ��M at st ~16.2 kg m-3 and then to about 150 ��M at st ~16.8 kg m-3 (Fig. 1A.2.3).
The boundary between the suboxic and anoxic layers involves a series of complicated redox processes. As dissolved oxygen and nitrate concentrations vanish, dissolved manganese, ammonium and hydrogen sulfide concentrations begin to increase (Fig. 1A.2.3). Marked gradients of particulate manganese around this transition zone near st ~16.0 kg m-3 reflect the role of manganese cycling. The deep ammonium, sulfide and manganese pools have been accumulating during the last 5000 years as a result of organic matter decomposition after the Black Sea has been converted into a two-layer stratified system.
The anaerobic sulfide oxidation and nitrogen transformations coupled to the manganese and iron cycles form the first-order dynamics maintaining stability of the interface structure between the suboxic and anoxic layers. The upward fluxes of sulfide and ammonium are oxidized by Mn(III, IV) and Fe(III) species, generated by Mn(II) and Fe(II) oxidation in reactions with nitrate. The upward flux of ammonium is also oxidized by NO2- via anammox reaction (Kuypers et al., 2003). These oxidation-reduction reactions are microbially catalyzed, but dissolved chemical reduction may also play a role in Mn(IV) reduction with sulfide. Trouwborst et al. (2006) have recently shown the key role of soluble Mn(III) in manganese catalytic redox cycle. Mn(III) acquires a second peak at the top of the SOL, just below the layer where O2 disappears and particulate and dissolved manganese starts increasing with depth.
Anaerobic photosynthesis is an additional mechanism contributing to the oxidation-reduction dynamics near the anoxic interface. The reduced chemical species (HS-, Mn2+, Fe2+) are oxidized by anaerobic phototrophic bacteria in association with phototrophic reduction of CO2 to form organic matter. This mechanism was supported by the discovery of large quantities of bacteriochlorophyll pigments near the suboxic-anoxic boundary (Repeta et al., 1989; Repeta and Simpson, 1991; Jorgensen et al., 1991; Jannasch et al., 1991). A particular bacterium is capable of growth using reduced S (H2S or S0) at very low light levels (<<0.1% of the incident radiation at the surface). Its contribution, however, is mostly limited to cyclonic regions where the anoxic interface zone is shallow enough to be able to receive sufficient light to maintain photosynthetic activity. The third mechanism is direct oxidation of H2S by oxygen and particulate manganese near the interface layer. Konovalov and Murray (2001) show that more than 50% of the upward flux sulfide could be consumed by this pathway.
1.2.2. Circulation characteristics
The upper layer waters of the Black Sea are characterized by a predominantly cyclonic, strongly time-dependent and spatially-structured basin-wide circulation. Many details of the circulation system have been explored by the recent hydrographic data (Oguz et al., 1994; 1998; Oguz and Besiktepe, 1999; Gawarkiewicz et al., 1999; Krivosheya et al., 2000), Lagrangian floats (Afanasyev et al., 2002; Poulain et al., 2005; Oguz et al., 2006), the satellite AVHRR and ocean color data (Oguz et al., 1992; Sur et al., 1994, 1996; Sur and Ilyin, 1997; Ozsoy and Unluata, 1997; Ginsburg et al., 2000, 2002a,b; Afanasyev et al., 2002; Oguz et al., 2002a; Zatsepin et al., 2003), altimeter data (Korotaev et al., 2001 and 2003; Sokolova et al., 2001), as well as modeling studies (e.g. Oguz et al.,1995; Stanev and Beckers, 1999; Besiktepe et al., 2001; Staneva et al., 2001; Beckers et al., 2002; Korotaev et al., 2003).
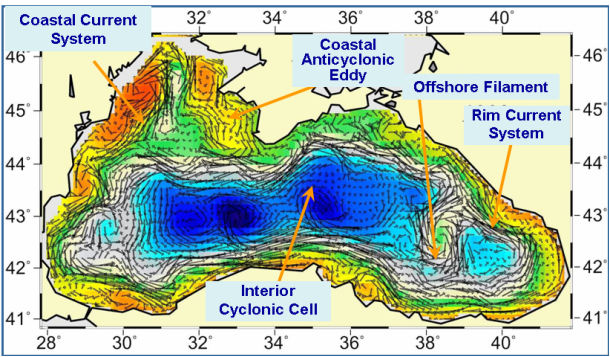
Fig. 1A.2.4. A typical structure of the upper layer circulation field deduced from a circulation model using assimilation of altimeter sea level anomaly data as described by Korotaev et al. (2003).��
These analyses reveal a complex, eddy-dominated circulation with different types of structural organizations of water masses within the interior cyclonic cell, the Rim Current jet confined mainly along the abruptly varying continental slope and margin topography around the basin, and a series of anticyclonic eddies along onshore side of the Rim Current (Fig. 1A.2.4). The interior circulation consists of several sub-basin scale gyres, each of which is formed by several cyclonic eddies. They evolve continuously by interactions among each other, as well as with meanders and filaments of the Rim Current. The overall basin circulation is primarily forced by the curl of wind stress throughout the year, and further modulated by the seasonal evolution of the surface thermohaline fluxes and mesoscale features arising from the basin�����s internal dynamics. The strong topographic slope together with the coastline configuration of the basin governs the main pattern of the Rim Current system but it modulates seasonally from a more coherent structure in the winter and spring to more turbulent structure in the late summer and autumn. The fresh water discharge from the Danube contributes to buoyancy-driven component of the basin-wide cyclonic circulation system. Baroclinic instability processes are responsible by introducing considerable variability of the Rim Current in the form of eddies, meanders, filaments, offshore jets that propagate cyclonically around the basin. Over the annual time scale, westward propagating Rossby waves further contribute to the complexity of basin wide circulation system (Stanev and Rachev, 1999). Eddy dynamics and mesoscale features evolving along the periphery of the basin as part of the Rim Current dynamic structure appear to be the major factor for the shelf-deep basin exchanges. They link coastal biogeochemical processes to those beyond the continental margin, and thus provide a mechanism for two-way transports between near shore and offshore regions.
The ship mounted Acoustic Doppler Current Profiler (ADCP) and CTD measurements in the western Black Sea (Oguz and Besiktepe, 1999), carried out soon after an exceptionally severe winter conditions in 1993, provided striking findings in regards to the intensity and vertical structure of Rim Current in the western basin. The data has shown a vertically uniform current structure in excess of 50 cm/s (maximum value ~100 cm/s) within the upper 100 m layer, followed by a relatively sharp change across the pycnocline (between 100 and 200 m) and the vertically uniform sub-pycnocline currents of 20 cm/s (maximum value ~40 cm/s) up to 350 m being the approximate limit of ADCP measurements. The cross-stream velocity structure exhibited a narrow core region (~30 km) of the Rim Current jet that was flanked by a narrow zone of anticyclonic shear on its coastal side and a broader region of cyclonic shear on its offshore side. Such exceptionally strong sub-pycnocline currents of the order of 20-40 cm/s should be largely related with the severity of the winter conditions that was indeed one of the most severe winters of the last century (Oguz et al., 2006). The corresponding geostrophically-estimated currents from the CTD measurements were relatively weak due to the lack of ageostrophic effects and barotropic component of the current.
Contrary to the jet-like flow structure over the continental slope along the southern coast, the currents measured by ADCP over the northwestern shelf (NWS) were generally weaker than 10 cm/s (Oguz and Besiktepe, 1999). Relative weakness of the shelf currents is consistent with the fact that the continental slope acts as an insulator limiting the effects of Rim Current and mesoscale features propagating over the wide topographic slope zone between the NWS and the deep interior.
Apart from complex eddy-dominated features, larger scale characteristics of the upper layer circulation system possess a distinct seasonal cycle (Korotaev et al., 2003; Poulain et al., 2005). The interior cyclonic cell in winter months involves a well-defined two-gyre system surrounded by a rather strong and narrow jet without much lateral variations. This system gradually transforms into a multi-centered composite cyclonic cell surrounded by a broader and weaker Rim Current zone in summer. The interior flow field finally disintegrates into smaller scale cyclonic features in autumn (September-November) in which a composite Rim Current system is hardly noticeable. The turbulent flow field is rapidly converted into a more intense and organized structure after November-December.
The basic mechanism which controls the flow structure in the surface layer of the northwestern shelf is spreading of the Danube outflow. Wind stress is an additional modifier of the circulation. The Danube anticyclonic eddy confines within a narrow band along the coast between Odessa and Constanta and is introduced by the wind forcing prevailing for almost half of the year during spring and summer months (Fig. 1A.2.5a,b). It sometimes expands and occupies almost the whole NWS region (Fig. 1A.2.5b). The Constanta and Kaliakra anticyclones located further south have a typical lifespan of 50 days and are observed for about 190 days per year.
An alternative configuration of the River Danube plume is the southward coastal current system (Fig. 1A.2.5a). The leading edge of this plume protrudes southward (i.e. downstream) as a thin baroclinic boundary current along the western coastline. The flow system is separated from offshore waters by a well defined front as inferred from the large contrast between the chlorophyll concentrations in the figure. Its offshore flank may display unstable features, exhibits meanders and spawns filaments extending across the wide topographic slope zone (Fig. 1A.2.5b). Except such small scale features, there is almost no exchange between shelf and interior basin.
All available finding of the Black Sea circulation system suggest that the most notable quasi-persistent and/or recurrent features of the circulation system, as schematically presented in Fig. 1A.2.6, include (i) the meandering Rim Current system cyclonically encircling the basin, (ii) two cyclonic sub-basin scale gyres comprising four or more gyres within the interior, (iii) the Bosporus, Sakarya, Sinop, Kizilirmak, Batumi, Sukhumi, Caucasus, Kerch, Crimea, Sevastopol, Danube, Constanta, and Kaliakra anticyclonic eddies on the coastal side of the Rim Current zone, (iv) bifurcation of the Rim Current near the southern tip of the Crimea; one branch flowing southwestward along the topographic slope zone and the other branch deflecting first northwestward into the shelf and then contributing to the southerly inner shelf current system, (v) convergence of these two current systems near the southwestern coast, (vi) presence of a large anticyclonic eddy within the northern part of the northwestern shelf.
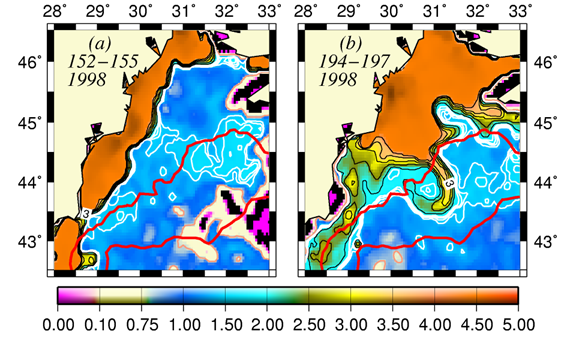
Fig. 1A.2.5. SeaWiFS chlorophyll distributions showing two alternative forms of circulation structure in the northwestern shelf; (a) a southward coastal current system during days 152-155 (early June) and (b) a closed circulation system confined into its northern sector during days 194-197 (mid-July), 1998 (from Oguz et al., 2001).
Lagrangian subsurface current measurements by three autonomous profiling floats deployed into the intermediate layer and deep layers permitted new insights on strength and variability of the flow field (Korotaev et al., 2006). They, for the first time provided direct, quantitative evidence for strong currents and a well organized flow structure that changed the traditional views built on a rather sluggish deep circulation of the Black Sea. The data suggested active role of mesoscale features on the basin-wide circulation system at 200 m similar to the case observed in the upper layer (<100 m) circulation system.�� The currents reach a maximum intensity of 15 cm s-1 along the Rim Current jet around the basin, which is consistent with the findings of ADCP measurements (Oguz and Besiktepe, 1999).
The magnitudes of deep currents may reach to 5 cm s-1 at 1500 m depth along the steep topographic slope (Korotaev et al., 2006). The combination of float and altimeter data suggests that deep currents are steered by the steep topographic slope and well-correlated with the structure of surface currents at seasonal and longer time scales. The deep layer currents flow along the strong topographic slope following constant potential vorticity isoclines due to the topographic β-effect. The wind stress, as the main driving force, can introduce a barotropic flow on the order of 5 cm s-1 as further supported by the numerical modeling studies (Stanev, 1990; Oguz et al., 1995; Stanev and Beckers, 1999).�� The floats at the intermediate (750 m) and deep (1550 m) layers also delineate the importance of mesoscale eddies on the flow field.
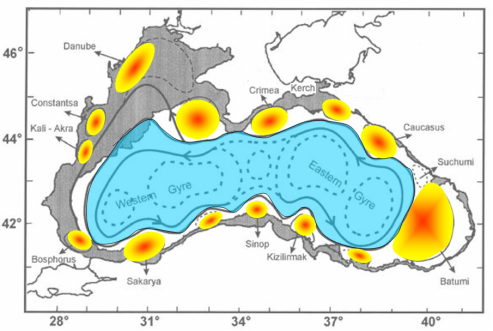
Fig. 1A.2.6 Schematic diagram for major quasi-permanent/recurrent features of the upper layer circulation identified by synthesis of hydrographic studies and analysis of the sea level anomaly altimeter data (modified from Korotaev et al. 2003).
1.2.3. Climatic properties
Water budget: On the basis of available data since the 1920s (Ilyin et al., 2006), the total river discharge and precipitation into the sea show weak but opposite trends that compensate each other and therefore their sum remain uniform at ~550 km3 y-1 (Fig. 1A.2.7). Evaporation varied slightly around 400 km3 y-1 up to the mid 1970s (except 15% increase in the 1940s), and then decreased steadily to ~300 km3 y-1 during the subsequent 15 years and stabilized at this value afterwards. The net fresh water flux into the sea, therefore, revealed an increasing trend from ~120 km3 y-1 in the early 1970s to ~300 km3 y-1 in the mid-1990s with additional fluctuations of ~100 km3 y-1. Its difference from the temporal volume change of the sea (which in fact may be calculated by the sea level data) implies a nearly two-fold change in the net outflow from the Black Sea into the Bosporus during the second half of the 1990s with respect to the 1960s.
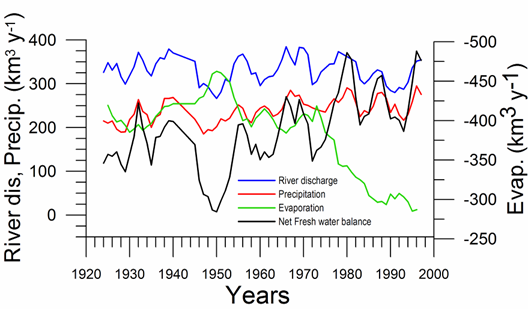
Fig. 1A.2.7 Long-term variations of the river discharge, precipitation, evaporation (km3 y-1) for the Black Sea together with net water flux and the corresponding net Bosphorus inflow from the Black Sea (after Ilyin et al., 2006).
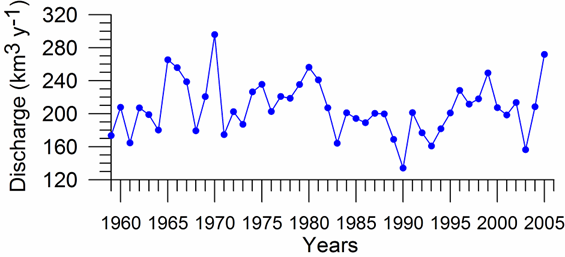
Fig. 1A.2.8. Yearly changes of the Danube discharge (km3 y-1) during 1960-2005 (data provided by A. Cociasu).
One of the implications of water budget analysis is a continuous trend of decrease of the total river discharge from the early 1980s to the mid-1990s and then an increase during the rest of the 1990s. The Danube discharge was mainly responsible for these changes as it decreased to 100 km3 y-1 in the 1980s (up to 1993) and started increasing again by the same amount during the 1990s (Fig. 1A.2.8). A similar reduction took place once again during 2000-2003, but 2004-2005 was a recovery phase to the level in the 1999. A closer inspection of its monthly variations (Fig. 1A.2.9) in fact reveals two different modes of variations depending on the regional climatic variations. Some years (e.g. 1993, 1995, 2000, 2001, 2002, 2004, and 2005) were characterized only by the spring peak. The years 1994, 1996-1999 attained both winter and spring peaks, whereas no spring discharge occurred in 2003. A limited Danube inflow took place previous autumn and winter months of this particular anomalous year and therefore the Black Sea received the lowest discharge rate from the Danube since the beginning of the 1990s.
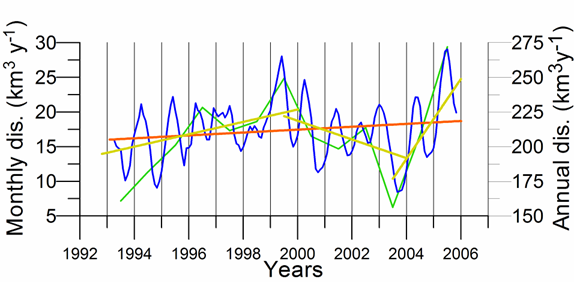
Fig. 1A.2.9. Monthly changes of the Danube discharge (km3 y-1) during 1993-2005 (blue) and its annual-mean variations (green) (data provided by A. Cociasu).
Sea Surface Temperature: The winter-mean (December-March) sea surface temperature (SST) variations shown in Fig. 1A.2.10 were described by different monthly-mean data sets. The first one was complied by Hadley Centre, UK Meteorological Office from all available in situ measurements within the interior part of the basin with depths greater than 1500 m and Advanced Very High Resolution Radiation (AVHRR) satellite observations (Rayner et al., 2003). The second data set was provided by the Global Ice-Sea Surface Temperature, version 2.2 data set (GISST2.2) for the region confined by 42�������44��N latitude range and 29�������39��E longitude range during 1950�����1994 (Kazmin and Zatsepin, 2007). Other data sets include the NCEP-Reynolds 1o resolution monthly AVHRR night-time measurements for 1983�����2006 and 4 km resolution weekly Pathfinder5 AVHRR night-time measurements for 1987�����2005. Fig. 1A.2.10 also shows the minimum Cold Intermediate Layer temperature variation (characterized by temperatures less than 8oC below the seasonal thermocline) as the mean of all available data from the interior basin for May-November period of 1950-1995 (Belokopytov, 1998) and from the regular measurements along several cross-sections within the eastern Black Sea during July-September period of 1990-2004 (Krivosheya et al., 2005).
The winter GISST data reveal an approximately 1.0oC cooling trend from 9.0oC in 1970 to 8.0oC in 1985. The Hadley SST data instead remain uniform at 8.7��0.1oC during the 1960s and 1970s and then decreased abruptly from about 8.5oC at 1981 to 7.7oC at 1984. The cooling phase persists up to 1994 and switches abruptly to the warming mode until 2002 that was then replaced by a cooling mode up to the present. The NCEP-Reynolds data that form a part of the Hadley data set are similar to the Hadley one after 1993. The more recent and refined Pathfinder data set was also similar to the NCEP-Reynolds data after the beginning of the 1990s. The accompanying CIL data support reliability of the Hadley winter SST data because the minimum CIL temperature in summer months reflects signature of the winter SST.�� Approximately 0.7oC difference between the subsurface summer CIL temperature and the winter Hadley SST should probably arise from different spatial averaging of the variable data sets.
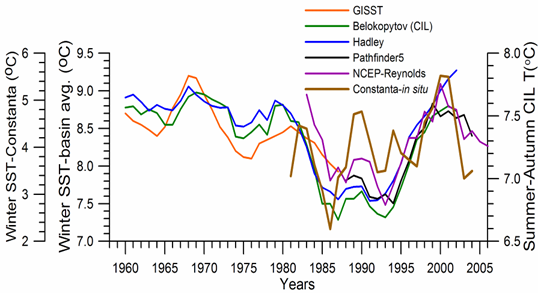
Fig. 1A.2.10. Long-term variations of the basin-averaged winter-mean (December-March) Sea Surface Temperature (SST) during 1960-2005 using the monthly data sets of Hadley Centre-UK Meteorological Office (blue), GISST (Kasmin and Zatsepin, 2007; red), NCEP-Reynolds 1o resolution AVHRR (violet), Pathfinder5 4 km resolution AVHRR (black), minimum temperature of the Cold Intermediate Layer for the mean of May - November period (green), and the winter-mean (December-March) SST measured near Constanta (Romanian coast). All these data were plotted after smoothed by the three point moving average.
Considerable regional variability up to 2oC between the colder interior basin and warmer peripheral zone irrespective of the interannual variability is a striking feature of the Black Sea (Fig. 1A.2.11). In general, regional meteorological conditions in the eastern part favour milder winters and warmer winter temperatures in the surface mixed layer. Thus the decadal warming signature was felt more pronouncedly in the eastern basin during the 1990s. The western coastal waters receiving the freshwater discharge from Danube, Dniepr and Dniestr Rivers correspond to the coldest parts of the Black Sea that are roughly twice colder than the southeastern corner of the basin irrespective of the year (Fig. 1A.2.11).��
Consistency between the summer-autumn mean CIL temperature and the winter SST variations in terms of both timing and duration of the warm and cold cycles implies propagation of the winter warming/cooling events to 50-60 m depths during rest of the year. The existence of sharp thermocline helps to preserve the CIL signature throughout the year irrespective of the surface mixed layer temperature structure. The high correlation (r=0.89 with significance level=0.99) between the summer-autumn mean CIL temperature and the winter (December-March) mean winter SST allows a rough estimate of the former from the satellite data using the empirical relationship T(CIL)=0.619*SST+2.063.
The summer SST variations differ from the winter ones to a considerable extent (Fig. 1A.2.12; blue). For example, cold winters of 1991-1992 are followed by relatively warm summers with SST ≥ 25oC in August. Contrary to a steady rise of the winter SST after 1994, summer SSTs remain relatively low (below 24.5oC) until 1998, and fluctuates between 25oC and 26oC afterwards. In-situ measurements along the northeastern coast (Shiganova, 2005) generally support these features (blue line in Fig. 1A.2.12). On the other hand, the annual-mean basin-averaged SST reveals a warming trend from ~14.8oC in 1989 to 15.6oC in 2005 with some oscillations along the trend (green line in Fig. 1A.2.12). In particular, 1992, 1993, 1997, 2003 and 2004 emerge as cold years.
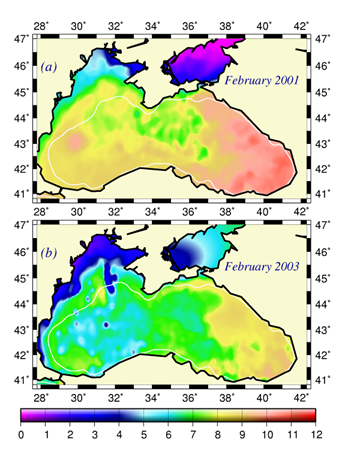
Fig. 1A.2.11. The mean SST distribution in February for 2001 and 2003 obtained from 9 km monthly-mean, gridded NOASS/NASA AVHRR Oceans Pathfinder data set (after Oguz et al., 2003). The curve (in white colour) shows 200 m bathymetry.
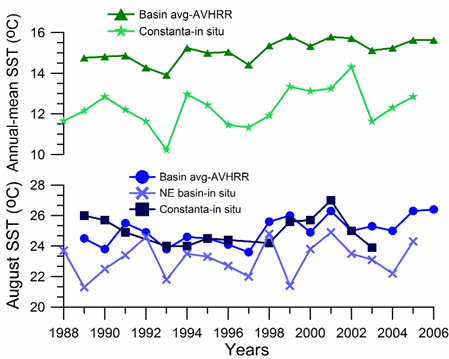
Fig. 1A.2.12. Annual-mean (triangles) and August (dots) SST variations obtained by the basin-averaging of 9 km monthly-mean, gridded NOASS/NASA AVHRR Oceans Pathfinder data, and annual-mean (stars) and August (squares) SST variations measured at Constanta (Romanian coast) and along the northeastern coastal waters (crosses; Shiganova, 2005).
Sea level: It is a prominent feature of global warming as well as large scale atmospheric systems in regional seas.�� Sea level change provide best response of the physical climate to atmospheric forcing, because the link includes an overall response of the changes in the surface atmospheric pressure through the inverse barometer effect, water density changes in response to temperature and salinity variations (steric effects), precipitation, evaporation and river runoff.�� The detrended sea level anomaly (SLA) time series (Reva 1997, Tsimplis and Josey 2001, Stanev and Peneva 2002), as an average of the measurements at 12 coastal stations around the Black Sea, oscillate within the range of 10 cm (Fig. 1A.2.13a). Its higher (lower) values coincide with the warm (cold) cycles of the water temperature indicating that a part of the observed sea level change has a thermal origin due to the thermo-steric effect. The annual-mean tide-gauge data show a high degree of consistency with the altimeter SLA data as well (Fig. 1A.2.13b). They both exhibit a rising trend of 3 cm y-1 from 1993 to the mid-1999 followed by -3.0 cm y-1 declining trend for 07/1999�����12/2003 in consistent with the cooling phase indicated by the winter SST data. When monthly variations of the SLA are resolved, the linear trend of rise increases to 20 cm during 1992-1999 (Fig.1.2.14) that was roughly 3 cm higher than the estimate based on the coastal tide gauge data (Tsimplis and Josey, 2001; Stanev and Peneva 2002). Good agreement between the monthly SLA changes and the Danube discharge rates suggest its predominant role on the basin-scale sea level oscillations.
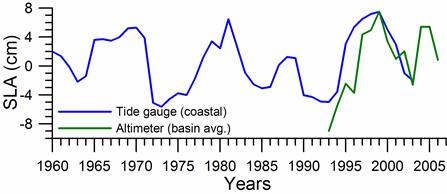
Fig. 1A.2.13a. Long-term variations of the detrended sea level anomaly (blue) after high frequency oscillations have been filtered by the three point moving average and its comparison with annual mean sea level anomaly retrieved from satellite altimeter measurements (after Oguz et al., 2006).
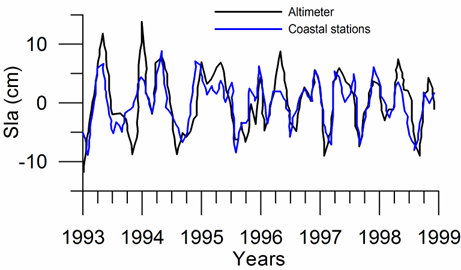
Fig. 1A.2.13b. Comparision of the detrended monthly-mean sea level anomaly obtained from the basin-averaged altimeter data (black) and the mean of 12 coastal sea level stations around the basin (blue)�� (after Goryachkin et al., ��2003).
Air Temperature and surface atmospheric pressure: The winter-mean air temperature anomaly data from various coastal stations around the periphery of the basin (Titov, 2000; 2002) exhibit similar temporal variations, even though the mean temperatures and their range of variations may differ from the western to eastern end of the basin. Fig. 1A.2.15 provides an example along the northern coast of the central Black Sea. Fig. 1A.2.15 also includes the spatially averaged 2o resolution data retrieved from the URL site ftp://data.giss.nasa.gov/pub/gistemp/txt/.
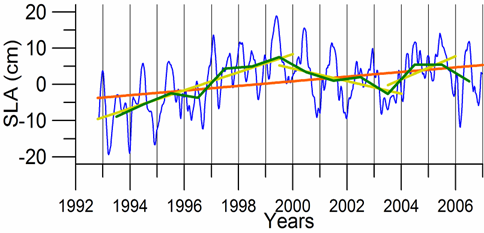
Fig. 1A.2.14. Monthly (blue) and yearly (green) SLA changes in the Black Sea during 1993-2006 together with its long-term trend (brown) and two shorter term trends (yellow) for 1993-1999, 1999-2003, and 2003-2006.
In general, the long-term AT anomaly data since 1885 exhibit a linear warming trend with the overall temperature rise of 0.9 oC (Oguz et al., 2006). It is consistent with the warming observed in winter temperature over Eurasia that was explained partly by temperature advection from the North Atlantic region (i.e. connected to the NAO) and partly by the radiative forcing due to increased greenhouse gases (Hurrell, 1996).�� The last two decades have been subject to its abrupt variations over 10 year cycles (Fig. 1A.2.15). In particular, according to the GISST data set, the winter AT anomaly decreased 2.0oC during the mid-1970s and 1985-1995. The former was less whereas the latter was more pronounced for the coastal station data. Both the timing and duration of the warm and cold cycles fit reasonably well with the winter-mean (December-March) SST and the summer-autumn (May-November) mean CIL temperature time-series (Fig. 1A.2.10). The agreement between the winter-mean AT anomaly and SST is particularly good for the GISS-based data sets.
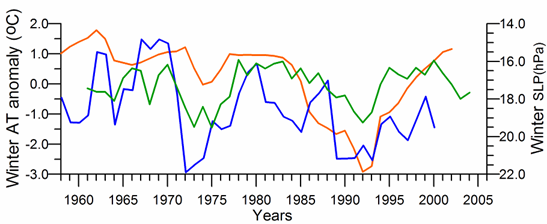
Fig. 1A.2.15. Winter (December-March) mean air temperature anomaly variations measured at the meteorological station near the Kerch Strait (red) and obtained by averaging of the GISST data for the basin (green), and winter (December-March) mean surface atmospheric pressure (hPa) obtained by averaging ERA40 data over the basin (blue).�� High frequency oscillations in the data have been filtered by the three point moving average.
The winter (December-March mean) basin-averaged sea level pressure (SLP) distribution over the Black Sea (Fig. 1A.2.15) follows closely the winter air temperature time series.�� The severe winters with low air temperatures tend to be associated with higher sea level atmospheric pressures (up to 1021 hPa), whereas lower pressures correspond to milder winter seasons. Decreasing winter air temperature trend during the 1985-1993 is supported by an increasing trend of the winter surface pressure and vice versa for the 1990s.��
Link to teleconnection patterns over the Eurasia: The North Atlantic Oscillation (NAO) defined as an index representing the normalized sea level atmospheric pressure difference between Lisbon, Portugal (for the Azores high pressure system) and Stykkisholmur/Reykjavik, Iceland (for the Icelandic low pressure system) is an important mode of variability of the Northern Hemisphere atmosphere (Marshall et al., 1997). Its positive values for winter (December through March) indicate strong pressure gradient between these two pressure systems that brings cold and dry air masses to southern Europe and Black Sea region by strong westerly winds (Hurrell, et al., 2003). In these periods, the Black Sea region is affected by the Azores high pressure center and thus characterized by the higher surface air pressure values, reduced evaporation and colder air and sea surface temperatures (Fig. 1A.2.16). Conversely, the negative NAO index that implies lower surface atmospheric pressure differences gives rise to milder winters with warmer air temperatures and less dry/more wet atmospheric conditions transported over the Black Sea from the southwest. Various studies in the Mediterranean, Black and Caspian Seas (e.g., Reva, 1997; Ozsoy, 1999; Tsimplis and Josey, 2001; Stanev and Peneva, 2002; Oguz, 2005b; Oguz et al., 2006; Kazmin and Zatsepin, 2007) established a regional dynamical link to the NAO.�� The NAO signature has also been recorded in stream flow changes of the Tigris and the Euphrates Rivers (Cullen and deMenocal, 2000), as well as in the River Danube discharge (Polonsky et al., 1997; Rimbu et al., 2004).
The general consistency between periods of positive (negative) NAO index values and relatively low (high) sea surface and air temperatures, higher (lower) surface air pressures supports the presence of a teleconnection between the regional atmospheric conditions and the NAO-driven large scale atmospheric motion (Oguz et al., 2006, Kazmin and Zatsepin, 2007). In terms of duration and intensity of events, the sequence of mild and severe winter cycles follows the temporal pattern of the negative and positive NAO cycles, respectively. In particular, the strong cooling trend during 1980-1993 characterizes an extended strongly positive NAO index phase with an increasing trend. The subsequent warming trend in SST coincides with the weakening of positive NAO index and its decreasing trend.
Krichack et al. (2002) have shown that interannual variability of precipitation over the eastern Mediterranean can be explained more appropriately by the joint analysis of the NAO and EAWR indices which incorporates different possible combinations of a quadrapole system formed by the high and low surface pressure anomaly centers over the North Atlantic and the Eurasia as representative of different states of the eastern Mediterranean atmosphere. Oguz et al. (2006) later adopted this concept for the Black Sea in order to explain some peculiarities of the climatic variations which can not be described well by the NAO alone.
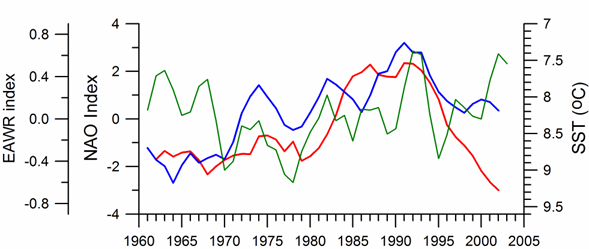
Fig. 1A.2.16. Long-term variations of the winter North Atlantic Oscillation index (blue), East Atlantic-West Russia (EAWR) index (green) and Iceland sea surface temperature (red). High frequency oscillations in the data have been filtered by the five point moving average.
The winter (December-January-February) mean East Atlantic-West Russia (EAWR) index represents the zonal shift between quasi-persistent high and low surface pressure anomaly centers over the Western Europe and the Caspian region (Fig. 1A.2.16). This system characterizes the second strongest mode of the North Atlantic climate (Molinero et al., 2005) and zonally modulates the NAO over the Eurasia continent. Its positive phase (EAWR index > 0) results from the joint effect of the increased anticyclonic anomaly center over the North Sea and the increased cyclonic anomaly center over the Caspian Sea. The Black Sea region is then exposed to cold and dry air masses from the northeast-to-northwest sector. Alternatively, its negative phase (EAWR index < 0) is associated with the cyclonic anomaly center over the North Sea and the anticyclonic activity over the Caspian Sea (i.e. relatively low pressure difference over the Europe). In this case, the Black Sea region is affected by warmer and wetter winter conditions under the influence of increased southwesterlies-to-southeasterlies. They resemble closely the North Sea-Caspian Pattern (NCP) index introduced using 500 hPa geopotential anomaly patterns by Kutiel and Benaroch (2002).
When both NAO>0 and EAWR>0, the system was governed by the low pressure anomaly centers over Iceland and Caspian Sea and a high pressure anomaly centers over Azores and the North Sea. This case leads to strongest cold winters in the Black Sea due to cold air mass outbreaks from the northwest and/or the northeast as in the case of early 1990s.�� When NAO>0 and EAWR<0, the Caspian low is replaced by an anticyclonic anomaly center, and the Black Sea region is then controlled by either cold air outbreaks from the northwest or warm air outbreaks from the southeast depending on the relative strengths and spatial coverages of the Icelandic low and Caspian high pressure systems. This case applies to the period of 1970-1975 and may be the reason for a weak cooling signature noted in the SST even if the NAO was in strong positive mode. The reverse case of NAO<0 and EAWR>0 gives rise to the cold winters with cold air outbreaks from the northern sector. Alternatively, the warm and mild winters may also prevail when the Azores high pressure system is sufficiently strong and protrudes towards the east.�� As suggested by the Black Sea hydro-meteorological time series data, the latter case occurred during the 1960s and 1990s. When both NAO<0 and EAWR<0, the system is affected by the warm air mass intrusions from the southwest-southeast sector giving rise to mild winters in the Black Sea. Its typical example was observed during the second half of the 1970s.
The decadal variations observed in the Black Sea hydro-meteorological properties are consistent to some extent solar (sun spot) variations having the 10-12 year periodicity.�� The periods of solar minima coincide with reduced air and sea surface temperatures, which generally correspond to the periods of positive NAO index values. In contrast, the periods of solar maxima coincide with the periods of higher air and sea surface temperatures characterized by negative values in the NAO index. A positive correlation exists between the SST and the sunspot number for each five year bins of the consecutive cold and warm cycles of the 1960-2000 phase. The in-phase variations between the sun spot number and the regional hydro-meteorological characteristics may suggest possible impact of the solar activity its link to the lower atmosphere and subsequently air and sea surface temperatures of the Black Sea.��
References
Afanasyev, Y.D., Kostianoy, A.G., Zatsepin, A.G., and Poulain P.M. (2002) Analysis of velocity field in the eastern Black Sea from satellite data during the Black Sea �����99 experiment. J. Geophys. Res., 107, 10.1029/2000JC000578.
Beckers, J.M., Gregoire, M.L., Nihoul, J.C.J., Stanev, E., Staneva, J. and Lancelot C. (2002) Hydrodynamical processes governing exchanges between the Danube, the north-western continental shelf and the Black Sea's basin simulated by 3D and box models. Estuarine, Coastal and Shelf Science, 54, 453-472.
Belokopytov, V. (1998) Long-term variability of Cold Intermediate Layer reneval conditions in the Black Sea. In Ecosystem modeling as a management tool for the Black Sea, NATO Sci. Partnership Sub-ser., 2, vol. 47, edited by Ivanov, L�� and Oguz, T., Vol 2, 47-52 pp, Kluwer Academic Publishers.
Besiktepe, S.T., Lozano, C.J., and Robinson A.R. (2001) On the summer mesoscale variability of the Black Sea. J. Mar. Res., 59, 475-515.
Buesseler, K.O., Livingston, H.D., Ivanov, L. and Romanov, A. (1994) Stability of the oxic-anoxic interface in the Black Sea. Deep-Sea Res. I, 41, 283-296.
Cullen, H.M., and de Menocal, P.B. (2000) North Atlantic Influence on Tigris-Euprates streamflow. Int. J. Climatol., 20, 853-863.
Faschuk, D.Ya., Ayzatullin, T.A., Dronov, V.V, Pankratova, T.M. and Finkelshteyn, M.S. (1990) Hydrochemical structure of the layer of co-existence of oxygen and hydrogen sulfide in the Black Sea and a possible mechanism of its generation. Oceanology (English transl.), 30, 185-192.
Gawarkiewicz, G., Korotaev, G. Stanichny, S., Repetin, L. and Soloviev, D. (1999) Synoptic upwelling and cross-shelf transport processes along the Crimean coast of the Black Sea. Cont. Shelf Res., 19, 977-1005.
Ginsburg, A.I., Kostianoy, A.G., Soloviev, D.M., Stanichny, S.V. (2000) Remotely sensed coastal/deep-basin water exchange processes in the Black Sea surface layer. In Satellites, Oceanography and Society, D. Halperneds. Elsevier Oceanography Series, Amsterdam, 63, pp. 273-285.
Ginsburg, A.I., Kostianoy, A.G., Nezlin, N.P., Soloviev, D.M., Stanichny, S.V. (2002a) Anticyclonic eddies in the northwestern Black Sea. J. Mar. Syst., 32, 91-106.
Ginsburg, A.I., Kostianoy, A.G., Krivosheya, V.G., Nezlin. N.P., Soloviev, D.M, Stanichny, S.V., Yakubenko, V.G. (2002b) Mesoscale eddies and related processes in the northeastern Black Sea. J. Mar. Syst., 32, 71-90.
Glazer, B.T., Luther III, G.W. Konovalov, S. K., Friederich, G. E., Trouwborst, R.E., Romanov, A.S. (2006) Spatial and temporal variability of the Black Sea suboxic zone. Deep Sea Res. II, 53, 1756-1768.
Gregg, M. C. and Yakushev, E. V. (2005) Surface Ventilation of the Black Sea�����s Cold Intermediate Layer in the Middle of the Western Gyre. Geophys. Res. Lett. 32, L03604.
Goryachkin, Yu. N., Ivanov, V. A., Lemeshko, E. M., and Lipchenko, M. M. (2003) Application of the altimetry data to the analysis of water balance of the Black Sea. Physical Oceanography, 13, 355-360.
Hiscock, W.T. and Millero, F. J. (2006) Alkalinity of the anoxic waters in the Western Black Sea. Deep Sea Res. II, 53, 1787-1801.
Hurrell, J.W. (1996) Influence of variations in extratropical wintertime teleconnections on Northern Hemisphere temperature. Geophys. Res. Lett., 23, 665-668.
Hurrell, J.W., Kushnir, Y., Ottersen, G., and Visbeck, M. (2003) An overview of the North Atlantic Oscillation. In The North Atlantic Oscillation: Climatic Significance and Environmental Impact, Geophysical Monograph 134, Edited by J.W. Hurrell, Y. Kushnir, G. Ottersen, M. Visbeck, 1-36pp, published by American Geophysical Union, Washington DC.
Ilyin, Y.P. and Repetin, L.N. (2005) Long-term climatic trends in the Black Sea region and their seasonal features. Proceedings of The First Biannual Scientific Conference: Black Sea Ecosystem 2005 and Beyond, organized by Commission on the Protection of the Black Sea Against Pollution, May 2006, Istanbul.
Ivanov, L.I. and Samodurov, A.S. (2001) The role of lateral fluxes in ventilation of the Black Sea. J. Mar. Syst., 31, 159-174.
Jannasch, H.W., Wirsen, C.O. and Molyneaux, S.J. (1991) Chemoautotrophic sulfur-oxiding bacteria from the Black Sea. Deep-Sea Res., 38, Suppl.2A, S1105-S1120.
Jorgensen, B.B., Fossing, H., Wirsen, C.O. and Jannasch, H.W. (1991) Sulfide oxidation in the anoxic Black Sea chemocline. Deep-Sea Res., 38, Suppl.2A, S1083-S1104.
Karl, D.M., and Knauer, G.A. (1991) Microbial production and particle flux in the upper 350 m of the Black Sea. Deep Sea Res., 38, Supp. 2A, S655-S661.
Kazmin, A.S. and Zatsepin, A.G. (2007) Long-term variability of surface temperature in the Black Sea, and its connection with the large-scale atmospheric forcing. J. Mar. Syst., 68, 293�����301.
Konovalov, S.K., and Murray, J.W. (2001) Variations in the chemistry of the Black Sea on a time scale of decades (1960-1995). J. Mar. Syst., 31, 217-243.
Korotaev, G.K., Saenko, O.A., Koblinsky, C.J. (2001) Satellite altimetry observations of the Black Sea level. J. Geophys. Res., 106, 917-933.
Korotaev, G.K., Oguz, T., Nikiforov, A., Koblinsky, C. J. (2003) Seasonal, interannual and mesoscale variability of the Black Sea upper layer circulation derived from altimeter data. J. Geophys. Res., in press.
Korotaev, G., Oguz, T., Riser, S. (2006) Intermediate and deep currents of the Black Sea obtained from autonomous profiling floats. Deep Sea Res. II, 53, 1901-1910.
Krivosheya, V.G., Titov, V. B., Ovchinnikov, I.M., Kosyan, R.D., Skirta A.Yu. (2000) The influence of circulation and eddies on the depth of the upper boundary of the hydrogen sulfide zone and ventilation of aerobic waters in the Black Sea. Oceanology (Eng. Transl.), 40, 767-776.
Kuypers, M.M.M., Sliekers, A.O., Lavik, G., Schmid, M., Jorgensen, B.B., Kuenen J.G., Sinninghe, D.J.S., Strous, M. and Jetten, M.S.M. (2003) Anaerobic ammonium oxidation by anammox bacteria in the Black Sea. Nature, 422, 608-611.
Lebedeva, L.P. and Vostokov, S. V. (1984) Studies of detritus formation processes in the Black Sea. Oceanology (Engl. Transl.), 24(2), 258-263.
Lee, B-S., Bullister, J.L., Murray, J.W. and Sonnrup, R.E. (2002) Anthropogenic chlorofluorocarbons in the Black Sea and the Sea of Marmara. Deep-Sea Res. I, 49, 895-913.
Marshall, J., Kushnir, Y., Battisti, D., Chang, P., Hurrell, J., McCartney M., and Visbeck, M. (1997) A North Atlantic Climate Variability: phenomena, impacts and mechanisms.Inter. Jour. Climatology, 21(15), 1863-1898.
Molinero, J. C., Ibanez, F., Nival, P., Buecher, E. and Sousssi, S. (2005) North Atlantic climate and northwestern Mediterranean plankton variability.�� Limnol. Oceanogr., 50(4), 1213-1220.
Murray, J.W., Jannash, H. W., Honjo, S., Anderson, R. F., Reeburgh W.S., Top, Z., Friederich, G.E., Codispoti, L.A. and Izdar, E. (1989) Unexpected changes in the oxic/anoxic interface in the Black Sea. Nature, 338, 411-413.
Murray, J. W., Top, Z. and Ozsoy, E. (1991) Hydrographic properties and ventilation of the Black Sea. Deep-Sea Res., 38, Suppl.2A, S663-690.
Oguz, T. (2005) Black Sea ecosystem response to climate teleconnections. Oceanography, 18(2), 118-128.
Oguz, T. and Ediger, D. (2006) Comparision of in situ and satellite-derived chlorophyll pigment concentrations, and impact of phytoplankton bloom on the suboxic layer structure in the western Black Sea during May�����June 2001. Deep Sea Res. II, 53, 1923-1933.
Oguz, T., La Violette, P., Unluata, U. (1992) Upper layer circulation of the southern Black Sea: Its variability as inferred from hydrographic and satellite observations. J. Geophys. Res., 97, 12569-12584.
Oguz, T., Aubrey, D.G., Latun, V.S., Demirov, E., Koveshnikov, L., Sur, H.I., Diacanu, V., Besiktepe, S., Duman, M., Limeburner, R., and Eremeev, V.V. (1994) Mesoscale circulation and thermohaline structure of the Black sea observed during HydroBlack'91. Deep Sea Research I, 41, 603-628.
Oguz, T., Malanotte-Rizzoli, P., and Aubrey, D. (1995) Wind and thermohaline circulation of the Black Sea driven by yearly mean climatological forcing. J. Geophys. Res., 100, 6846-6865.
Oguz. T, Ivanov, L.I., and Besiktepe, S. (1998) Circulation and hydrographic characteristics of the Black Sea during July 1992. In: Ecosystem Modeling as a Management Tool for the Black Sea, L. Ivanov and T. Oguz (eds). NATO ASI Series, Environmental Security-Vol.47, Kluwer Academic Publishers, Vol. 2, pp.69-92.
Oguz, T., Deshpande, A. G. and Malanotte-Rizzoli, P. (2002a) On the role of mesoscale processes controlling biological variability in the Black Sea: Inferrences from SeaWIFS-derived surface chlorophyll field. Continental Shelf Research, 22, 1477-1492.
Oguz, T., Cokacar, T., Malanotte-Rizzoli, P. and Ducklow, H. W. (2003) Climatic warming and accopanying changes in the ecological regime of the Black Sea during 1990s. Global Biogeochem. Cycles, 17(3), 1088,doi:10.1029/2003.
Oguz T., Dippner, J.W. and Kaymaz, Z. (2006) Climatic regulation of the Black Sea hydro-meteorological and ecological properties at interannual-to-decadal time scales. J. Mar. Syst., 60, 235-254.
Ozsoy, E. and Unluata, U. (1997) Oceanography of the Black Sea: A review of some recent results. Earth Sci. Rev., 42, 231-272.
Ozsoy, E. (1999) Sensitivity to global change in temperate Euro-Asian Seas (The Mediterranean, Black Sea and Caspian Sea): A review. In The Eastern Mediterranean as a laboratory basin for the assessment of contrasting ecosystems, NATO Sci. Partnership Sub-ser., 2, vol. 51, edited by Malanotte-Rizzoli, P., and Eremeev V., 281-300 pp, Kluwer Academic Publishers.
Polat, S.���. and Tugrul, S. (1995) Nutrient and organic carbon exchanges between the Black and Marmara Seas through the Bosphorus Strait. Continental Shelf Research, 15, 1115-1132.
Polonsky, A. B, Basharin, D.V. Voskresenskaya, E.N. and Worley, S. (2004) North Atlantic Oscillation: description, mechanisms, and influence on the Eurasian climate. Phys. Oceanogr., 15(2), 96-113.
Pierre-Marie P., Barbanti, R. Motyzhev, S. and Zatsepin A. (2005) Statistical description of the Black Sea near-surface circulation using drifters in 1999�����2003. Deep-Sea Res. I, 52, 2250�����2274.
Repeta, D.J. and Simpson, D.J. (1991) The distribution and recycling of chlorophyll, bacteriochlorophyll and carotenoids in the Black Sea. Deep-Sea Res., 38, Suppl.2A, S969-S984.
Repeta, D.J., Simpson, D.J. Jorgensen, B.B. and Jannash, H.W. (1989) Evidence for anoxic photosynthesis from distribution of bacteriochlorophylls in the Black Sea. Nature, 342, 69-72.
Reva, Yu.A. (1997)�� Interannual oscillations of the Black Sea level. Oceanology (Eng. Transl.), 37, 193-200.
Rimbu, N., Dima, M. Lohmann, G. and Stefan, S. (2004) Impacts of the North Atlantic oscillation and the El Nino-southern oscillation on Danube river frlo variability. Geophs. Res. Lett., 31, L23203, doi:10.1029/2004GL020559.
Rozanov, A.G., Neretin, L.N. and Volkov, I.I. (1998) Redox Nepheloid Layer (RNL) of the Black Sea: Its location, composition and origin. In: Ecosystem Modeling as a Management Tool for the Black Sea. L. Ivanov and T. Oguz, eds. NATO ASI Series, 2-Environmental Security-47, Kluwer Academic Publishers, Vol. 1, pp.77-92.
Shiganova, T. (2005) Gelatinous plankton surveys in the Ponto-Caspian Seas. Proceedings of The First Biannual Scientific Conference: Black Sea Ecosystem 2005 and Beyond, organized by Commission on the Protection of the Black Sea Against Pollution, May 2006, Istanbul.
Sokolova, E., Stanev, E.V., Yakubenko, V., Ovchinnikov, I. and Kosyan, R. (2001) Synoptic variability in the Black Sea. Analysis of hydrographic survey and altimeter data. J. Mar. Syst., 31, 45-63.
Sorokin, Y.I. (1972) The bacterial population and the process of hydrogen sulfide oxidation in the Black Sea. J. Conseil Int. pour l'Explorotion de la Mer, 34, 423-454.
Stanev, E.V. (1990) On the mechanisms of the Black sea circulation. Earth-Sci. Rev., 28, 285�����319.
Stanev, E. V. and Beckers, J.M. (1999) Numerical simulations of seasonal and interannual variability of the Black Sea thermohaline circulation. J. Mar. Syst., 22, 241-267.
Stanev, E.V. and Peneva, E. (2002) Regional sea level response to global climatic change: Black Sea examples. Global and Planetary Changes, 32, 33.47.
Staneva, J.V., Dietrich, D.E., Stanev, E.V. and Bowman, M.J. (2001) Rim Current and coastal eddy mechanisms in an eddy-resolving Black Sea general curculation model. J. Mar. Systs., 31, 137-157.
Sur, H.I. and Ilyin, Y.P. (1997) Evolution of satellite derived mesoscale thermal patterns in the Black Sea. Prog. Oceanogr., 39, 109-151.
Sur, H.I., Ozsoy, E. and Unluata, U. (1994) Boundary current instabilities, upwelling, shelf mixing and eutrophication processes in the Black Sea. Progr. Oceanogr., 33, 249-302.
Sur, H.I., Ozsoy, E. Ilyin, Y.P., Unluata, U. (1996) Coastal/deep ocean interactions in the Black Sea and their ecological/environmental impacts. J. Marine Systems, 7, 293-320, 1996.
Titov, V.B. (2000) Dependence of the formation of the winter hydrological structure in the Black Sea on the severity of winter conditions. Oceanology (Engl. Transl.), 40, 777-783.
Titov, V.B. (2002) Seasonal and interannual variability of climatic conditions over the Black Sea, in the Black Sea, in Multidisciplinary investigations of the northeast part of the Black Sea, edited by A.G. Zatsepin and M.V. Flint, pp.9-19, Moscow, Nauka.
Trouwborst, R. E., Clement, B. G., Tebo, B. M., Glazer, B. T., Luther III, G. W. (2006) Soluble Mn(III) in suboxic zones. Science, 313, 1955-1957.
Tsimplis, M.N. and Josey, S.A. (2001) Forcing of the Mediterranean Sea by atmospheric oscillations over the North Atlantic. Geophys. Res. Lett., 28, 803-806.
Tugrul, S., Basturk, O. Saydam, C. and Yilmaz, A. (1992) The use of water density values as a label of chemical depth in the Black Sea. Nature, 359, 137-139.
Zatsepin, A.G., Ginzburg, A.I., Kostianoy, A.G., Kremenitskiy, V.V., Krivosheya, V.G., Stanichny, S.V., and Poulain, P-M. (2003) Observations of Black Sea mesoscale eddies and associated horizontal mixing. J. Geophys. Res., 108, 3246, doi:10.19/2002JC001390.
Zatsepin A. G. , Golenko, N. N., Korzh, A. O., Kremenetskii, V. V., Paka, V. T., Poyarkov, S. G., and Stunzhas, P. A. (2007) Influence of the dynamics of currents on the hydrophysical structure of the waters and the vertical exchange in the active layer of the Black Sea. Oceanology, 47(3), 301�����312.
CHAPTER 1B GENERAL OCEANOGRAPHIC PROPERTIES:�� GEOGRAPHY, GEOLOGY AND GEOCHEMISTRY (N. Panin)
National Institute of Marine Geology and Geo-ecology ����� GeoEcoMar, Romania
1B.1 Geographic position and physiography
The Black Sea is one of the largest almost enclosed seas in the world: its area is about 420 thousands km2, the maximum water depth 2.212 m, the total water volume of about 534,000 km3. The Black Sea is placed in the southeastern part of the Europe between 40�� 54����� 40���� and 46�� 34����� 30���� northern latitudes, 27�� 27����� and 41�� 46����� 30���� eastern longitudes. The sea is roughly oval-shaped. The maximum extent of the sea in the east-west direction is about 1175 km, while the shortest distance is of some 260 km between the southernmost tip of the Crimea and the Cape Kerempe on the Turkish coast (Fig. 1B.1). The Black Sea is connected to the Mediterranean Sea to the west and to the Sea of Azov to the north. The connection with the Mediterranean Sea is limited to the Istanbul-Canakkale (Bosporus-Dardanelles) straits. The Istanbul Strait is a rather narrow (0.76 ����� 3.6 km large) and shallow strait (presently 32 ����� 34 m at the sill) restricting the two-way water exchange between the Black and Mediterranean Seas. The other connection, with the Sea of Azov is realized by the Strait of Kerch.
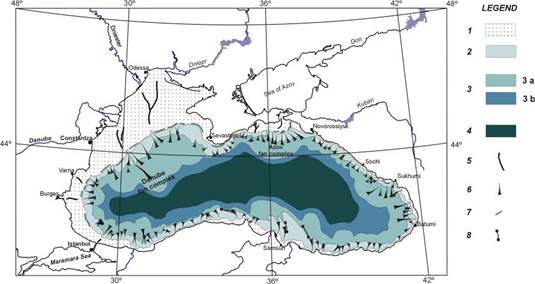
Fig. 1B.1. Geomorphologic zoning of the Black Sea (after Ross et al.,1974, Panin and Ion, 1997).
Legend; 1, continental shelf; 2, continental slope; 3, basin apron: 3 a - deep sea fan complexes; 3 b - lower apron; 4, deep sea (abyssal) plain; 5, paleo-channels on the continental shelf filled up with Holocene and recent fine grained sediments; 6, main submarine valleys - canyons; 7, paleo-cliffs near the shelf break; 8, fracture zones expressed in the bottom morphology.
The Black Sea is surrounded by high folded mountain chains represented by the Balkanides-Pontides belts to the south-west and south, by the Great and Little Caucasus to the east and by the Crimea Mountains to the north. There are low-standing plateaux and the Danube delta lowland only in the west and north-west. On the opposite eastern side there is the Kolkhida lowland of smaller extent. Consequently the relief energy is much higher on the eastern and southern costs than on the northwestern shore.
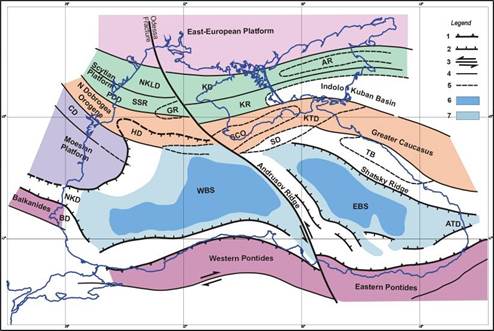
Fig. 1B.2. Tectonic sketch of the Black Sea Region (after Dinu et al., 2003; Panin et al., 1994).
Legend: 1, Orogene overthrust front; 2, Gravitational faults of the rift; 3, Major strike-slip faults; 4, Major faults; 5, Limits of depressions and/or ridges; 6, Zone without granitic crust; 7, Thinned crust. Explanation of abbreviations:�� I. Platform regions: East European, Scytian, Moesian: II. Orogenic regions: North Dobrogea Orogene, Greater Caucasus, South Crimea Orogene ����� SCO, Balkanides, Western and Eastern Pontides; III. Depressions and ridges: PDD ����� Pre-Dobrogean Depression; NKLD ����� North Kilia Depression; KD ����� Karkinit Depression; HD ����� Histria Depression; SD ����� Sorokin Depression; KTD ����� Kerci-Taman Depression; NKD ����� Nijne-Kamchiisk Depression; BD ����� Burgas Depression; ATD ����� Adjaro-Trialet Depression; TB ����� Tuapse Basin; SSR ����� Suvorov-Snake Island Ridge; KR ����� Krymskyi Ridge; AR ����� Azov Ridge; GR ����� Bubkin Ridge; IV. WBS ����� Western Black Sea; V. EBS ����� Eastern Black Sea;
The Black Sea basin can be divided into four physiographic provinces: the shelf representing about 29.9% of the total area of the sea, the basin slope - about 27.3% of the total area, the basin apron, with 30.6%, and the abyssal plain - 12.2% (Fig. 1B.1). One of the most prominent physiographic features is the very large shallow (less than 200 m deep) continental shelf within the northwestern Black Sea (about 25 % of the total area of the sea). The Crimean, Caucasian and southern coastal zones are bordered by very narrow shelves and often intersected by the submarine canyons.
1B.2. Geology of the Black Sea
Geologists consider the Black Sea a back-arc marginal extensional basin, which originated from the northward subduction of the Neo-Tethys along the southern margin of the Eurasian plate under a Cretaceous-Early Tertiary volcanic arc (Letouzey et al., 1977; Dercourt et al., 1986; Zonenshain and Le Pichon, 1986) as a result of the northward movement of the Arabic plate (Fig. 1B.2).
Since about 120 million years ago, the area has been a marine basin, with extremely dynamic development and large sediment accumulation of about 13 km of bottom sediment thickness in the central part of the basin. There are two extensional sub-basins with different geological history (Fig. 1B.2): (1) the Western Black Sea Basin, which was opened by the rifting of the Moesian Platform some 110 Ma ago (Late Barremian) followed by major subsidence and probable oceanic crust formation about 90 Ma ago (Cenomanian) (Astyushkov, 1992; Finetti et al., 1988; G��r��r, 1988) and (2) the Eastern Black Sea Basin, with rifting beginning probably in the Late Palaeocene (about 55 Ma ago), and extension and probable oceanic crust generation in the Middle Eocene (ca.45 Ma ago) (Robinson et al., 1995).
1B.3. Water and sediment supply from rivers
The Black Sea has an extremely large drainage basin of more than 2 million km2, collecting the water from almost all the European countries, except the westernmost ones. The northwestern Black Sea receives the discharge of the largest rivers in the Black Sea drainage area ����� the Danube River with a mean water discharge of about 200 km3/yr and the Ukrainian rivers Dniepr, Southern Bug and Dniestr contributing with about 65 km3/yr (Table 1B.1). Presently the influence of the Danube River is predominant for the sedimentation on the northwestern Black Sea shelf area.
The Danube influence extends far southward up to the Bosporus region, as well as down to the deep sea floor. Presently the other three tributaries of the north-western Black Sea (Dniestr, Dniepr and Southern Bug) are not significant suppliers of sediments because they are discharging their sedimentary load into lagoons separated from the sea by beach barriers.
Table 1B.1. Fluvial water and sediment discharge into the Black Sea. *Data from Balkas et al. (1990); ** multiannual mean discharge before damming the River Danube after Bondar (1991); Panin (1996).
| Rivers | Length(Km) | Drainage basinArea�� (Km2) | Water discharge(Km3/yr) | Sediment discharge (Mt/yr) |
| I. North-Western Black Sea | ||||
| Danube | 2,860 | 817,000 | 190.7 | 51.70** |
| Dniestr | 1,360 | 72,100 | 9.8 | 2.50* |
| Dniepr | 2,285 | 503,000 | 52.6 | 2.12* |
| Southern Bug | 806 | 63,700 | 2.6 | 0.53* |
| Sub-total I: | 1,455,800 | 255.7 | 56.85 | |
| II. Sea of Azov | ||||
| Don | 1,870 | 442,500 | 29.5 | 6.40* |
| Kuban | 870 | 57,900 | 13.4 | 8.40* |
| Sub-total II: | 500,400 | 42.9 | 14.80 | |
| III. Caucasian coast rivers | 41.0* | 29.00* | ||
| IV. Anatolian coast rivers | 29.7 | 51.00* | ||
| V. Bulgarian coast rivers | 3.0* | 0.50* | ||
| T O T A L : | 372.3 | 152.15 | ||
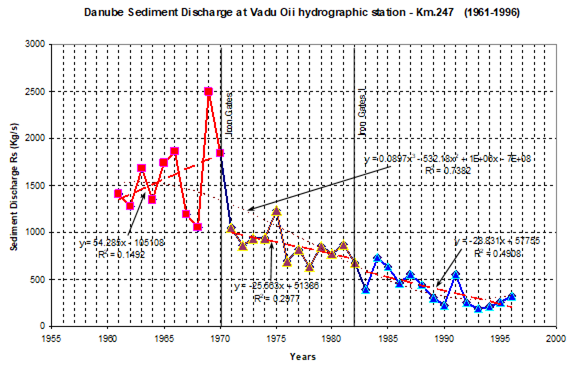
Fig. 1B.3. The decreasing trend of the Danube River sediment discharge after damming (Iron Gates I barrage in 1970, Iron Gates II barrage in 1983).
After the damming of the Danube River at Iron Gates I and II, the river sediment discharge diminished by almost 40-45 % (Fig. 1B.3), and the real sediment load brought by the Danube into the Black Sea is not larger than 30-40 million t/yr, of which only 10-12 % is sandy material and contributes to the littoral sedimentary budget of the delta front zone.
1B.4. Sedimentary systems of the Black Sea
The sedimentary systems in the Black Sea have been strongly influenced by the sea level changes driven by the processes of global glaciation and deglaciation. The surrounding relief and the physiography of the basin play also a very important role in defining the sedimentary systems. The eastern and southern parts of the sea are characterized by high relief energy and narrow continental shelf; this facilitates the direct transfer of sediments from the continent to the deep sea and determines a coarser grain size of these sediments. The western and north-western parts of the Black Sea have wide shelf and lower relief. Instead here the largest rivers are supplying important quantities of sediments, much finer (mainly silty-clay sediments).
North-western continental shelf: On the north-western Black Sea shelf area, the dispersal pattern of the Danube sediment supply indicates the existence of two main areas with different depositional processes (Panin et al., 1998): the Danube sediment-fed internal shelf and the sediment starving, external shelf (Fig. 1B.4).
Generally speaking, on the continental shelf the following sedimentary facies can be recognised (Shcherbakov and Babak, 1979):
Modiolus Mud: The Modiolus Mud is located at the top of the sedimentary sequence between 50 to 125 m of water depth. It is a light coloured mud, very rich in Modiolus phaseolinus coquinas whose thickness does not normally exceed 30 cm.
Mytilus Mud: The Mytilus (Mytilus galloprovincialis) mud is present from the shelf break till the depth of 50 to 40 m; further it is covered by the Modiolus Mud
Dreissena Mud: Around 130 m of water depth the surficial sediment is made of shells of Dreissena. Landward, this unit is covered by the Mytilus Mud and by the Modiolus Mud. The Dreissena Mud is outcropping only at the top of the continental slope.
The vertical transition in between Dreissena Mud to Mytilus Mud corresponds to the change from fresh/brackish to marine conditions in the Black Sea.
Internal, Danube sediment - fed shelf: The sediment-fed area in the neighbourhood of the Danube Delta includes the delta front unit (about 1,300 km2) and towards off-shore, at the base of the delta front to 50-60 m depth, the prodelta covering an area of more than 6,000 km2. Its southern boundary is more difficult to define on account of the strong southward drift of fine grained sediment load discharged into the sea by the Danube, which is stumping the prodelta limit.
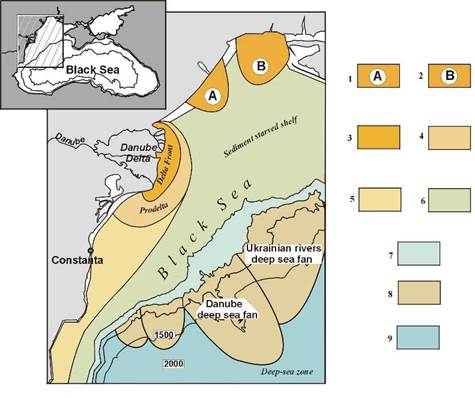
Fig. 1B.4. Main sedimentary environments in the northwestern Black Sea (after Panin et al., 1998).
Legend: 1-2, Areas under the influence of the Ukrainian rivers�� sediment discharge (A ����� Dniester and B ����� Dnieper); 3, Danube Delta Front area; 4, Danube Prodelta area; 5-6, Western Black Sea continental shelf areas (5, under the influence of the Danube-borne sediment drift; 6, sediment starved area); 7, Shelf break and uppermost continental slope zone; 8, Deep-sea fans area; 9, Deep-sea floor area.
Out of the area defined as the prodelta unit, the internal, western zone of the Romanian shelf stands out as the shallow marine area (less than 50 -60 m water depth), which receives clay and siltic sediments, supplied by the Danube River. Moving as a suspended load, the sediment flux goes beyond the area in front of the Danube Delta but does not reach the eastern, external shelf zone. Under the influence of the dominant currents, the "clayey-silty" sediment flux moves southward toward the Bulgarian shelf, keeping within the western shelf area, close to the shoreline and finally discharging the sediment load in the deep-sea zone within the pre-Bosporus region.
External, sediment starving shelf: Situated outside the area covered by the Danube fed sediment flux the external, eastern part of the continental shelf represents an area practically deprived of clastic material (Fig. 1B.5). Within this sediment starving shelf area, the condensed sediment accumulation is of biogenic origin, producing an organic thin cover on relict sediments or concentrations of shells. The Danubian sediments seldom reach the shelf area north or northwest of the Danube mouths. Dniester and Dniepr, the main rivers north of Danube Delta, are themselves, as already mentioned, not significant suppliers of sediment for the north-western Black Sea shelf. Consequently, the sediment starving status characterizes almost all of the whole Black Sea continental shelf west of the Crimean Peninsula.
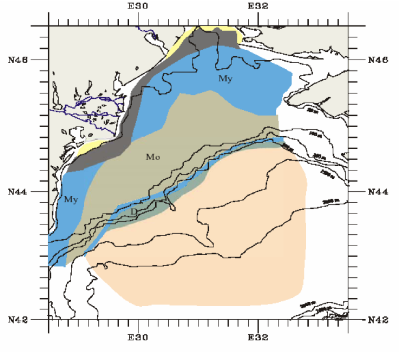
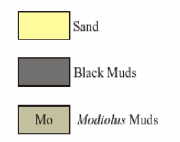
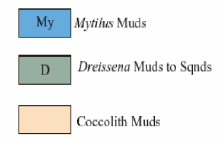
Fig. 1B.5. Repartition of litho-stratigraphic units on the sea floor in the NW Black Sea (from S. Radan, unpublished data).
Deep sea zone of the western Black Sea: During the Upper Quaternary, in correlation with the sea-level fluctuations of this period, very large accumulations of sediments were formed in the deep-sea zone of the north-western Black Sea, mainly on the continental slope and apron areas. This accumulation is represented by two distinct but interfingering fans: the Danube fan fed by the River Danube during fan accretion and the Dniepr fan built up by the Ukrainian rivers Dniepr, Dniestr and Bug. Eight seismic sequences have been identified within each of these fans (Wong et al., 1994, 1997). While the lowermost two consist mainly of mass transport-related deposits, the six upper sequences comprise typical fan facies associations, corresponding mainly to the low stands of the sea level related to the glacials.
The interpretation of seismic sequences show that the Danube and Dniepr fans were accreted during the past 480 k.yr (sequences 3 to 8). Average deposition rates for the fan sequences range from 2.4 to 7.2 m/k.yr and the volume of material deposited within a sea level cycle lies between 4,300 km�� and 9,590 km��.
Within the deep-sea zone of the Black Sea, the existing accumulation of recent sediments is represented by coccolith ooze overlying sapropelic or organogen sediments (Ross et al., 1970) highlighting the domination of the organic component over the detrital one. Ross and Degens (1974) have defined the following succession of the upper sediment layers:
Unit I ����� coccolith ooze (0 - 3,000 yrs BP) : micro laminated carbonated�� sediment with Emiliana huxleyi
Unit II ����� sapropel beds (3,000 - 7,000 yrs BP) ����� micro laminated sediment very rich in organic matter (sapropel)
Unit III ����� banded lutite (7,000 - 25,000 yrs BP) ����� banded lutites �� turbidites.
These units correspond to the Arkhangelskiy and Strakhov�����s (1938) stratigraphic units: (1) recent deposits; (2) Old Black Sea beds, and (3) Neoeuxinian deposits (Tables 1B.2 and 1.3).
Very seldom and locally spread gravitationally transported material and mainly hemipelagic sediments occur within the slope, apron and abyssal zones, during this high stand sea level. ��
1B.5. Past environmental and sea level changes in the Black Sea
Large-scale sea level changes and consequently drastic reshaping of land morphology, large accumulation of sediments in the deep part of the sea and modifications of environmental settings occurred all along the Black Sea geologic history. The Quaternary was especially characterised by very spectacular changes, which have been driven by the global glaciations and deglaciations.
During these changes the Black Sea level behaviour was influenced by the restricted connection with the Mediterranean Sea by the Bosporus ����� Dardanelles Straits. When the general sea level lowered below the Bosporus sill, the further variations of the Black Sea level followed specific regional conditions, without being necessarily coupled to the ocean level changes. One of the main consequences of the lowstands was the interruption of the Mediterranean water into the Black Sea, which became an almost freshwater giant lake.
The main glacial periods of the Quaternary in Europe (Danube, G��nz, Mindel, Riss and W��rm) corresponded to the regressive phases of the Black Sea, with lowstands of the water level down to �����120 m. As mentioned above, the regressions represent phases of isolation of the Black Sea from the Mediterranean Sea and the World Ocean. Only the connection with the Caspian Sea could sometimes continue through Manytch valley. Correspondingly, during regressions, under fresh water conditions, the particularities of fauna assemblages had a pronounced Caspian character. On the contrary, during the interglacials, the water level rose to levels close to the present level; the Black Sea was reconnected to the Mediterranean Sea, and the environmental conditions as well as the fauna characteristics underwent marine Mediterranean influences.
For example, during the Karangatian phase (since 125 ka BP to ~ 65 ka BP) of the Black Sea, which corresponds to the warm Riss-W��rmian (Mikulinian) interglacial (Fig. 1B.6), the water level exceeded the present-day level by 8 to 12 m. The saline Mediterranean water penetrated through the Bosporus, and the Black Sea became saline (30 to 37����), with a steno- and eury-haline marine Mediterranean type fauna (Nevesskaya, 1970). The sea covered the lowlands in the coastal zone.
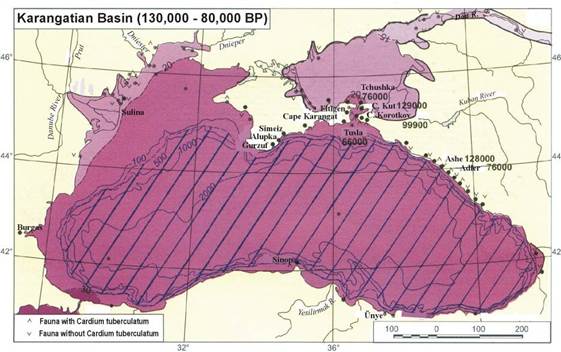
Fig. 1B.6. Plaeo-geographic reconstruction of the Black Sea during the Karangatian phase (Riss-W��rmian or Mikulinian interglacial) (after Tchepalyga, 2002).
The last Upper W��rmian glaciation (Late Valdai, Ostashkovian) corresponds to the Neoeuxinian phase of the Black Sea. This is a very low-stand phase, down to -110 - 130 m. The shoreline moved far away from the present-day position, especially in the north-western part of the Black Sea, and large areas of the continental shelf were exposed (Fig. 1B.7). The hydrographic network, especially the large rivers as Palaeo-Danube and Palaeo-Dniepr, incised up to 90 m the exposed areas. The Neoeuxinian basin, during the glacial maximum (~19 �· 16 ka BP) was completely isolated from the Mediterranean Sea, and, correspondingly, the water became brackish and even fresh (3-7���� and even less), well oxygenated, without H2S contamination. The fauna was brackish to fresh water type with Caspian influence.
At about 16 - 15 ka BP, the postglacial warming and the ice caps melting started. As the supply of the melting water from the glaciers through the Dniepr and the Dniestr rivers, as well as the Danube river to the Black Sea was very direct and important, the Neoeuxinian sea-level rose very quickly, reaching and overpassing at ~ 12 ka BP the Bosporus sill altitude. The majority of scientists, who studied the Black Sea, believe that in this phase it was a large fresh-water outflow through the Bosporus-Dardanelles straits towards the Mediterranean (Aegean) Sea. Kvasov calculated (1975) that the fresh water outflow discharge was of about 190 km3/year.
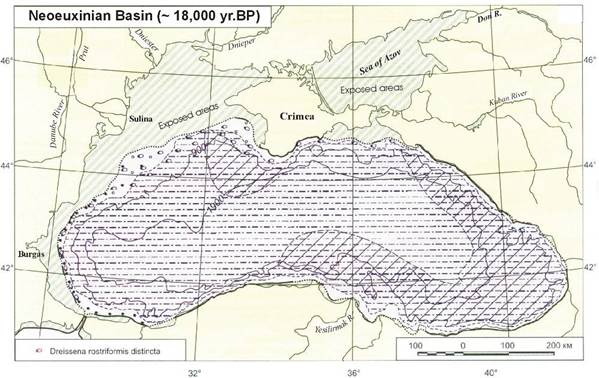
Fig. 1B.7. Palaeo-geographic reconstruction of the Black Sea during the Neoeuxinian phase (Upper W��rmian) (after Tchepalyga, 2002).
At the beginning of the Holocene, some 9-7.5 ka BP, when the Mediterranean and the Black Seas have reached the same level (close to the present day one), the two-way water exchange was established, and the process of transformation of the Black Sea in an anoxic brackish sea started. During the last 3 ka BP, a number of smaller oscillations of the water level have been recorded (���œPhanagorian regression����, ���œNymphaean���� transgression, a lowering of 1-2 m in the X-th century AD, a slow rising continuing even today).
In the late nineties, a new hypothesis was formulated by Ryan et al. (1997). They considered that, when the deglaciation started during a short episode, the level of the Black Sea was high enough, and the fresh Pontic water flowed towards the Aegean Sea. At about 12 k.yr BP, the retreat of the ice-sheet front determined the reorienting towards the North Sea, for the limited period of time of melt-water supply. The Black Sea, without the inflow of the ice-melting water during the Younger Drias cooling (~11 ka BP) until 9 ka BP, under more arid and windy climate, experienced a new lowering of the level (down to -156 m). At the same time, the Mediterranean Sea continued to rise, reaching by 7.5 K.yr BP the height of the Bosporus sill, and generating a massive input of salt water into the Black Sea basin. The flux was several hundred times greater than the world�����s largest waterfall, and it caused a rise of the level of the Black Sea, some 30 to 60 cm per day topping up the basin in few years time. More recent interpretation concludes that a deeper Bosporus sill (~ -85 m) could lead to another scenario of mixing of Black Sea and Mediterranean waters (Major et al., 2002).
This new hypothesis is still under debate; numerous data from the straits of Bosporus and Dardanelles, Marmara and Aegean Seas and the Danube Delta do not entirely support the Ryan�����s hypothesis. These data indicates that the ���œclassical���� scenario of Black Sea water outflow is rather credible. There are also some hydraulic incompatibilities for accepting a catastrophic flooding event in the Black Sea as well as a different time scale for reaching the present day salinity of the Black Sea waters (Myers at al., 2003). The scenario proposed by the EU ���œAssemblage���� project (Lericolais et al., 2006) after an extensive study of the western Black Sea is synthesized as shown in Fig. 1B.8.
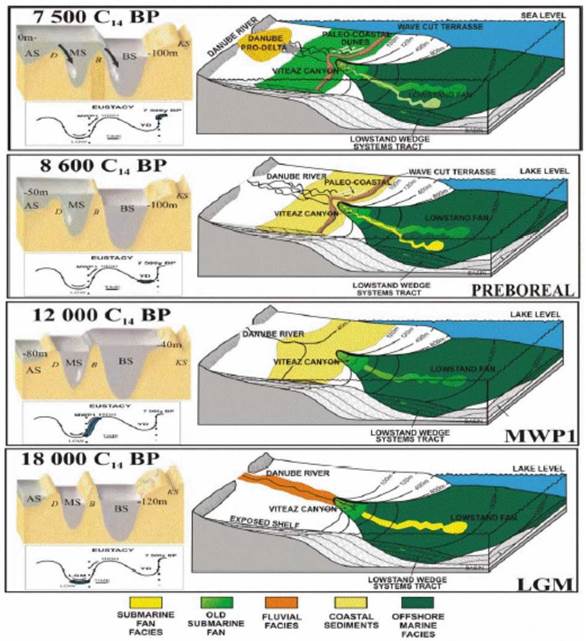
Fig. 1B.8. The scenario of the Black Sea water level fluctuation since the Last Glacial Maximum (after Lericolais at al., 2006, Final Report of the EU project ���œAssemblage����)
The water brought to the Black Sea after the Melt Water Pulse 1A (MWP1A) at approximately 12,500 C14 BP (14,500 yr cal. BP) (Bard et al., 1990) was supposed to be sufficiently important that the water level rose up to between -40 m to -20 m, where the Dreissena layers were deposited. This water level would have brought the level of the Black Sea high enough for making possible an inflow of Mediterranean water with marine species of dinoflagellates (Popescu, 2004), and an outflow of Pontic waters towards Mediterranean Sea. Palynological studies show that during the Younger Dryas a cool and drier climate prevailed. The Younger Dryas climatic event had lowered the Black Sea water-level and cut again the connection with the Mediterranean Sea. Around 7.5 kyr BP, the Black Sea water level suddenly changed because of a quite abrupt flooding of the Black Sea by Mediterranean waters, as supposed by Ryan et al. (1997, 2003) supported with dinoflagellate cyst records (Popescu, 2004).
.
Table 1B.2. Stratigraphy and correlations of Upper Quaternary phases for the coastal and inner shelf zones (with slight modification from Fedorov, 1978).
| General scale | Europe | ��European Russia | Black Sea region | ||||||||
| General stratigraphic scale | W and NW Black Sea | Northern Black SeaCrimea, Kerch, Taman | Eastern Black Sea Caucasus | ||||||||
| Holocene | Flandrian | Holocene | Black Sea Horizon | Nymphean | Terrace at 2 m; sands with Cardium edule L. etc.���� | Terrace at 2 m; Sands with Cardium edule L. etc.���� | Terrace at 2 m; sands with Cardium edule L. etc.���� | ||||
| Phanagorian | Regression to ����� 6 ����� 8 m. Archeological layers V�·I c. BC | Regression to ����� 6 ����� 8 m. Archeological layers V�·I c. BC | Regression to ����� 6 - 8 m. Archeological layers V�·I c. BC | ||||||||
| New Black Sea | Terrace at +4 +5 m; sands and shells with Cardium edule L., Chlamys, Ostrea, Mytilus�� | Terrace at +4 +5 m; sands and shells with Cardium edule L., Chlamys, Ostrea, Mytilus�� | Terrace at +4 +5 m; sands and shells with Cardium edule L., Chlamys, Ostrea, Mytilus�� | ||||||||
| Old Black Sea | Clayey sands with Cardium edule L. etc. at �����10 �����20�� m water depth on shelf | Clayey sands with Cardium edule L. etc. at���� -10 -20 m water depth on shelf | Clayey sands with Cardium edule L. etc. at���� -10 -20 m water depth on shelf | ||||||||
| Pleistocene | Upper | Grimaldian ����� Wűrm(regression to-100 -130 m) | Ostashkovian | Neoeuxinian | Late���� Neoeuxinian | Wűrmian loess ; clays with Monodacna caspia Eichw., Dreissea polymorpha Pall.,at �����20 �����30 m water depth on shelf | Clays with Monodacna caspia Eichw., Dreissea polymorpha Pall., at �����20 �����30 m water depth on shelf | Clays with Monodacna caspia Eichw., Dreissea polymorpha Pall., at �����20 �����30 m water depth on shelf | |||
| Mologo-Sheksnian | Early�� Neoeuxinian(Postkarangatian) | Regression to �����60 ����� 80���� (-130) m.�� Wűrmian loess. Deepening of the valleys incisions | Loesslike deposits; alluvial-deltaic sands, deepening of Kertch strait. | Regression ; deepening of the valleys incisions to �����60 �����80 m. | |||||||
| Kalininian | |||||||||||
| Neotyrrhenian(terrace at�� 2-8 m above SL) | Mykulinian | Karangatian | Upper Karangatian | Terrace at +15 +16 mShells and sands with Cardium tuberculatum L., Paphia senescens (Coc.) etc. | Terrace at�� +8 +12 m (4�·8 m Taman) Shells and clays with Cardium tuberculatum L., Paphia senescens (Coc.), Aporrhais pespelicani L. etc. At the base clays with�� Paphia senescens (Coc.), Cerithium vulgatum Burg. | Terrace at +12 +15 m (Pshady valley), +25 +30 m (in Sochi region);Shells with Cardium tuberculatum L., Paphia senescens (Coc.), Aporrhais pespelicani L., Cerithium vulgatum Burg.etc. | |||||
| Lower Karangatian | |||||||||||
| Middle | Regression (Riss II ?)Deepening of Bosporus to - 100 m | Moskovian | UpperEuxinian-Uzunlarian | Regression | Regression.Clayey loess-like deposits. | Clayey deposits with Limneea, Planorbis ; pebbles with Viviparus | Regression. Alluvial pebbles, terminal moraine at Amtkheli. | ||||
| Eutyrrhenian (Tyrrhenian Ib)(terrace at 10-20 m) | Odyntzovian | Uzunlarian | Terrace at +35 +40 m (Bulgaria)Upper Babel layers, sands with Didacna nalivkini Wass. etc., Uppermost lagoonal clays | Clayey sands with Cardium edule L., Didacna nalivkini Wass. etc. | Terrace at +25 +30 m (Pshady) and +35 +37m (Pshady valley); pebbles, sands with Cardium edule L., Mactra stultorum L., Scrobicularia | ||||||
| Regression (Riss I ?) | Dneprian | Late Paleoeuxinian | Sands and clays with Didacna�� nalivkini Wass., D.pontocaspia Pavl., Viviparus | Terrace at 40�·43 m (Pshady valley); Sands, conglom., limstones with D.nalivkini Wass., D. subpiramidata Prav., at the base Balanus | |||||||
| LowerEuxinian-Uzunlarian | Regression | Regression | Regression | Regression, Dilluvium | |||||||
| Paleotyrrhenian (Tyrrhenian I-a)(terrace at 18-30 m) | Lykhvinian | Paleouzunlarian | Sands, clays with Didacna pallasi Prav., D.nalivkini Wass.Lower Babel layers.Lagoonal clays with Didacna pseudocrassa Pavl. etc. | Continental deposits within the Mandzhil terrace | Terrace at +45 +50 m (at Ashe, Makopse, Magri); pebbles with C.edule, Paphia sp., Chione gallina | ||||||
| Early Paleoeuxinian | Terrace at�� +60 +65 m (Dzhubgy); sands, pebbles with Didacna baericrassa Pavl., D.pallassi Prav., C.edule L. | ||||||||||
| Lower | Mindel(Roman regression) | Okan | Regression | Alluvial sands with Viviparus and Tyraspol complex of mammalians | Top deposits with Archidiscodon sp. | Regression | |||||
| Cromerian | Sicilian 2Terrace�� at 60 m | Dnestrian | Tchaudian | Upper Tchaudian | Shells, sands with Didacna pseudocrassa Pavl., D. tschaudae Andrus., D.rudis Nal. ;Terrace �� Large tables �� (Bolshye stoly) | Terrace +40 +55 m(at Pshady), +100 +105 m (at Pshady valley), ~+130 m (at Sochi) ; Congl.,sands with�� D.pseudocrassa,���������� D. Tschaudae, D.rudis | |||||
| Sicilian 1Terrace�� at 100 m | Lower Tchaudian | Clayey������ continental���� depositsSands with Didacna baericrassa, D.parvula, V.pseudoachatinoides, Fagotia esperi | Sandy-clayey deposits of Guria with D. tschaudae, D. tschaudae guriana Livent., D.crassa guriensis Newesk., D. pleisto-pleura (Davit), D.pseudocrassa | ||||||||
| Gurian �����Tchaudian | |||||||||||
| Gűnz (regression) | Regression | Sands and clays with Archidiscodon meridionalis Nest. (late) within Nogaysk outcrop | Continental deposits with Taman complex of mammalian fauna | Deposits with Gurian-Tschaudian fauna | Break | ||||||
| Eopleistocene | Emilian-Calabrian | Morozovian-Nogayskian | Gurian | Gurian deposits | Clays with Didacna digressa Livent. etc. | ||||||
Table 1B.3. Stratigraphy and correlations of Upper Quaternary phases for shelf and bathyal zones (with slight modification from Scherbakov et al., 1979)
| Northern Europe | BLACK SEA | |||||||||||||||||||
| Stratigraphic subdivisions | Bathymetric zone 0-50 m | Bathymetric zone 50-200 m | Bathyal zone - northern part | Bathyal zone - southern part | ||||||||||||||||
| Layers | Molluscs | Horizon | Molluscs | Diatomaea | Horizon | Diatoms, molluscs | Horizon | Nannopl,dinoflagelates | Age | |||||||||||
| Holocene | Upper | Subatlantic-���� 2,800Sub-boreal-���� 4,800Atlantic-���� 7,800Boreal-���� 9,400Pre-boreal-���� 10,200Younger DryasAller�¸dLower DryassB�¸llingGothiglacialPomeranianFrankfurtianBrandenburgian-���� 25,000PaudorfArcyGotweig-���� 40,000-���� ~ 65,000Eemian-���� ~125,000 | Dzhemetinian | Divaricella divaricataGafrarium minimum Pitar rudis������ Cardium papillosum | Phaseolinus muds | Modiolus phaseolinus | Coscinodiscus radiatusThalassiosira excentricaActinocyclus ehrenbergiiCyclotella kutzingianaCyclotella aceolata | Cocolith ooze | Coscinodiscus radiatusEndictia oceanicaThalassiosira excentricaAsteromphalus robustusRhizosolenia calcar avis | Cocolith oozeUnit 1 | Emiliania huxleiLingulodinium sp.Peridinium sp. | |||||||||
| Middle | Kalamitian | Chione gallinaSpisula subtruncataMytilus galloprovincialis | Mytilus muds | Mytilus galloprovincialisCardium edule | Coscinodiscus radiatusThalassiosira excentricaAsteromphalus robustus | Sapropel-likemuds | Sapropel mudsUnit 2 | Braarudosphera bigeloviPeridinoum trochoideum | ||||||||||||
| Bugazian-Viteazian | Cardium eduleAbra ovataCorbula mediterraneaMytilaster lineatusMonodacna caspiaDreissena polymorpha | 6,800 �� 140 | Mytilus galloprovincialisCardium eduleMonodacna caspiaDreissena polymorpha | Thalassiosira excentricaStephanodiscus astraeaSynedra buculusNavicula palpebralis var. semiplena | Terrigenous-biogenic muds | Terrigenous-biogenic mudsUnit 3 | 7,090�� 1808,600�� 20013,850��20016,900��27022,00025,00040,000 | |||||||||||||
| Lower | Neoeuxin | Monodacna caspiaDreissena polymorphaDreissena polymorphaViviparus fasciatusUnio sp. | 8,550 �� 13013,500��1,50017,760 �� 200 | Monodacna caspiaDreissena rostriformis bugensisDreissena rostriformis distinctaDreissena rostriformis distincta | Stephanodiscus astraeaMelosira arenariaDiploneis domblitensis | Hydrotroilitic mudsTerrigenousbrown �� oxydated ��muds Clayey muds | Stephanodiscus astraeaFragments and young forms of :Dreissena rostriformisMonodacna caspia | Nannofossil-rich terrigenous mudLacustrian phase | Reworked Cretaceous. Paleogen, Neoge CocolithsTectatodinium spirifirites | |||||||||||
| Upper�� Pleistocene | Wűrm�� (Valdai) | Upper | Ostashkovian glaciation | |||||||||||||||||
| Karkinitian | Dreissena polymorphaCardium edule | Dreissena rostriformis distincta | Micromelania caspia | |||||||||||||||||
| Tarkhankutian | Cardium eduleAbra ovataDreissena polymorpha | ~ 22,000~ 25,000 | Abbreviations :M-S.ig. = Mologo-Sheksnian interglacial K.g.���������� = Kalininian�� glacial | Cardium edule | Marine phase | |||||||||||||||
| Middle | M-S.ig. | Surozhian | ||||||||||||||||||
| Lower | K.g | Regression | ||||||||||||||||||
| Post-Karangatian | ||||||||||||||||||||
| Riss-Wűrm | Mikulinian interglacial | Karangatian | ||||||||||||||||||
References
Aksu, A. E., Hiscott, R. N., Kaminski, M. A., Mudie, P. J., Gillespie, H., Abrajano, T., and Yasar, D., 2002a, Last glacial-Holocene paleoceanography of the Black Sea and Marmara Sea: stable isotopic, foraminiferal and coccolith evidence: Marine Geology, v. 190, no. 1-2, p. 119-149.
Aksu, A. E., Hiscott, R. N., Mudie, P. J., Rochon, A., Kaminski, M. A., Abrajano, T., and Yasar, D., 2002b, Persistent Holocene outflow from the Black Sea to the eastern Mediterranean contradicts Noah's Flood hypothesis: GSA Today, no. May, p. 4-10.
Aksu, A. E., Hiscott, R. N., and Yasar, D., 1999, Oscillating Quaternary water levels of the Marmara Sea and vigorous outflow into the Aegean Sea from the Marmara Sea Black Sea drainage corridor: Marine Geology, v. 153, no. 1-4, p. 275-302.
Aksu, A. E., Hiscott, R. N., Yasar, D., Isler, F. I., and Marsh, S., 2002c, Seismic stratigraphy of Late Quaternary deposits from the southwestern Black Sea shelf: evidence for non-catastrophic variations in sea-level during the last ~10000 yr: Marine Geology, v. 190, no. 1-2, p. 61-94.
Algan, O., ���agatay, N., Tchepalyga, A. L., Ongan, D., Eastoe, C., and G��kasan, E., 2001, Stratigraphy of the sediment infill in Bosphorus Strait: water exchange between the Black and Mediterranean Seas during the last glacial-Holocene: Geo-Marine Letters, v. 20, no. 4, p. 209-218.
Algan, O., Gokasan, E., Gazioglu, C., Yucel, Z. Y., Alpar, B., Guneysu, C., Kirci, E., Demirel, S., Sari, E., and Ongan, D., 2002, A high-resolution seismic study in Sakarya Delta and Submarine Canyon, southern Black Sea shelf: Continental Shelf Research, v. 22, no. 10, p. 1511-1527.
Andrusov, N.I. 1892. Some results of the expedition of ���˜Tchernomoryetz�����: About the genesis of the hydrogene sulphide in the Black Sea waters. Comm. Russian Geographical Soc. 28, 5: 89-94 (in Russian).
Andrusov, N.I., 1926. Paleogeographical maps of the Black Sea region in the Upper Pliocene, Pontic, Tchaudian and in the Euxinian Lake epoch���� Bull. MOIP, Sect. Geology 4, 3-4: 35-46 (in Russian).
Arkhangelskyi, A. D. 1927. ���œOn the Black sea sediments and their importance in the knowledge of sedimentary deposits.���� Bull MOIP, Sect. Geology 5, 3-4: 199-264 (in Russian).
Arkhangelskyi, A.D., and N. M. Strakhov. 1932. The geological structure of the Black Sea.Bull MOIP, Sect. Geology 10, 1: 3-104 (in Russian).
Arkhangelskyi, A.D., and N. M. Strakhov , 1938. The geological structure of the Black Sea and its evolution. Moscow-Leningrad: Ed. Acad. Sc. USSR (in Russian).
Arkhipov, S. A., Ehlers, J., Johnson, R. G., and Wright, H. E. J., 1995, Glacial drainage towards the Mediterranean during the middle and late Pleistocene.: Boreas, v. 24, no. 3, p. 196-206.
Ballard, R. D., Coleman, D. F., and Rosenberg, G., 2000, Further evidence of abrupt Holocene drowning of the Black Sea shelf: Marine Geology, v. 170, no. 3-4, p.253-261.
Balkas, T., G. Dechev, R. Mihnea, O. Serbanescu, and U.Unl��ata. 1990. State of marine environment in the Black Sea region. UNEP Regional Seas Report and Studies 124, UNEP.
Bern��, S., Auffret, J.-P., and Walker, P., 1988, Internal structure of subtidal sand waves revealed by high-resolution seismic reflection: Sedimentology, v. 35, p. 5-20.
Bern��, S., Lericolais, G., Marsset, T., Bourillet, J.-F., and De Batist, M., 1998, Erosional offshore sand ridges and lowstand shore-facies : examples from tide and wave dominated environments of France: Journal of Sedimentary Research, v. 68, no. 4, p. 540-555.
Bondar, C., 1998, Hydromorphological relation characterizing the Danube river mouths and the coastal zone in front of the Danube delta: Geo-Eco-Marina, v. 3, p. 99-102.
Calvert, S. E., and Fontugne, M. R., 1987, Stable carbon isotopic evidence for the marine origin of the organic matter in the Holocene Black Sea sapropel: Chemical Geology, v. 66, no. 3-4, p. 315-322.
Carter, R. W. G., Hesp, P. A., Nordstrom, K. F., and Psuty, N. P., 1990a, Erosional landforms in coastal dunes, in Nordstrom, K. F., Psuty, N. P., and Carter, R. W. G., eds., coastal dunes; processes and morphology: Chichester (United Kingdom), John Wiley & Sons, p. 217-250.
Carter, R. W. G., Nordstrom, K. F., and Psuty, N. P., 1990b, The study of coastal dunes, in Nordstrom, K. F., Psuty, N. P., and Carter, R. W. G., eds., Coastal dunes; processes and morphology: Chichester (United Kingdom), John Wiley & Sons, p. 1-14.
Correggiari, A., Field, M. E., and Trincardi, F., 1996, Late Quaternary transgressive large dunes on the sediment-starved Adriatic shelf, in De Batist, M., and Jacobs, P., eds., Geology of Siliciclastic Shelf Seas.: London, Geological Society Special Publication, p. 155-169.
Demirbag, E., G��kasan, E., Oktay, F. Y., Simsek, M., and Y��ce, H., 1999, The last sea level changes in the Black Sea: Evidence from the seismic data: Marine Geology, v. 157, no. 3-4, p. 249-265.
Dimitrov, P. S., 1982, Radiocarbon datings of bottom sediments from the Bulgarian Black Sea Shelf: Bulg. Acad. Sci. Oceanology, v. 9, p. 45-53.
Evsylekov, Y. D., and Shimkus, K. M., 1995, Geomorphological and neotectonic development of outer part of continental margin to the south of Kerch Strait: Oceanology, v. 35, p. 623-628.
Fairbanks, R. G., 1989, A 17,000-year glacio-eustatic sea level record; influence of glacial melting rates on the Younger Dryas event and deep-ocean circulation: Nature, v. 342, no. 6250, p. 637-642.
Fedorov P.V., 1978. The Pleistocene of the Ponto-Caspian Region. Trudy Geol.Inst. Acad,Sc.USSR, Nauka, Moscow, 168 p. (in Russian).
Fedorov, P. V., 1988, The problem of changes in the level of the Black Sea during the Pleistocene: International Geology Review, v. 30, no. 6, p. 635-641.
Fedorov, P. V., 2000, Pleistocene climatic events in the geological history of the Black Sea: Stratigraphy and Geological Correlation, v. 8, no. 5, p. 491-497.
Filipova-Marinova, M., 2004, Late quaternary palaeoenvironmental records from the southern Bulgarian Black Sea coast, in ASSEMBLAGE first workshop, Varna, Bulgaria, p. 10.
Finetti, I., G. Bricchi, A. Del Ben, M. Papin, and Z. Xuan. 1988. ���œGeophysical study of the Black Sea area.���� Bull. Geofis. Teor. Appl. 30: 117�����118, 197�����234.
Fouache, E., Porotov, A., M��ller, C., and Gorlov, Y., 2003, The role of neo-tectonics in the variation of the relative sea level throughout the last 6000 years on the Taman Peninsula (Black Sea, Azov Sea, Russia), in Rapid Transgressions in semienclosed Basins, Gdansk - Jastarnia, Poland.
Fryberger, S. G., Al Sari, A. M., and Clisham, T. J., 1983, Eolian dune, interdune, sand sheet, and siliciclastic sabkha sediments of an offshore prograding sand sea, Dhahran area, Saudi Arabia: American Association of Petroleum Geologists Bulletin, v. 67, no. 2, p. 280-312.
Fryberger, S. G., Dean, G., and McKee, E. D., 1979, Dune forms and wind regime, A study of global sand seas: Reston, VA (USA), U. S. Geological Survey.
Giosan, L., Bokuniewicz, H. J., Panin, N., and Postolache, I., 1997, Longshore sediment transport pattern along Romanian Danube delta coast: Geo-Eco-Marina, v. 2, no.11�����24.
G��kasan, E., Demirbag, E., Oktay, F. Y., Ecevitoglu, B., Simsek, M., and Y��ce, H., 1997, On the origin of the Bosphorus: Marine Geology, v. 140, no. 1-2, p. 183-199.
Gorur, N., Cagatay, M. N., Emre, O., Alpar, B., Sakin��, M., Islamoglu, Y., Algan, O., Erkal, T., Kecer, M., Akkok, R., and Karlik, G., 2001, Is the abrupt drowning of the Black Sea shelf at 7150 yr BP; a myth?: Marine Geology, v. 176, no. 1-4, p. 65-73.
Gunnerson, C. G., and Oztuvgut, E., 1974, The Bosphorus, in Degens, E. T., and Ross, D. A., eds., The Black Sea - Geology, Chemistry and Biology: Tulsa, Amer. Assoc. Petrol. Geol., p. 99-114.
Hay, B., Honjo, S., Kempe, S., Ittekkot, V., Degens, E., Konuk, T., and Izdar, E., 1990, Interannual variability of particle flux in the Northwestern Black Sea: Deep Sea Research, v. 37, p. 911-928.
Hay, B. J., Arthur, M. A., Dean, W. E., Neff, E. D., and Honjo, S., 1991, Sediment deposition in the Late Holocene abyssal Black Sea with climatic and chronological implications: Deep-Sea Research, v. 38, no. Suppl.2, p. S1211-S1235.
Jones, G. A., and Gagnon, A. R., 1994, Radiocarbon chronology of Black Sea sediments: Deep Sea Research 1, v. 41, no. 3, p. 531-557.
Jous��, A. P., and Mukhina, V. V., 1978, Diatom units and the paleogeography of the Black Sea in the Late Cenozoic (DSDP, leg 42B).
Kenyon, N. H., and Stride, A. H., 1968, The crest length and sinuosity of some marine sand waves: Journal of Sedimentary Petrology, v. 38, p. 255-259.
Konyukhov, A. I., 1997, The Danube submarine fan: specific features of the structure and sediment accumulation: Lithology and Mineral Resources, v. 32, no. 3, p.197-207.
Kuprin, P. N., Scherbakov, F. A., and Morgunov, I. I., 1974, Correlation, age, and distribution of the postglacial continental terrace sediments of the Black Sea: Baltica, v. 5, p. 241-249.
Lericolais, G., Panin, N., Popescu, I., Bern��, S., Ion, G., and Blason scientific crew, 1998, Danube and Dniepr paleovalleys : New discoveries during BlaSON survey on the north western Black Sea shelf, in 3rd International Conference on the Petroleum Geology and Hydrocarbon Potential of the Black and Caspian Seas Area., Neptun, Constanza (Romania), p. 34.
Lericolais, G., Popescu, I., Guichard, F., Popescu, S. M., and Manolakakis, L., 2007, Water-level fluctuations in the Black Sea since the Last Glacial Maximum, in Yanko-Hombach, V., Gilbert, A. S., Panin, N., and Dolukhanov, P.M., eds., The Black Sea Flood Question: Changes in Coastline, Climate, and Human Settlement.
Lericolais, G., Popescu, I., Panin, N., Guichard, F., Popescu, S. M., and Manolakakis, L., 2003, Could the last rapid sea level rise of the Black Sea evidence by oceanographic surveys have been interpreted by Mankind?, in CIESM Workshop Monographs, Fira, Santorini, Greece, p. 44-53.
Major, C. O., 1994, Late Quaternary sedimentation in the Kerch area of the Black Sea shelf: response to sea level fluctuation [BA thesis]: Wesleyan University, 116 p.
Major, C. O., Ryan, W. B. F., Lericolais, G., and Hajdas, I., 2002, Constraints on Black Sea outflow to the Sea of Marmara during the last glacial-interglacial transition: Marine Geology, v. 190, no. 1-2, p. 19-34.
Mamaev, V. O., and Musin, O. R., 1997, Black Sea Geographic Information System, CD-ROM, in Programme, B. S. E. P.- U. N. D.P., ed.: New York, United Nations Publications.
Muratov, M.V. 1951. ���œHistory of the Black Sea basin in relation to the development of surrounding areas.���� Bull. MOIP, Section Geology, NS 26: 1, 7-34 (in Russian).
Muratov, M.V., and Yu. P Neprochnov, 1967. ���œStructure of the Black Sea depression and its origin.���� Bull. MOIP, Section Geol. 42: 5, 40-49 (in Russian).
Neprochnov, Yu. P. 1958. ���œThe results of seismic investigation in the Black sea in the neighborhood of Anapa.���� Dokl. Acad. Sc. USSR 121: 6, 1001-1004 (in Russian).
Neprochnov, Yu. P. 1960. ���œThe deep structure of Earth crust below the Black Sea based on seismic data.���� Bull. MOIP.,Section Geol. 35: 4, 30-36 (in Russian).
Neprochnov, Y. P., 1980, Geologicheskaya istoriya Chernogo morya po rezul'tatam glubokovodnogo bureniya - (Translated Title: The geological history of the Black Sea from the results of deep-sea drilling): Moscow, USSR, Nauka Press, 212 p.
Nevesskaja, L. A., 1965, Late Quaternary bivalve mollusks of the Black Sea: Their systematics and ecology: Akad. Nauk SSSR Paleont. Inst. Trydy, v. 105, p. 1-390.
Nevesskaja, L. A., 1970, Contribution to the classification of ancient closed and semiclosed bodies of water on the basis of the character of their fauna, in Obruchev, D. V., and Shimansky, V. N., eds., Modern problems in paleontology: Moscow, Nauka Press, p. 258-278.
Nevesskiy, E. N. 1961. Postglacial transgressions of the Black Sea. Dokl. Acad. Sc. USSR 137: 3, 667-670 (in Russian).
Nevesskiy, E. N. 1967. Processes of sediment formation in the near-shore zone of the sea. Moscow: Nauka (in Russian).
Nikonov, A. A., 1995, Manifestations of young tectonic activity in the southern Azov and Kerch fault zones: Geotectonics, v. 28, no. 5, p. 381-390.
Noakes, J. E., and Herz, N., 1983, University of Georgia Radiocarbon dates VII: Radiocarbon, v. 25, no. 3, p. 919-929.
Ostrovskiy, A. B., Izmaylov, Y. A., Balabanov, I. P., Skiba, S. I., Skryabina, N. G., Arslanov, S. A., Gey, N. A., and Suprunova, N. I., 1977, New data on the paleohydrological regime of the Black Sea in the Upper Pleistocene and Holocene, in Kaplin, P. A., and Shcherbakov, F. A., eds., Paleogeography and Deposits of the Pleistocene of the Southern Seas of the USSR: Moscow, Nauka Press, p. 131-141.
Ozsoy, E., Unluata, U., and Top, Z., 1993, The evolution of Mediterranean water in the Black Sea; interior mixing and material transport by double diffusive intrusions: Progress in Oceanography, v. 31, no. 3, p. 275-320.
Panin, N., 1983, Black Sea coastline changes in the last 10,000 years: a new attempt at identifying the Danube mouths as described by the ancients: Dacia N.S., v. 27, p.175-184.
Panin, N., 1989, Danube delta: Genesis, evolution sedimentology: Rev. Roum. G��ol. G��ophys. G��ogr., v. 33, p. 25-36.
Panin, N., 1997, On the geomorphologic and geologic evolution of the river Danube: Black Sea interaction zone: Geo-Eco-Marina, v. 2, p. 31-40.
Panin, N., Jipa, D., 1998, Danube river sediment input and its interaction with the north-western Black Sea: results of EROS-2000 and EROS-21 projects: Geo-Eco-Marina, v. 3, p. 23-35.
Panin, N., Jipa, D., 2002, Danube River Sediment Input and its Interaction with the north-western Black Sea: Estuarine, Coastal and Shelf Science, v. 54, no. 3, p. 551-562.
Panin, N., Panin, S., Herz, N., and Noakes, J. E., 1983, Radiocarbon dating of Danube Delta deposits: Quaternary Research, v. 19, p. 249-255.
Panin, N., Popescu, I., 2007, The northwestern Black Bea: climatic and sea level changes in the Upper Quaternary, in Yanko-Hombach, V., Gilbert, A. S., Panin, N., and�� Dolukhanov, P. M., eds., The Black Sea Flood Question: Changes in Coastline, Climate, and Human Settlement: Springer.
Pazyuk, L. I., Rychkovskaya, N. I., Samsonov, A. I., Tkachenko, G. G., and Yatsko, I.Y., 1974, History of the northwestern margin of the Black Sea in light of the new data on the stratigraphy and lithology of Plio-Pleistocene bottom rocks in the area of Karkinitskiy Bay: Baltika, v. 5, p. 86-92.
Popa, A., 1993, Liquid and sediment inputs of the Danube river into the north-western Black Sea Univ: Mitt. Geol.-Palaont. Inst. Hamburg, v. 74, p. 137-149.
Popescu, I., 2002, Analyse des processus s��dimentaires r��cents dans l'��ventail profond du Danube (mer Noire) [PhD thesis]: Universit�� de Bretagne Occidentale-Universit�� de Bucarest, 282 p.
Popescu, I., Lericolais, G., Panin, N., Normand, A., Dinu, C., and Le Drezen, E., 2004, The Danube Submarine Canyon (Black Sea): morphology and sedimentary processes: Marine Geol., v. 206, no. 1-4, p. 249-265.
Popescu, I., Lericolais, G., Panin, N., Wong, H. K., and Droz, L., 2001, Late Quaternary channel avulsions on the Danube deep-sea fan: Marine Geology, v. 179, no. 1-2, p. 25-37.
Popov, G. I., 1970, Significance of fresh water molluscs for correlation of continental and marine Pleistocene of Ponto Caspian. In: Geology and fauna of the lower and middle Pleistocene: Palaeogeography, Palaeoclimatology, Palaeoecology, v. 8, no. 2-3, p. 251-260.
Popov, G. I., 1975, New data on the stratigraphy of Quaternary marine sediments of the Kerch' Strait: Transactions (Doklady) of the U.S.S.R, v. Academy of Sciences: Earth Science Sections. 213(1973), no. 1-6, p. Pages 84-86.
Popov, G. I., and Suprunova, N. I., 1977, Stratigraphy of Quaternary bottom sediments of the Kerch' Strait: Transactions (Doklady) of the U.S.S.R, v. Academy of Sciences: Earth Science Sections. 237, no. 1-6, p. 111-113.
Robinson, A.G., J. H. Rudat, C. J. Banks, and R.L.F. Wiles. 1996. ���œPetroleum geology of the Black Sea. Mar.���� Pet. Geol. 13: 195�����223.
Ross, D. A., and Degens, E. T., 1974, Recent sediments of the Black Sea, in Degens, E. T., and Ross, D. A., eds., The Black Sea - Geology, Chemistry and Biology: Tulsa, Amer. Assoc. Petrol. Geol., p. 183-199.
Ryan, W. B. F., 2004, The Black Sea flood; a seed for a Myth ?, in 32nd IGC Florence 2004, Florence, p. Session T17.05 - Myth and geology.
Ryan, W. B. F., Major, C. O., Lericolais, G., and Goldstein, S. L., 2003, Catastrophic Flooding of the Black Sea: Annu. Rev. Earth Planet. Sci., v. 31, no. 1, p. 525-554.
Ryan, W. B. F., Pitman, W. C., IIIrd, Major, C. O., Shimkus, K. M., Moskalenko, V., Jones, G. A., Dimitrov, P. S., Gor��r, G., Sakin��, M., and Y��ce, H., 1997, An abrupt drowning of the Black Sea shelf: Marine Geology, v. 138, no. 1-2, p. 119-126.
V. Sedov. 1969. ���œStructure of the Earth�����s crust in the western part of the Black Sea.���� Dokl. Acad. Sc. USSR 186: 4, 905-907 (in Russian).
Shcherbakov, F. A., Kuprin, P. N., Potapova, L. I., Polyakov, A. S., Zabelina, E. K., and Sorokin, V. M., 1978, Sedimentation on the continental shelf of the Black Sea: Moscow, Nauka Press, 211 p.
Shcherbakov, F. A., and Babak, Y. V., 1979, Stratigraphic subdivision of the Neoeuxinian deposits in the Black Sea: Oceanology, v. 19, no. 3, p. 298-300.
Shcherbakov F.A., Koreneva E.V., and Zabelina E.K., 1979. Late quaternary stratigraphy of the Black Sea. Late Quaternary History and Sedimentogenesis of Marginal and Inland seas. Nauka, Moscow (in Russian).
Shimkus, K. M., Evsyukov, Y. D., and Solovjeva, R. N., 1980, Submarine terraces of the lower shelf zone and their nature, in Malovitsky, Y. P., and Shimkus, K. M., eds., Geological and Geophysical Studies of the Pre-Oceanic Zone: Moscow, P.P. Shirshov Inst. of Oceanology Acad. Sci. USSR, p. 81-92.
Shnyukov, Y. F., and Trashchuk, N. N., 1976, A new region of occurence of Karangatian deposits on the southern slope of the Kerch Peninsula: Ukrainian Academy of Sciences, Doklady, v. B, no. 12, p. 1078-1080.
Shopov, V., Bozilova, E., and Atanassova, J., 1992, Biostratigraphy and radiocarbon data of Upper Quaternary sediments from western part of the Black Sea (In Bulgarian with English summary): Geol. Balcanica, v. 22, p. 59-69.
Shopov, V., Chochov, S., and Georgiev, V., 1986, Lithostratigraphy of Upper Quaternary sediments from the northwestern Black Sea shelf between the parallels of the Cape Emine and Danube River mouth: Geologica Balcanica, v. 16, no. 6, p. 99-112.
Sorokin, V. M., Roslyakov, A. G., and Yutsis, V. V., 1998, New data on the structure of the upper Danube deep-sea fan: Lithology and Mineral Resources, v. 33, no. 6, p.518-524.
Stanley D. J., and Ch. Blanpied. 1980. Late Quaternary water exchange between the eastern Mediterranean and Black Sea. Nature 285: 537 541.
Stanley D. J., and Ch. Blanpied. 1981. The Sea of Marmara, late Quaternary lithofacies and palaeoceanographic exchange between eastern Mediterranean and the Black Sea. Marine geology and geophysics. Rapp. 27th Congress of CIESM 27: 8, 57.
Strakhov, N. M. 1954. Sedimentogenesis in the Black Sea. In Genesis of sediments in modern basins, 81-136. Moscow: Academy of Sc. USSR (in Russian).
Strakhov, N. M. 1963. Some characteristics of diagenesis of the Black Sea deposits. Lithology and mineral resources 1: 3-21 (in Russian).
Talling, P. J., 2000, Self-organization of river networks to threshold states: Water Resources Research, v. 36, no. 4, p. Pages 1119-1128.
Tchepalyga, A. L., 1984, Inland sea basins, in Velichko, A. A., Wright, H. E. J., and Barnosky-Cathy, W., eds., Late Quaternary Environments of the Soviet Union: Mineapolis, MN, United States, Univ. Minn. Press., p. 229-247.
Trashchuk, N. N., and Bolivets, V. A., 1978, A new area of occurence of Karangatian deposits on the NW coast of the Black Sea: Ukrainian Academy of Sciences, Doklady, v. B, no. 8.
Winguth, C., 1998, Pleistoz��ne Meeresspiegelschwankungen und Sedimentation im nordwestlichen Schwarzen Meer: Berichte aus dem Zentrum f��r Meeres- und Klimaforschung der Universit��t Hamburg, Reihe D, 129 p.
Winguth, C., Wong, H. K., Panin, N., Dinu, C., Georgescu, P., Ungureanu, G., Krugliakov, V. V., and Podshuveit, V., 2000, Upper Quaternary water level history and sedimentation in the northwestern Black Sea: Marine Geology, v.167, no. 1-2, p. 127�����146.
Wong, H. K., Panin, N., Dinu, C., Georgescu, P., and Rahn, C., 1994, Morphology and post-Chaudian (Late Pleistocene) evolution of the submarine Danube fan complex: Terra Nova, v. 6, p. 502-511.
Wong, H. K., Winguth, C., Panin, N., Dinu, C., Wollschl��ger, M., Ungureanu, G., and Podshuveit, V., 1997, The Danube and Dniepr fans, morphostructure and evolution: GeoEcoMarina, v. 2, p. 77-102.
Yaranov, D. 1939. Correlation of the Quaternary of the Balkan peninsula, the Black Sea, of the Mediterranean Sea and of the Atlantic coasts of the Euro-African bloc.���� God. SU. 35: 187-204.
Yevsyukov, Y.-D., and Shimkus, K. M., 1995, Geomorphological and neotectonic development of outer part of continental margin to the south of Kerch Strait: Oceanology, v. 35, no. 4, p. 623-628.
Zonenshain, L. P., and X. Le Pichon. 1986. Deep basins of the Black Sea and Caspian Sea as remnants of Mesozoic back-arc basins. Tectonophysics 123: 181�����212
CHAPTER 2 THE STATE OF EUTROPHICATION (T. Oguz et al.)
Institute of Marine Sciences, Middle East Technical University, Erdemli, Turkey
Inebolu Sokak 29, Kabatas, Istanbul, Turkey
A. Cociasu
National Institute for Marine Research and Development (NIMRD), Constanta, Romania
GOIN, Moscow, Russian Federation
2.1. Introduction
Marine eutrophication of coastal waters is considered to be a significant problem worldwide. The Black Sea is no exception, where considerable increase in the nutrient load has led to marked changes in the ecosystem structure and functioning. Eutrophication is defined here as excessive supply of nutrients (silicate, nitrogen and phosphorus) into water that subsequently leads to accelerated growth and over-production of algae and species of higher trophic levels, high rate of oxygen depletion, development of hypoxia or anoxia near the bottom of productive areas and subsequent degradation of benthic community structure. A key to successful management of coastal waters is reliable scientific assessment of eutrophication and of its governing processes. This chapter evaluates the current state and the long-term trend of eutrophication in the Black Sea using the available data for river nutrient (both organic and inorganic) loads, dissolved inorganic and organic nutrient, chlorophyll-a, surface and subsurface oxygen concentrations along the coast with respect to the reference conditions of the interior basin. The coastal stations are chosen from the sites that either receive river loads (like Sulina station) or are in close proximity of industrial complexes (like Constanta) or urban settlements (like Bay of Bourgas). Unless otherwise specified, the data described below are from the data-base of the Commission on the Protection of the Black Sea Against Pollution.
2.2. Long-term changes in river nutrient loads
The excessive nutrient enrichment was originated predominantly by enhanced river-based nutrient supply into the northwestern shelf starting by the early 1970s. The River Danube was used to be the major supplier of nutrients during the 1970s and 1980s that amounted to almost 80% of the total load into the sea. They were derived by agriculture, industry and urban settlements and supplied mainly through diffuse sources (Table 2.2.1). Based on more recent measurements at the discharge point of the Sulina branch, the River Danube contribution was reduced to nearly 50% of the overall river-based DIN and P-PO4 loads (Table 2.2.2). The remaining half was contributed almost equally by the Ukrainian rivers along the northwestern coast (Dniepr, Dniester, Bug) and the Turkish Rivers along the southern coast (Table 2.2.2).
Table 2.2.1. The sources and causes of nutrient enrichment in the western coastal waters of the Black Sea.
| Drivers of nutrient enrichment | Causes of nutrient enrichment | |
| Agriculture/farming | Lack of fertiliser storage facilitiesUnsustainable/inefficient farming practicesIntensive livestock productionIntensive fertiliser utilization and detergentsLack of proper effluent treatments of discharges from livestock and agricultural farms | Point and diffuse sources from agriculture/farming, industry and settlements Deposition from atmospheric emissions originated from land-based sourcesBackground emissions |
| Industry | Untreated or improperly treated industrial effluents due to outdated or absence of treatment technology�� Insufficient treatment plants and their poor managementLack of control for waste water treatment plants | |
Table 2.2.2 Annual-mean river-borne nutrient loads (in kilotonnes y-1) into the Black Sea from each country during 2003-2005 (from TDA, 2007). The superscripts (a) and (b) denote the estimates based on the TNMN measurements at Reni and the NMRD measurements at Sulina discharge point, respectively.
| Nutrient Load | Ukraine | Romania | Bulgaria | Turkey | Georgia | Russia | Total |
| DIN | 29.85 | 304.10(a)���� 68.86(b) | 2.35 | 24.87 | 0.54 | 0.84 | 362.55(a)127.31(b) |
| P-PO4 | 2.30 | 8.80(a)8.52(b) | 0.24 | 6.13 | 0.02 | 0.32 | 17.81(a)17.53(b) |
The total nitrogen emission from the River Danube catchments increased from about 400 kilotonnes (kt) y-1 in the 1950s to 900 kt y-1 in 1985-1990 and then reduced to 760 kt y-1 in 2000-2005 (Fig. 2.2.1a). Phosphorus emission was an order of magnitude smaller and changed from 40 kt y-1 in 1950s to its peak value of 115 kt y-1 during�� the first half of the 1990s and then to 70 kt y-1 in 2000-2005 (Fig. 2.2.1b). Both emissions are thus still roughly 1.5 times higher than the 1950s. The construction of Iron Gate 1 in 1975 was estimated to impose a minor influence on the total-N load but was more critical on controlling the total-P load (daNUbs Project Final Report, 2005). The nitrogen�����based agricultural run-off contributed around half of the total nitrogen emission since 1955 and contribution from urban settlements was around 20-30% (Fig. 2.2.1a). The increase in nitrogen emission is evidently well-correlated with fertilizer consumption prior to 1990 that increased from 0.5 million tonnes (mt) y-1 in the 1950s to 3.0 mt y-1 during the green revolution era in the eastern block countries during the 1980s (Fig. 2.2.1). According to this data set, phosphorus emission was mainly supplied by urban settlements up to 80% in 1990; the contribution of agriculture remained less than 20% (Fig. 2.2.1b). The effect of increase in phosphorus fertilizer consumption to 1.5 mt y-1 did not appear to increase agricultural-based phosphorus emission.
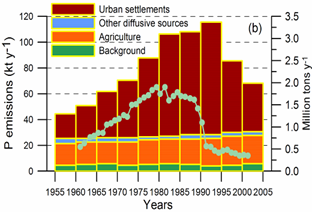
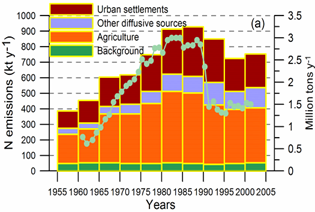
Fig. 2.2.1 Relative contributions of different point and diffuse sources to the emissions of (a) total nitrogen (N) and (b) total phosphorus averaged over 5 year bins and amounts of total nitrogen and phosphorus fertilizer consumption in the Danube catchments basin (solid circles). Redrawn from daNUbs Project Final Report (2005).
Following the collapse of their centrally-planned economy and economic recession, nitrogen and phosphorus fertilizer consumptions reduced to 1.5 mt y-1 and 0.5 mt y-1, respectively, during 1990-1991. Fig. 2.2.1 however suggests surprisingly minor change in agricultural nitrogen emission and no change in agricultural phosphorus emission. The phosphorus emission was reduced more predominantly by the improvement of regional environmental management, the introduction of phosphorus-free detergents, the improved nutrient removals at treatment plants (daNUbs Project Final Report, 2005).
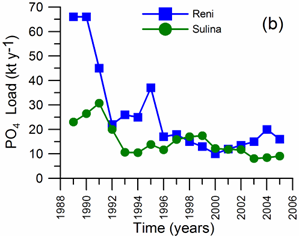
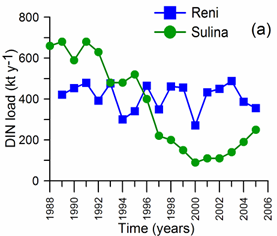
Fig. 2.2.2 Annual DIN and P-PO4 loads measured at Sulina discharge point of the River Danube to the sea and at Reni located at the upstream end of the Sulina branch.
The lack of major reduction in nitrogen emissions from the Danube catchments basin is reflected in relatively high DIN load into the sea. At Reni (located at the upstream end of the Sulina branch), it fluctuated within the range of 300-500 kt y-1 since the early 1990s (Fig. 2.2.2a) in consistent with the N-emission data (Fig. 2.2.1a). Such relatively high DIN load was explained by continuing emissions from large nitrogen stocks deposited in soils and groundwater in the catchments areas (daNUbs Project Final Report, 2005). On the basis of Reni data, a factor of three reductions is necessary to accomplish its pristine level prior to 1960 (~150 kt y-1). According to the NIMRD (National Institute of Marine Research and Development, Romania) measurements at the discharge point of Sulina branch of the River Danube, the DIN flux entering the sea tended to decrease gradually during the 1990s to ~100 kt y-1 at 2000 and increased afterwards to 250 kt y-1 in 2005 that was twice higher than its pristine level. It is hard to justify the considerable difference between two ends of the Sulina branch (~40 km), but the concomitant reduction in the interior basin subsurface nitrate peak (section 2.3) supports the Sulina data. On the other hand, both measurements reveal similar P-PO4 load between 10 and 20 kiloton yr-1 after the mid-1990s (Fig. 2.2.2b).
No systematic data sets are available to assess the current state of organic nutrient loading from the northwestern rivers. But, the BOD5 data may be used to deduce indirectly their DON loads. As inferred from Fig. 2.2.3, the total BOD5 data from the Rivers Danube and Dniester, Dniepr and Bug display a gradual decreasing trend from the peak values close to 1000 kt y-1 during 1997-1999 to ~500 kt y-1 after 2000, which implies approximately 50% reduction. The Danube contribution to the total BOD load amounts to 80%. Assuming the DON (dissolve organic nitrogen)/ BOD5 ratio ~0.3 (San Diego-Mcglone et al., 2000), the DON load into the northwestern Black Sea is estimated as 150 kt yr-1 in the present decade. The Danube contribution turns out to be approximately 130 kt yr-1, which roughly corresponds to one-third of the Reni DIN load. This is a rather conservative estimate and represents an average condition over the NWS. It may in fact be locally much higher.
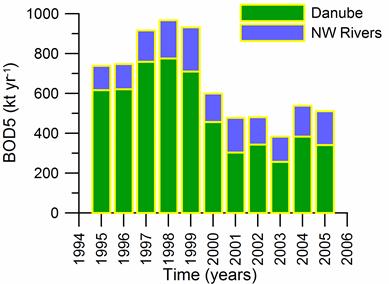
Fig. 2.2.3. BOD5 load from the Danube River and other rivers (Dniester, Dniepr and Bug) discharging into the northwestern shelf during 1995-2005.
2.3. Long-term changes in nutrient concentrations
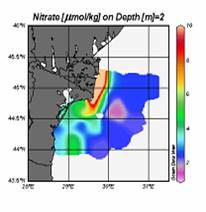
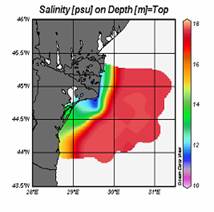
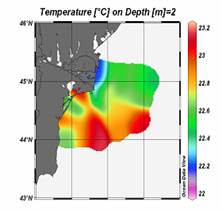
Fig. 2.3.1. Spatial distribution of surface temperature, salinity and nitrate concentration (��M) in Romanian coastal and offshore waters during September 2002 (Horstmann and Davidov, 2002).
Nutrients along the western coast acquire maximum concentrations in the Danube delta region that is characterized by relatively colder and less saline water mass and separated from offshore waters through a sharp frontal zone (Fig. 2.3.1). A predominant feature of the delta region is high rates of sediment deposition and resuspension mechanisms and rapidly changing physical conditions (in daily-to-weekly time scales) that introduce great deal of patchiness in nutrient concentrations. Almost 30-50% of nutrients supplied by the Danube is estimated to deposit near its mouth (Velikova and Cociasu, 2004) and thus does not contribute directly to the local biological production. At longer time scale (i.e. ~the last 50 years), sediment cores suggested 20% of total riverine nitrogen input accumulated in sediments of the western coastal waters, whereas denitrification eliminated 55% of the input (Teodoru et al., 2007).�� When the Danube plume extends southward, as shown in Fig. 2.3.1, low salinity and high nutrient water mass looses its character immediately to the south of the delta region and N-NO3 concentration generally decreases by more than 50% (Fig.2.3.1).
Changes in nitrogen concentration: ��Consistent with the DIN load data shown in Fig. 2.2.2a, the annual-mean DIN concentration at Sulina discharge point shows a gradual reduction from ~300 μM at 1990 to ~40 μM at 2000 and then exhibits a slight rise to ~70 μM at 2005 (Fig. 2.3.2). Albeit its large drop, recent values of DIN are still too high. The contribution of N-NH4 to DIN remained negligibly small during the 1990s, but was around 10% after 2000. On the contrary, the annual-mean DIN concentration persistently varied around 150 μM at Reni during 1997-2005 (Fig. 2.3.2).
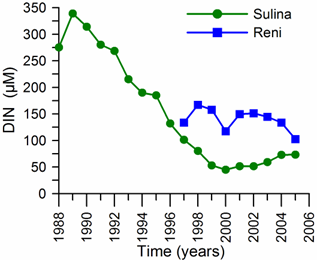
Fig. 2.3.2 Annual DIN concentration measured at Sulina discharge point of the River Danube to the sea and at Reni located at the upstream end of the Sulina branch.
As inferred by the amalgamated annual-mean surface NO3 data (Fig. 2.3.3), following an increase in the first half of the 1990s, N-NO3 concentration decreased during the second half and then started rising in the present decade. Its mean values for the previous and present decades are approximately 5 μM and 7 μM, respectively. A notably similar long-term DIN structure also took place to the north of the Danube delta. Along the western coastal waters of Ukraine, DIN concentration increased from 1 μM in the 1960s to 9 μM in the 1980s and stabilized thereafter around 7.5 μM (Fig. 2.3.4) that was similar to that in the Romanian shelf. Although the eastern coastal waters of Ukraine had relatively better conditions with lower concentrations (~4 μM in the present decade) an increasing tendency over the last two decades is evident (Fig. 2.3.4).��
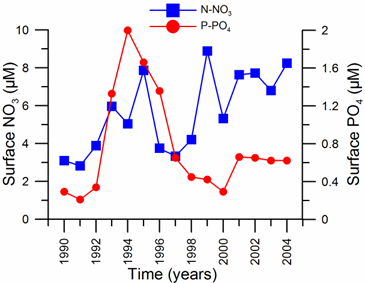
Fig. 2.3.3. Amalgamated annual-mean surface N-NO3 and P-PO4 concentration changes in Romanian waters (re-drawn from Parr et al., 2007).
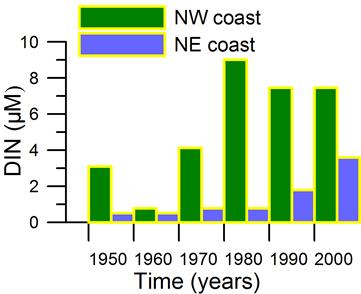
Fig. 2.3.4. Decadal variability of surface dissolved inorganic nitrogen (DIN) concentration along the western and eastern coastal waters of the NWS based on the averaging of availale data from several stations at 5-year bins (after Loveya et al., 2006).
Surface nutrient concentrations measured monthly at the coastal sampling station near Constanta constitute the most comprehensive long-term data set to monitor their multi-decadal changes along the western coastal waters. Following a major reduction during the second half of the 1970s, N-NO3 and N-NH4 concentrations fluctuated within 5-10 μM during the 1980s and 1990s except a rising trend in 2004-2005 (Fig. 2.3.5). The decadal-mean N-NO3 concentration reduced from 6.90 μM in the 1980s to 5.90 μM in the 1990s and then elevated to ~8 μM during 2000-2005 (Table 2.3.1). N-NH4 concentration experienced an opposite trend and increased roughly 2.0 μM from the 1980s to the 1990s and then reduced by 1.0 μM during the present decade (Table 2.3.1). N-NO2 concentration always remained around 1 μM and constituted only 6% of the total DIN. In general, the DIN possessed a slight rising trend from 12 μM in the 1980s to 13 μM in the 1990s and 14 μM in the 2000s (Table 2.3.1). This trend is consistent with the Sulina data (Fig. 2.2.2a) although the values are four-fold lower.
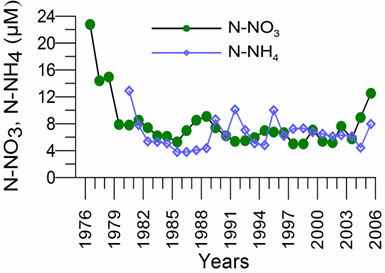
Fig. 2.3.5. Annual-mean surface concentrations of N-NO3 (green) and N-NH4 (blue) at Constanta station (A. Cociasu, per. com).
Table 2.3.1. Multi-annual mean surface nutrient concentrations (μM) in Constanta (after Velikova and Cociasu, 2004)
| Period | 1959-65 | 1983-90 | 1991-00 | 2001-05 |
| N-NO3 | 1.60 | 6.90 | 5.90 | 7.98 |
| N-NH4 | - | 5.11 | 7.06 | 6.12 |
| P-PO4 | 0.26 | 6.54 | 1.86 | 0.49 |
| SiO4 | 40.5 | 11.0 | 12.6 | 13.7 |
According to the monthly surface NO3 and N-NH4 concentration variations at Constanta during 2000-2006 (Fig. 2.3.5), the period 2000-2004 was characterized by a major N-NO3 peak during April or April-May that coincides with the highest discharge period of the Danube. N-NO3 concentration then decreased linearly up to September and then started increasing linearly up to next April. As an exception, a second and stronger peak appeared during the 2003 severe winter (January-February). This annual structure changed appreciably during 2005-2006 in terms of an extended spring peak to July and reduction in N-NO3 concentration by September up to a minimum in November; thus the minimum N-NO3 concentration phase shifted from August to November.�� Moreover, NO3 concentrations from 2000 to 2006 indicated approximately 5 μM linear trend of increase. NH4 concentration attained higher values predominantly in summer months.
Considerable interannual and local variabilities are also noted along the northwestern coastal waters (Fig. 2.3.7). N-NO3 and N-NH4 concentrations were exceptionally high (60-90 μM) near the waste water treatment plant sites Pivnichi and Pivdenna during 2003-2006 contrary to their much lower values during 2000-2002.�� N-NO3 concentrations in the Odessa, Uzhnyi, and Ilichevsk ports were typically around 10-20 μM.
Measurements along the Romanian and Bulgarian coastal waters to the south of the Danube delta revealed comparable N-NO3 and N-NH4 concentrations with the Ukrainian coastal waters. N-NO3 concentrations at Mamaia beach and two adjacent offshore stations along 5m and 20 m isobaths indicate uniformity of the Danube plume within 20 m isobath zone (Fig.2.3.8a).�� The features such as the April-May N-NO3 peak within 10-20 μM range and relatively high spring concentrations during 2002 and 2005 resemble those observed at Constanta station (Fig.2.3.6).
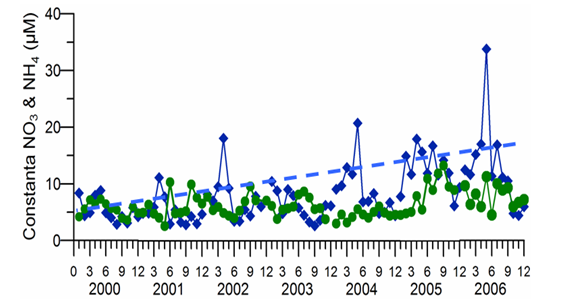
Fig. 2.3.6. Monthly changes of surface NO3 (squares) and NH4 (dots) concentrations and the trend of NO3 concentration at Constanta monitoring station during 2000-2006.
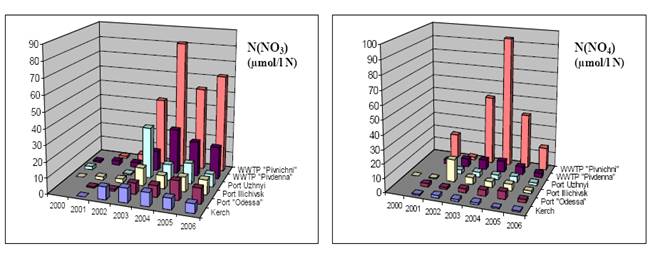
Fig. 2.3.7. Annual-mean N-NO3 (left) and N-NH4 (right) concentrations (μM) at various sites along northwestern Ukrainian waters during 2000-2006 (After PMA AG and AC Activities and Reporting, 2007).
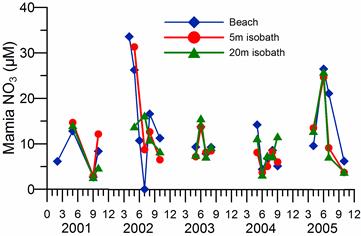
Fig. 2.3.8a. Monthly changes of surface NO3 concentration at the Mamia beach and 5 m and 20 m isobaths further offshore during 2000-2005.
Further south along the southern Bulgarian coast, N-NO3 and N-NH4 at stations near Ahtopol and Bourgas Bay reveal concentrations as high as 20 μM in summer months that are comparable with their winter values (Fig. 2.3.8b,c). Their annual structure was therefore somewhat different than Constanta station, and likely signifies contribution from local sources in addition to the Danube upstream influence.
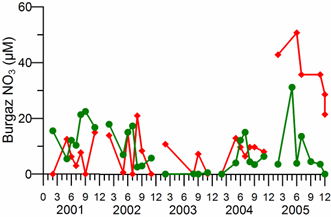
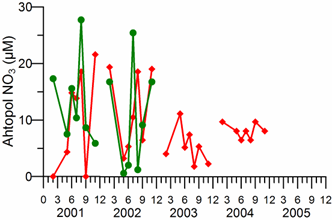
Fig.2.3.8b,c. Monthly changes of surface NO3 and NH4 concentrations at Ahtopol and Burgaz monitoring stations during 2000-2005.
More dense and regular measurements in the Bosporus exit section during 1996-2003 possessed an order of magnitude lower N-NO3 concentration (Fig. 2.3.8d). More importantly, they revealed a typical open-sea type annual structure with an N-NO3 peak during winter due to enhanced vertical mixing, and N-NO3 depletion in summer due to its uptake in phytoplankton production. An additional spring (April-May) peak exists during high Danube discharge years, reflecting efficiency of southward coastal transport. Opposite to the Bourgas Bay and Ahtopol, in the Bosporus section the summer N-NO3 concentration was low due to its intense uptake in phytoplankton production.��
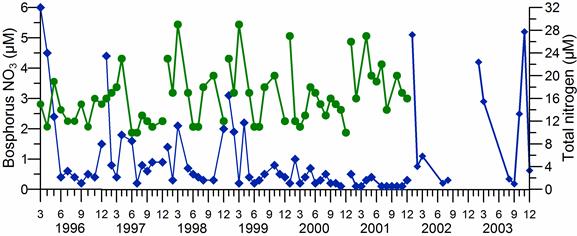
Fig.2.2.8d.�� Monthly surface NO3 concentration (blue) and total nitrogen (organic + inorganic) ��concentration (green) (μM) at the Bosphorus northern entrance during 1996-2003 (redrawn after Okus, 2005).
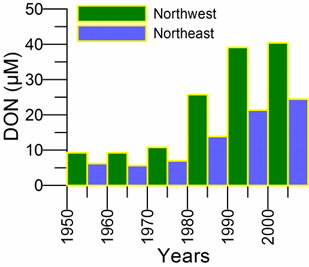
Figure 2.2.9. Decadal variability of surface dissolved organic nitrogen (DON) concentration along the western and eastern coastal waters of the NWS based on the averaging of availale data from several stations at 5-year bins.
As inferred from the BOD5 data (Fig. 2.1.3), the western Black Sea coastal waters seem to continue receiving considerable anthropogenic-based organic nitrogen. An estimate of 130 kt y-1 DON load inferred earlier from the Danube BOD5 data implies ~30 μM DON concentration supplied by the River Danube during the present decade that is comparable to ~40 μM in the northwestern coastal waters (Fig. 2.2.9) due to continuous supply of high DON load from Dniepr, Dniestr and Bug Rivers as evident by a steady increase of its concentration since the 1970s. Similarly, the annual- and regional-average dissolved organic nitrogen concentration of ~10 μM was observed along the Bulgarian coastal waters during 2001-2003 (Table 2.2.2).�� In addition, more than 10 μM difference between total nitrogen and N-NO3 concentrations in the Bosporus exit station during the peak Danube discharge period (March-May) throughout 1996-2001 (Fig. 2.2.8d) provides a further support for organic nitrogen enrichment all along the western coastal waters.
Table 2.3.2. Annual and regional-mean concentrations of phosphorus and nitrogen species in Bulgarian coastal waters during 2001-2003. TP, TN and ON refer to total phosphorus, total nitrogen and organic nitrogen, respectively. All values are expressed in μM (after Velikova and Cociasu, 2004).
| Years���� | P-PO4 | TP | ON | TN |
| 2001 | 0.27 | 0.45 | 10.29 | 12.40 |
| 2002 | 0.18 | 0.44 | 5.46 | 8.35 |
| 2003 | 0.23 | 0.42 | 10.98 | 14.87 |
On the basis of available data for 2000-2005, Fig. 2.3.10 summarizes the current status of the nitrogen enrichment along the periphery of the basin using different color codes for different ranges of annual-mean N-NO3 concentration. According to this classification, the threshold for the highest N-NO3 concentration in western coastal waters were set to 2.8 ��M that in reality was far more higher and easily exceeded 10 ��M as documented above. The entire southern coast is identified by the second highest N-NO3 concentration that covers the range between 1.4 ��M and 2.8 ��M. A small number of sites offshore of the Turkish/Georgian border show high levels of enrichment, which are likely to be the result of local discharges from mining industry. Northeastern and Crimean coastal waters are less eutrophic and characterized by N-NO3 concentration less than 1.4 ��M. It is however important to note that, for southern and northeastern coastal waters, this classification scheme was based on rather limited measurements, such as twice a year (April and October) sampling during only 2004 and 2005 along the southern coast. Fig. 2.3.10 therefore should be interpreted with some caution. More frequent sampling strategy is highly desirable for more reliable coverage of the annual range of variations.
The surface productive zone of the interior basin has been nitrate limited even during the intense eutrophication phase (Oguz, 2005), and therefore the change of peak N-NO3 concentration in the nitracline layer (see Chapter 1) is an important indicator for monitoring basin-scale response of eutrophication. The change in subsurface nitrate maximum concentration (Fig. 2.3.11) from ~2-3 ��M during the pristine state to 7-9 during the intense eutrophication period (i.e. the 1980s) confirms devastating effect of eutrophication for the entire sea that persisted up to 1992. Afterwards, the interior basin responded to the decline in the anthropogenic DIN load by reducing the peak subsurface nitrate concentration below 6 ��M after the 1990s. The present value of this peak varies around 4.0-5.0 ��M and thus implies a gradual shift of the system towards low nutrient conditions. As the nitrogen (both organic and inorganic) load supplied by the northwestern rivers was decreasing according to the Sulina measurements, primary production in the interior basin at present appears to consume nutrients which have already accumulated within during the intense eutrophication phase.��
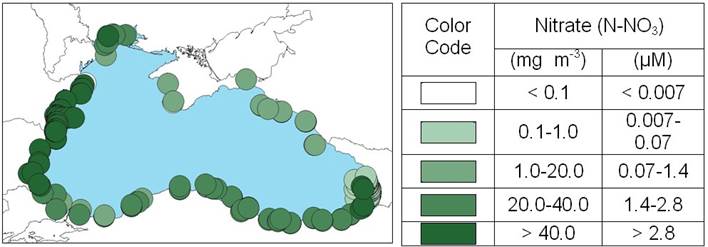
Figure 2.3.10. Ranges of mean nitrate (NO3-N) concentrations during 2000-2005 in surface waters (0-10 m) along the coast of the Black Sea (modified from TDA Report, 2007).
Changes in phosphorus concentration: P-PO4 concentration in the Sulina discharge point experienced an abrupt reduction from 7.5 μM at 1990 to 2.5 μM at 1993. It fluctuated afterwards between 2 μM and 3 μM, whereas it was changing between 1.0 and 2.0 μM at Reni (Fig. 2.2.12).
Along the northwestern coastal waters, it increased to around 3 ��M in the mid-1970s and retained this level for a decade (Fig. 2.3.13a) reflecting upstream influence of the Danube in addition to local contributions from hot spots and discharges from Dniepr, Dniestr and Bug Rivers. This level was maintained until 2005 even though it locally acquired order of magnitude higher values during 2004-2005 (Fig. 2.3.13b). Long-term P-PO4 data at Constanta monitoring station (Fig. 2.3.14) indicate two major peaks (~10-12) ��M at 1975 and 1987 and minima (~2 ��M) at 1981 and 1992 following its background values of <1 ��M during the 1960s (the mean value = 0.26 ��M). The decadal-mean P-PO4 concentration was highest (~6.0 μM) during the 1980s and decreased to values less than 1.0 ��M during 1990-1992 with a mean value of 0.49 ��M for 1993-2005 (Table 2.3.1). The Constanta data is however biased due to the strong impact of the land-based source from the Navodari Factory and thus may not be representative for all the Romanian coastal waters. Further reduction to the mean value of ~0.2 ��M is noted along the Bulgarian coast (Table 2.3.2) and northeastern coastal waters (Fig. 2.3.15).
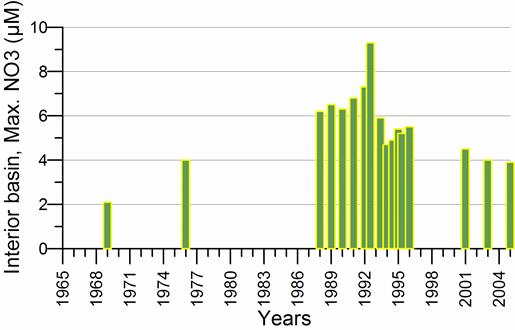
Fig. 2.3.11. Temporal variations of the subsurface peak nitrate concentration within the interior basin computed by averaging of all available data (after Konovalov and Murray, 2001, modified with the recent data by T. Oguz).
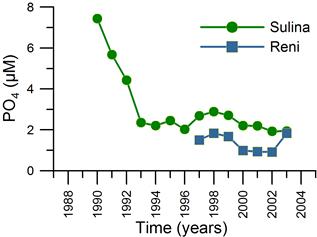
Fig. 2.3.12. Annual-mean P-PO4 concent-ration measured at Sulina discharge point of the River Danube to the sea and at Reni located at the upstream end of the Sulina branch.
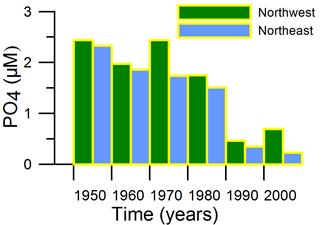
Fig. 2.3.13a. Decadal variability of surface phosphate (P-PO4) concentration along the western and eastern coastal waters of the NWS based on the averaging of available data from several stations (redrawn from Loveya et al., 2006).
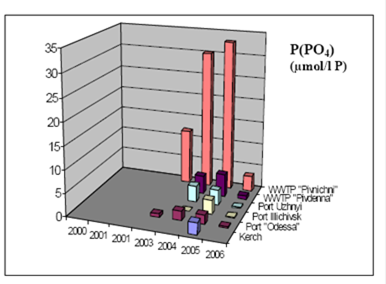
Fig. 2.3.13b. Annual-mean P-PO4 concentration (μM) at various sites of northwestern Ukrainian coastal waters during 2000-2006 (After PMA AG and AC Activities and Reporting, 2007).
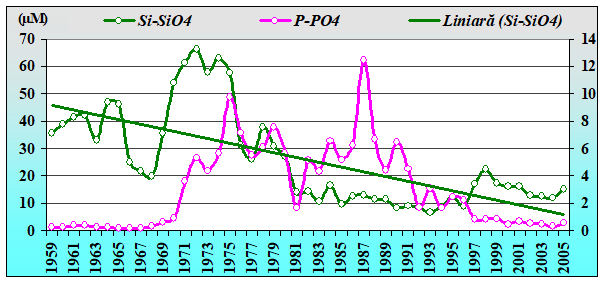
Fig. 2.3.14. Annual-mean surface concentrations of PO4 (right hand side axis) and SiO4 (left hand side axis) at Constanta station.
According to the colour-coded classification scheme (Fig. 2.3.16), the western coastal waters are classified as highest phosphate levels (>0.39 ��M). A comparable level of elevated phosphate concentrations was assigned in Fig.2.3.16 for the Russian coast along the opposite side of the sea, but it disagrees with lower values shown in Fig. 2.3.15. The Turkish coast is characterized by relatively low P-PO4 concentration albeit isolated sites of higher contamination exist presumably due to local industrial discharges.
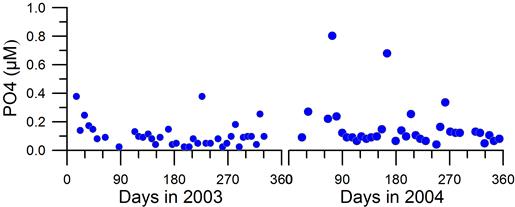
Fig. 2.3.15. Surface concentrations of P-PO4 in near-shore waters of the Gelendzhik area during 2003-2004 (redrawn from Kucheruk, 2005).
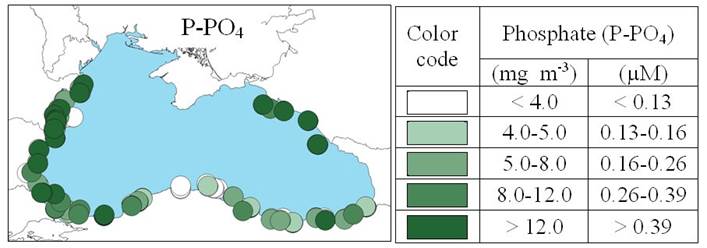
Fig. 2.3.16. Ranges of mean concentrations of phosphate (P-PO4) during 2000-2005 in surface waters (0-10m) along the coast of the Black Sea (After TDA Report, 2007).
The annual-mean surface silicate concentration (SiO4) measured at Constanta monitoring station prior to 1970s was quite high with an average value of 40 μM and reached at 65 μM at 1975 (Fig. 2.3.14). Following the construction of Iron Gate I during the early-1970s, it started reducing to around 10-20 μM within the second half of 1970s due to the retention mechanism in the upper reaches of the River Danube. The declining trend since the 1980s was disrupted by an abrupt increase from 10 μM in 1996 to 22 μM in 1998 and then declining trend continued up to 11.0 μM in 2004 except a minor increase to 13.7 μM in 2005.
Changes in nutrient ratios: Owing to relatively high DIN emissions, the River Danube has always been a phosphorus limited system and supplied DIN at much higher rate with respect to P-PO4. The P-limitation is evident at the Sulina discharge point where N/P ratio remained above its Redfield ratio even though both N-NO3 and P-PO4 concentrations tended to decrease since 1990 and P-limitation becomes weaker than the previous decades (Fig. 2.3.17a). The increasing trend during 1990-1993 reflects much faster decline of P-PO4 concentration (Fig. 2.3.12), whereas the gradual decline during 1993-1999 and increase afterwards are largely controlled by the variations of N-NO3 concentration (Fig. 2.3.2) as P-PO4 concentrations remained rather steady after 1993. The data at Constanta monitoring station also support the P-limitation at an increasing rate after 1997 as compared to the N-limitation before (Fig. 2.3.18a). On the contrary, the amalgamated data (Fig. 2.3.17a) indicate preferentially N-limitation for the Romanian shelf waters. The data shown in Table 2.3.3 also support N-limitation for the 1980s and 1990s but not for the 2000-2003 period for which the N/P ratio value of 32 contradicts with a value of ~12 suggested by the amalgamated data. The difference seems to arise due to the bias of the data given in Table 2.2.3 by the Constanta N/P data (Fig. 2.3.18a) that showed P-limitation after 1999.
 |
 |
����������
Fig. 2.3.17. Long-term changes of nutrient concentration ratios at (a) Sulina discharge point, Romanian shelf and Bosphorus exit region, and (b) Ukranian coastal waters.
The N-limitation also applies for both the northwestern and northeastern Ukrainian coastal waters (Fig. 2.3.17b and Table 2.3.3) as well as the Bosporus exit section (Fig. 2.3.17a), except for 2003 that was based on an average of only two measurements; one below the Redfield ratio and the other above and therefore the 2003 value of N/P ratio is not statistically significant. It is hard to identify precisely the type of nutrient limitation for Bulgarian waters because of the absence of systematic and sufficiently long time series for all major nutrients. On the basis of available data summarized in Table 2.3.3, Bulgarian coastal waters appear to be P-limited during winter months due to their excessive nitrogen enrichment (Fig. 2.3.8b,c, 2.3.18b), while they attained either N-limitation or Redfield value the rest of the year (Fig. 2.3.18b). Bulgarian waters therefore switch seasonally between P- and N-limitation (Velikova and Cociasu, 2004). The seasonal alternation does not show a regular seasonal pattern, but varies interannually. On the basis of all these evidences, it appears that inner shelf along the western coast is currently P-limited (Fig. 2.3.18a) whereas the outer shelf is either weakly N- or P-limited (Fig. 2.3.17), and the interior basin is predominantly N-limited (Fig. 2.3.19a).
The long-term variation of Si/N ratio at Constanta (Fig. 2.3.18a) since 1980 falls into three phases. The first phase (1980-1988) was characterized by the monthly Si/N values varying between 0.5-1.5.�� In the second phase (1989-1997), Si/N values reduced to the range 0.4-1.2. The third phase (1998-2005) resembled the first phase with the values changing between 0.6 and 2.0.�� In general, Si/N ratio remained below 2.0 and favored Si limitation in the Constanta region. Because of the lack of comprehensive data coverage, it is not clear how well the Si limitation applies to other regions along the western coast. Because the deep interior basin is more severely limited by nitrogen,�� Si/N values are much higher than its threshold for Si limitation (Fig. 2.3.19b).
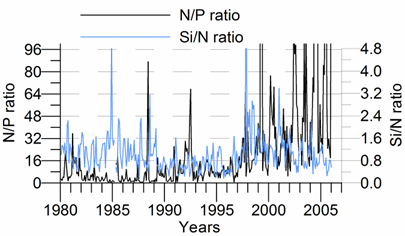
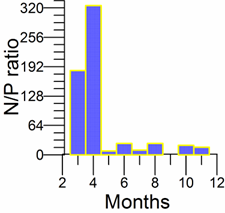
Fig. 2.3.18. Long-term changes of nutrient concentration ratios at (a) Constanta monitoring station, and (b) monthly changes in Bulgarian coastal waters during 2001-2003.
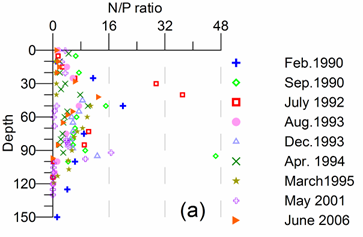
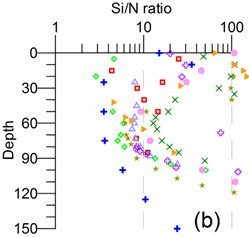
Fig. 2.3.19. Vertical profiles of N/P and Si/N ratios at different locations of the interior basin during different months and years.
Atmospheric input of nutrients: In addition to nutrient inputs from rivers, coastal sources and sediments, atmospheric wet and dry depositions may likely constitute an important component of the long-term nutrient enrichment of the Black Sea that however remains to be poorly studied. According to the State of Environment Report (2000), the atmospheric nutrient input onto the Black Sea surface was about 400 kt y-1, and therefore higher than the present level of riverine supply.
Within the framework of BSERP/GEF monitoring program, atmospheric precipitation was sampled at a remote site Katsively near Sevastopol-Crimea during 2004-2005 (Chaykina et al., 2005). They measured the total DIN wet deposition as 550 mg m-2 during March-December 2004 and 910 mg m-2 during 2005 that amounts to atmospheric fluxes of 240 kt y-1 and ��400 kt y-1, respectively, if extrapolated over the surface area of the Black Sea. Similar measurement at Zmeiny Island at 40 km offshore from Odessa during 2003-2007 indicated approximately 240 ktons y-1 nitrogen and 16 ktons y-1 of phosphorus fluxes from the atmosphere (Medinets and Medinets, 2008). Atmospheric deposition of nutrients is therefore comparable to the current loads from the River Danube and therefore appears to constitute an important element of the overall nitrogen budget of the sea.
Table 2.3.3. Multi-annual mean nutrient ratios in Romanian surface coastal waters, the Bay of Varna and Bulgarian coastal waters (BW) as an average of all measurements within the 50 km zone (after Velikova and Cociasu, 2004)
| Romania | Bulgaria | Ukraine | ||||||
| Period | 1960-1970 | 1980-1991 | 1992-1999 | 2001-2005 | 2001-03 | 2000-05 | ||
| BW | Varna Bay | NWcoast | NECoast | |||||
| Si / P | 142.9 | 2.6 | 11.2 | 30.6 | 34.4 | 88.4 | - | - |
| Si / N | - | 0.9 | 0.9 | 1.2 | 9.0 | 7.0 | - | - |
| N / P | - | 3.1 | 10.2 | 32.0 | 55.2 | 31.0 | 10.7 | 15.7 |
2.4. Surface chlorophyll concentration
Few long-term data exist on in situ chlorophyll-a measurements in the Black Sea and therefore remote sensing ocean color data are used to infer its seasonal-to-interannual variations, even though chlorophyll signal is likely deteriorated by rich particulate material and dissolved organic substance along the western coastal waters. The average chlorophyll concentrations are computed from 9 km gridded, 8-daily SeaWiFS products for the northwestern (Ukrainian) coastal waters (the region 1), the Romanian and Bulgarian coastal waters (the regions 2 and 3), the Bosporus-Black Sea junction region (the region 4), and the western interior basin (the region 5) (Fig. 2.4.1). The Danube delta region between the regions 1 and 2 is not included into the analysis because of its unrealistically high chlorophyll concentrations (≥ 20 mg m-3), most of which possibly reflect contributions from yellow substance and particulate matter discharged by the Danube.�� The analysis of the data is depicted in Fig. 2.4.2.
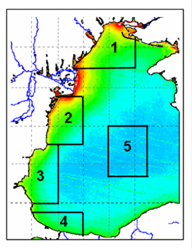
Fig. 2.4.1. The regions of the western basin used for the analysis of SeaWiFS chlorophyll concentration variations.
An immediate feature noted in Fig. 2.4.2 is approximately four-fold decrease in chlorophyll concentration from the northwestern shelf (region 1) to the Bosporus-Black Sea junction zone (region 4). In the region 1, highest concentrations extend from early spring to late autumn in the range of 6-8 mg m-3. Lowest concentrations are observed in winter months and often exceed those in further south. The region 2 possesses three peaks; the first one comprises the late winter-early spring (February-March) and arises due to typical spring bloom dynamics. This is the weakest peak (~3 mg m-3). It is followed by a stronger late-spring peak (in May-June with ~5��1 mg m-3) that evidently coincides with the period of high Danube discharge. For some years (i.e. 2006), these two peaks are combined to form one extended peak. The third one occurs in autumn (~4��1 mg ��m-3) and is often separated from the former one by a period of relatively low summer concentrations of ~2 mg m-3. The measurements in Constanta monitoring station during 2001-2005 (Fig. 2.4.3) generally support these features with some differences such as a strong early autumn (September) bloom in 2002, a late winter (February-March) bloom in 2003, and a late autumn bloom (November) in 2004. The Bulgarian and the Bosporus regions also possess three-peaks between 2 mg m-3 and 4 mg m-3 with considerable year-to-year changes whereas the lowest concentrations in summer months are about 0.5 mg m-3.
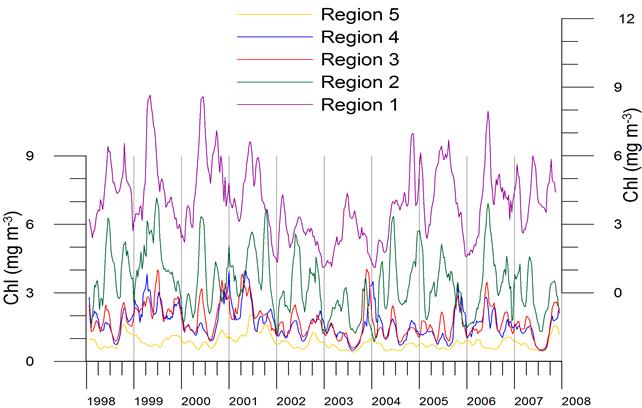
Fig. 2.4.2. Average surface chlorophyll concentration for five regions of the western Black Sea basin obtained from 8-daily 9 km resolution SeaWiFS ocean colour products after the original data is smoothed by 5 point moving average. The axis on the right hand side applies for the region 1, and the axis on the left hand side for all other regions.
The long-term monthly measurements at the Bosporus exit section during 1996-2001 (Fig. 2.4.4) generally support the ocean colour data both in terms of timing and magnitude. The most pronounced features are the late winter and autumn peaks that are connected with low summer chlorophyll concentrations. The measurements in Bourgas Bay during 1987-1997 (Fig. 2.4.4) that comprises the period before the availability of satellite ocean color data suggest somewhat different seasonal chlorophyll concentration structure; the late winter-spring peak emerges the most dominant feature at either moderate (~4-5 mg m-3 ) or high (>8 mg m-3) concentrations and is followed by a secondary peak during summer months. No appreciable chlorophyll peak however existed during autumn months.�� This annual structure persisted during 1987-1995 period, after which the annual structure seems to shift to the structure described for the region 4 with higher intensity of autumn concentrations.
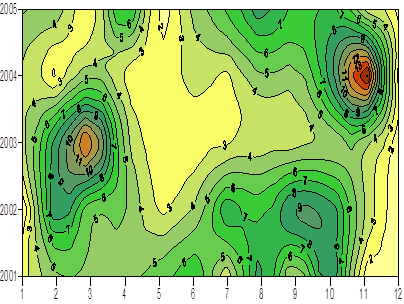
Fig. 2.4.3. Monthly surface chlorophyll concentration variations (mg m-3) at Constanta station during 2001-2005.


Fig. 2.4.4. Monthly surface chlorophyll concentration during 1987-2001 measured in the Burgaz Bay (red dots) and the Bosphorus northern exit (green squares), and the SeaWiFS ocean color data for the region 4 (bold lines). The dashed line shows decreasing trend of peak Chl concentration since the 1980s. The field data are provided by Hibaum (2005); Moncheva (2005) and Okus (2005) and satellite data by daily-8, 9 km resolution SeaWiFS ocean colour product.
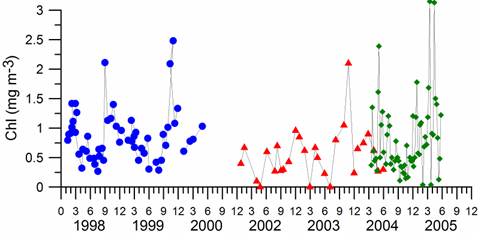
Fig. 2.4.5. Surface chlorophyll-a concentration measured along the Crimean topographic slope zone (dots; after Churiliova et al., 2005), near the Cape Sinop at the central part of the southern coast (triangles; after Feyzioglu, 2006; Bat et al., 2007), and Surmene Bay near the southeastern corner of the sea (squares; after Feyzioglu, 2006).
On the other hand, measurements at two coastal stations along the southern coast and along the topographic slope zone to the south of Crimea (Fig. 2.4.5) show peak concentrations in the range of 1.0-2.0 mg m-3 during February-March and November-December that are comparable to minimum concentrations measured at Bourgas and Bosporus stations. The lowest concentrations which are generally observed during the summer were typically less than 0.5 mg m-3.
The surface chlorophyll concentration variations within the central part of the western basin (region 5) vary within 0.5 - 2.0 mg m-3 (Fig. 2.4.2). The most notable feature that repeats almost every year is a linear decreasing trend from a peak in November (1.5 - 2.0 mg m-3) to a minimum (~0.5 mg m-3) in July followed by a sharp increase from August to November again. This annual structure differs from the western coastal waters (the regions 1-to-4) by the absence of additional spring peak due to the Danube nutrient supply. The only exception is the anomalously high concentrations in summer 2001 as also supported by direct measurements (Oguz and Ediger, 2007).
The long-term data using all available direct measurements within the interior basin (> 1500 m) for the summer-autumn period (May-November) reveal surface chlorophyll values less than 0.6 mg m-3 during 1978-1987 followed by the phase of high concentrations up to about 2.0 mg m-3 during 1989-1992 during the anchovy collapse and Mnemiopsis population outburst period (i.e. the changes in top-down control) (Fig. 2.4.6). There is no sufficient data coverage to assess chlorophyll variations during the mid-1990s even though values up to 1.0 mg m-3 were measured during 1998-1999. The SeaWiFS summer (May-September) data for more recent period (averaged over the rectangular region defined by 31-41oE and 41.5-44oN) reveal two distinct phases: high summer chlorophyll concentrations (~1.4 mg m-3) during 1998-2001 and the subsequent moderate chlorophyll concentrations (~0.8 mg m-3) afterwards.����
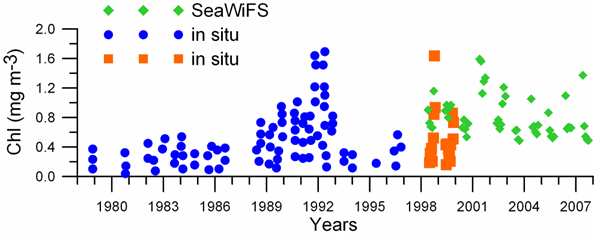
Fig. 2.4.6. Long-term changes of surface chl-a concentrations in the interior Black Sea (depth >1500m) for May-November period, 1978-1999. Each data point represents a single measurement taken from Yunev et al. (2002) (blue symbols) and Churilova et al (2004) (red symbols). This data set is complemented by the monthly-average 9 km gridded May to September-mean SeaWiFS data for the interior basin defined by 31-41oE longitudes and 41.5-44oN latitutes (green symbols).
The annual-mean chlorophyll concentrations deduced from the satellite ocean color data do not indicate appreciable interannual variability for the regions 3, 4 and 5 (Fig. 2.4.7), but attained relatively low values during 2003 in regions 1 and 2 due possibly to the anomalous cold winter (Chapter 1). The decrease in annual-mean concentrations from north-to-south and from 1998 to 2007 is also noted in Fig. 2.4.7.
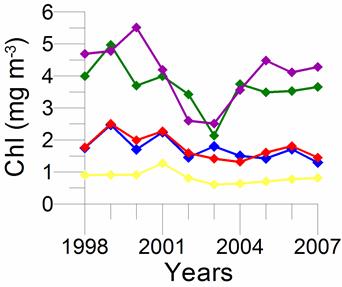
Fig. 2.4.7. Annual-mean surface chlorophyll concentration for five regions of the western Black Sea basin obtained from 8-daily 9 km resolution SeaWiFS ocean colour product. The colour code for the regions are as shown in Fig.2.4.2.
The surface chlorophyll maps presented in Fig. 2.4.8 provide the monthly average distributions for 2001, 2003 and 2005 that were chosen to represent examples for highly, weakly, and moderately productive years, respectively. Throughout these years, the northwestern part of the Black Sea possess highest chlorophyll concentrations (>10 mg m-3) especially in summer months. This over-productive zone weakens gradually southward along the Bulgarian and Turkish coastal waters that are characterized by the values around 2-4 mg m-3. The Danube effect is most often visible up to the Bosporus coastal region, and its signature gradually weakens further eastward along the Anatolian coast. Some localized moderately productive zones are occasionally observed along the south-eastern and eastern coasts. The northern coastal zone was identified by lowest concentrations. The Rim Current system forms a barrier between coastal and interior waters during winter and spring periods when it is relatively strong, but more efficiently distributes chlorophyll between coastal and interior waters during summer and autumn when it is weakly stable and prone to mesoscale instabilities.
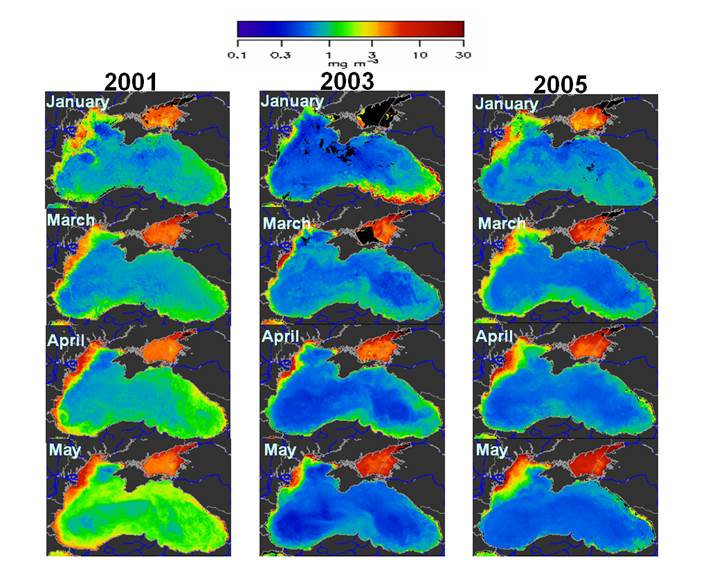
Fig. 2.4.8. Monthly composites of surface chlorophyll concentration derived from daily-2km resolution SeaWiFS (NASA) ocean colour products for 2001, 2003 and 2005 (EC-Joint Research Centre, Global Environment Monitoring Unit Ocean Colour Archive, http://oceancolour.jrc.ec.europa.eu/).
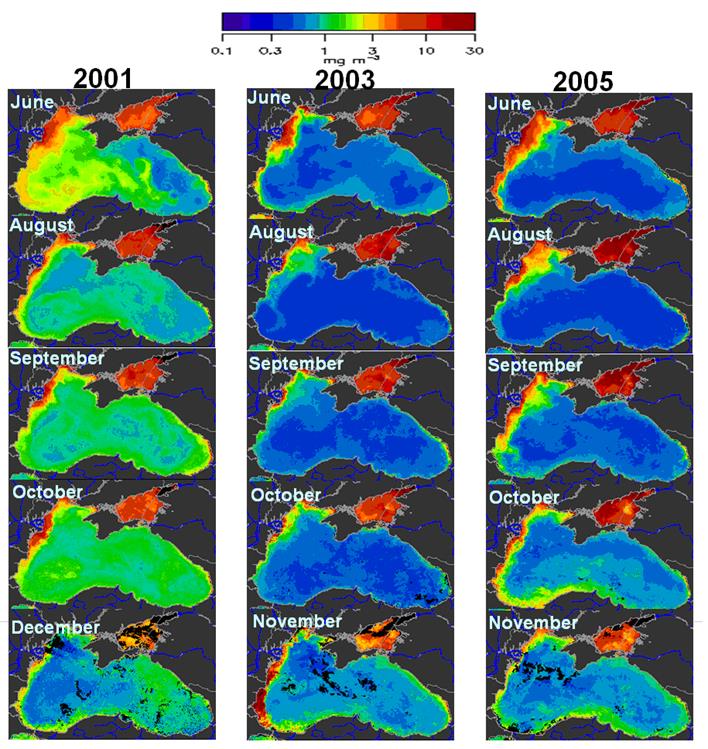
Fig. 2.4.8. (continued) Monthly composits of surface chlorophyll concentration derived from daily -2km resolution SeaWiFS (NASA) ocean colour products for 2001, 2003 and 2005 (EC-Joint Research Centre, Global Environment Monitoring Unit Ocean Colour Archive, http://oceancolour.jrc.ec.europa.eu/).
2.5. Surface and near-bottom oxygen concentrations
Northwestern shelf: Following the first sight of hypoxia (oxygen concentrations below 2 mg/l, or oxygen concentration less than 30% saturation value) in the coastal zone between Dnestr and Danube delta in August 1973, zones of seasonally low oxygen have been detected in the bottom waters of the northwestern shelf, most commonly within 30-40 mile zone along its north and west coasts; i.e. in the discharge regions of the northwestern rivers. Hypoxia development typically started in June-July, stretched towards offshore up to the depths of 20-30 m and attained its maximum coverage in August. In October, it largely retreated except in close vicinity of the Danube discharge region and near Odessa. According to the long-term observations (Loyeva et al., 2006), the largest hypoxia coverage (about one-third of the NWS area or more) was observed in the years 1978, 1983, 1989, 1990, 1999 and 2000, among which the 1983 event covered 52% of the NWS total area (Fig. 2.5.1). A similar analysis by Zaitsev (1992) reported almost twice larger spatial coverage for the 1970s and 1980s. It was reported to decrease in Romanian coastal waters and no hypoxia case was observed in Bulgarian waters in 2001-2005, where lower oxygen concentrations tended to occur more predominantly in the northern sector (Parr et al., 2005).
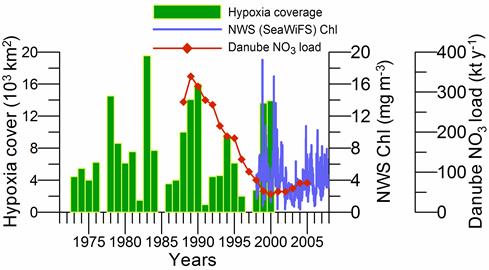
Fig. 2.5.1. Long-term variations of spatial coverage of hypoxia in the northwestern shelf (redrawn from Loyeva et al., 2006), average chlorophyll concentration (mg m-3) for the northern part of the NWS provided by daily-8 km SeaWiFS ocean color sensor�� and the River Danube N-NO3 discharge.
Berlinskii (1989; 2003) proposed a linear empirical relationship between the rate and timing of river discharge and the scale of hypoxic conditions. In years with high river discharge and hence high nutrient input and organic matter production, the oxygen concentration in bottom layers becomes ~20% lower in comparison with years of low river discharge. Frequency of hypoxic conditions in front of the Danube river mouth was found to decrease when roughly half of the fresh water discharge took place before the first half of April whereas the maximum river input in April-May favoured oxygen depletion later in June-October. Loyeva et al. (2006) suggested a close correlation (r=0,86) between spatial coverage of brackish water with salinity less than 17.5 psu and the area of near bottom hypoxia. The data shown in Fig. 2.5.1, however, suggest no clear correlation of the extent of hypoxia with neither Danube fresh water discharge nor NO3 load, but it seems to correlate with the SeaWiFS chlorophyll concentration during 1998-2000 for the northern part of the NWS. In fact, hypoxia development depends not only the intensity of eutrophication but also circulation, stratification and meteorological (wind, heat flux, etc.) conditions and therefore may be subject to large year-to-year variations and a simple correlation to environmental factors may not always hold. Its sensitivity to different number of hydro-meteorological and biogeochemical factors complicates estimation of its spatial coverage by proxy data and therefore limits the use of such indirect approach as a reliable indicator of eutrophication. Fig. 2.5.1 does not indeed show stable tendency of increase or decrease in hypoxia coverage in the northwestern Black Sea.
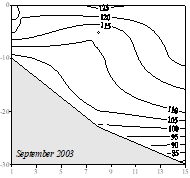
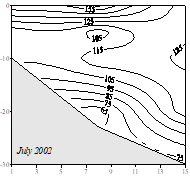
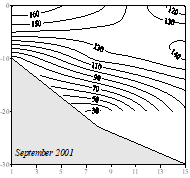
Fig. 2.5.2. Vertical distribution of oxygen saturation ratio along the Sulina transect during September 2001 and 2003, July 2002 (after Velikova and Cociasu, 2004).
Vertical distribution of oxygen saturation ratio along the Sulina transect exhibited oxygen depletion in summers 2001 and 2002 following relatively warm winters whereas bottom waters in the summer 2003 after the cold winter did not show any significant depletion (Fig. 2.5.2).
Long-term surface oxygen measurements in Constanta (Fig. 2.5.3) suggest persistently low concentrations (between 200-250 ��M) from the late-May to the end of September during the 1980s and the 1990s. The recovery in oxygen status in surface waters is evident after 2000 which are further supported by benthic data (e.g. mussel bed and community age class distributions) in the following chapters.

Interior basin: Modification in sub-surface oxygen structure of the
interior basin in the 1980s due to considerable increase in organic matter
production has been monitored by long-term changes in the thickness of the
suboxic layer (Orlova et al., 1999; Konovalov et al., 2001). This layer is
defined in Fig. 2.5.4 by the sigma-t surfaces of 20 μM oxygen and 5
μM hydrogen sulphide concentrations and has been constructed using all
available data from the interior basin since the 1960s. It is located at depths
away from the direct impact of atmospheric ventilation and its temporal changes
mainly reflect the changes due to biochemical processes. Its thickness had a
relatively stable structure with a mean value of 20 m or equivalently
Δσt~0.4 kg m-3 up to the late 1970s. It was
then broadened to ~40 m (Δσt ≥ 0.55 kg m-3)
during the 1980s and preserved this structure until the early-1990s due to
higher rate of oxygen consumption associated with intensified biological
production. This period was followed by a decline of the thickness to
Δσt~0.35 kg m-3 during the mid-190s after
which the data from 2001 and 2003 indicated further broadening due to intense
phytoplankton bloom events.
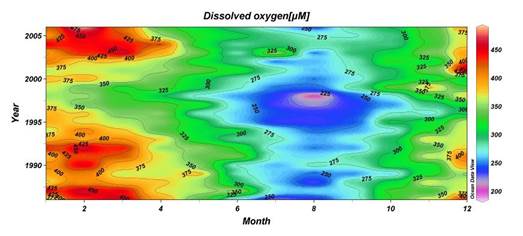
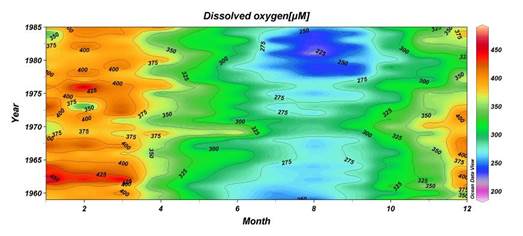
Fig. 2.5.3. Temporal variations of surface dissolved oxygen concentration in Constanta since the 1960s.
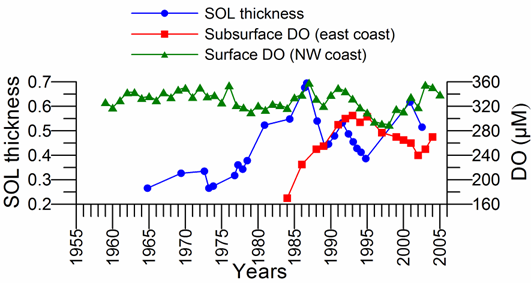
Fig. 2.5.4.�� SOL thickness measured as the difference between the sigma-t surfaces of 20 ��M dissolved oxygen and 5 ��M hydrogen sulphide concentrations deduced by all available data from the deep interior basin (after Konovalov et al., 2005), average dissolved oxygen concentration within the layer of σt ~14.45 and 14.6 kg m-3 surfaces in the region off the eastern coast (after Yakushev et al., 2005), and annual-mean surface dissolved oxygen concentration in northwestern coastal waters.
Fig. 2.5.4 further includes the long-term oxygen concentration variation of the layer between σt ~14.45 and 14.6 kg m-3 surfaces (roughly the base of euphotic zone) along the eastern coast formed by annual averages of all deep stations irrespective of their seasons and locations. In consistent with the period of maximum SOL thickness, oxygen concentration of this layer attained low values below 200 μM and then was followed by an increasing trend up to ~300 μM during the 1990s at the time of narrower SOL thickness. The mid-1990s represented best conditions of the subsurface oxygen concentration, after which it started to deteriorate again during the period of SOL broadening. The interior basin and the eastern part of the sea presently reflect an intermediate state of the subsurface oxygen structure between worst conditions of the 1980s and the best conditions of the mid-1990s.
The surface DO concentrations in the northwestern coastal waters (Fig. 2.5.4), mostly in the vicinity of Constanta, respond less markedly to adverse effects of eutrophication because of atmospheric ventilation of surface layers. Nevertheless, slight changes are observed between relatively higher concentrations during cold periods (e.g. 1985-1993, after 2003, and prior to 1975) and warm periods (1975-1985 and 1994-2002). Instead it responds more strongly to climatic effects as indicated by its elevated values during short term severe winter episodes of 1985-1987, 1992-1993, 2003-2004.���� Fig. 2.5.4 further indicates that subsurface concentration within the eastern basin and surface concentration in the northwestern coastal waters tend to have opposite interannual variations after 1998 due to different environmental factors governing oxygen concentration. The eastern coastal waters appear to be controlled primarily by physical mechanisms that are regulated directly by climatic cooling-warming cycles, whereas northwestern waters by the changes in Danube organic and inorganic nitrogen loading, in addition to the direct climatic forcing.
2.6. Conclusions and key assessments
Nitrogen and phosphorus emissions continue to reduce, but their 2000-2005 average values are still 1.5 times higher than their pristine levels at 1955-1965. P-PO4 flux supplied by the River Danube declined considerably at 1990-1993, after which it maintained a steady level between 10-20 kt y-1 at the Sulina discharge point to the sea. The River Danube DIN flux at the Sulina discharge point decreased gradually during the 1990s to about 100 kt y-1 at 2000, but possessed a weak increasing trend to 250 kt y-1 during 2005. The DON flux supplied by the northwestern rivers (Danube, Dniepr, Dniestr, and Bug) is currently even higher than the DIN load. Consequently, an increasing trend is observed in DIN concentration along the Ukrainian, Romanian and Bulgarian coastal waters in the present decade. The western coastal waters are presently subject to both dissolved inorganic and organic nitrogen enrichment, and they do not present an apparent status of improvement in terms of nitrogen during the last 10 years. DIN and PO4 concentration levels along other coasts (southern, northeastern and northern) are, on the other hand, about 3-4 folds lower than the western coast. In spite of ongoing nitrogen enrichment, the western coastal waters tend to be weakly nitrogen limited as for the case of the interior basin, except the predominantly P-limited shallow inner shelf zone. The data suggest a weak Si limitation in western coastal waters as well. This is partially due to decreasing SiO4 concentration and partially due to increasing DIN concentration. Limited measurements at Sevastopol-Crimea quantitatively supported the importance of atmospheric deposition of nitrogen species.
Monitoring winter nutrient concentrations as an indicator of eutrophication set by EEA does not suit well for the Black Sea western coastal waters, because they possess peaks at April-May at the time of highest Danube discharge. More frequent (e.g. monthly) monitoring at less number of stations around the basin can be considered as an option of monitoring.�� Atmospheric deposition need to be monitored regularly around the basin in order to arrive at a more reliable nutrient budget of the sea. Moreover, nitrogen losses due to sedimentation and denitrification along the western coastal waters remain to be quantified in order to assess the fate of nitrogen enrichment of the system.
Surface chlorophyll concentration varies five-folds from its highest annual-mean values (~5 mg m-3) in the northwestern region to lowest values (~1 mg m-3) within the interior basin. The annual structure in the northwestern shelf is characterized by relatively high concentrations from early spring to late autumn. Lowest concentrations are observed in winter months. Romanian, Bulgarian and southwestern coastal waters generally reveal three peaks over the year; the first one comprises a weak late winter-early spring (February-March) algae bloom period in relation to typical spring bloom dynamics. This is the weakest one and does not exist for some years. It is followed by a stronger late-spring peak (in May-June) that evidently coincides with the period of high Danube discharge. The third one occurs in autumn and is separated from the former one by a period of relatively low summer concentrations. Interior basin depicts a different annual structure. Surface chlorophyll concentration decreases linearly from a peak in November to a minimum in July, followed by a sharp increase from August to November again. The autumn peak is the strongest one with an occasional weak chlorophyll peak in spring.�� Monitoring surface chlorophyll concentration only in summer months, as set by EEA monitoring strategy, therefore may not be well-suited for the Black Sea, and may even lead to a wrong assessment. While summer months possess lowest chlorophyll concentration at the surface, they tend to show high values below the seasonal thermocline (i.e. the subsurface chlorophyll maximum layer), which therefore need to be monitored systematically. Comparison of satellite ocean colour and in situ chlorophyll concentrations is encouraging, and indicate that satellite data provide a potential tool for chlorophyll monitoring.����
According to recent studies, hypoxia decreased in Romanian coastal waters as compared to the previous decade, and no hypoxia case was observed in Bulgarian waters in 2001-2005. Relatively low oxygen concentrations tend to occur more predominantly in the northern sector upstream of the Danube delta region. Long-term data at Constanta monitoring station suggest surface oxygen concentration in 200-250 μM range during May-September period, including the intense eutrophication period of the 1980s.�� This information therefore is not particularly useful for assessment purposes. It is indeed essential to monitor the near-bottom summer oxygen concentration in addition to its surface value. On the other hand, the annual-mean surface oxygen concentration is a good indicator for monitoring long-term climate-induced modulations of eutrophication phenomenon in the western coastal waters. Subsurface oxygen concentration (below the euthopic zone) data from the interior basin and the eastern part of the sea presently reflect an intermediate state between worst conditions of the 1980s and the best conditions of the mid-1990s.
References
Bat, L., Şahin, F., Satılmış, H.H., �œst��n, F., Birinci ���zdemir, Z., Kıdeys A.E., ve Shulman, G.E. (2007). Karadeniz'in değişen ekosistemi ve hamsi balık��ılığına etkisi. Journal of Fisheries Sciences, 1 (4), 191-227.
Berlinskii, N. (1989) Mechanisms of bottom hypoxy formation in shelf ecosystems. Water Resources, 4, 112-121.
Berlinskii, N, Garkavaia, G., Bogatova, Y. (2003) Problems of anthropogenic eutrophication and evolution of hypoxic situations in the North-Western part of the Balcak Sea. Ecology of Sea, 17-22.
Chaykina, A.V., V.V., Dolotov, Y.P., Ilyin, S.K., Konovalov, A.S., Kuznetsov, L.N., Repetin, O.V. Voitsekhovich (2005) Observational studies of nutrient loads on the Black Sea with atmospheric precipitations. Proceedings of The First Biannual Scientific Conference: Black Sea Ecosystem 2005 and Beyond, organized by Commission on the Protection of the Black Sea Against Pollution, May 2006, Istanbul.
Churilova T., G. Berseneva, L.Georgieva. (2004) Variability in bio-optical characteristics of phytoplankton in the Black Sea. Oceanology (English translation), 44(2), 192-204.
Churilova, T., Z. Finenko, S. Tugrul, (2006)�� Light absorption and quantum yield of�� photosynthesis during autumn phytoplankton�� bloom�� in the western�� Black Sea. Proceedings of The First Biannual Scientific Conference: Black Sea Ecosystem 2005 and Beyond, organized by Commission on the Protection of the Black Sea Against Pollution, May 2006, Istanbul.
Cociasu, A., L. Popa, S. Dineva, P. Ivanova, V. Velikova (2004) Summary report on field and laboratory work in 2001-2003 in comparison with previous observations in the Western Black Sea. Nutrient management in the Danube Basin and its impact on the Black Sea. daNUbs Projects (EVK1-CT-2000-00051), Deliverable 7.6, Nutrient Management in the Danube basin and its impact on the Black Sea. EVK1-CT-2000-00051.
daNUbs Project Final Report (2005) Nutrient management in the Danube basin and its impact on the Black Sea. Final Report, December 2004.
Feyzioglu, M., A. Guneroglu, I. Yildiz (2006) Weekly changes of�� Synechococcus spp. and pigment concentration in the Southeastern Black Sea coast. Proceedings of The First Biannual Scientific Conference: Black Sea Ecosystem 2005 and Beyond, organized by Commission on the Protection of the Black Sea Against Pollution, May 2006, Istanbul.
Hibaum, G, V. Karamfilov (2005) Regime shifts in the annual dynamics of primary production and chlorophyll_a concentrations in the costal zone of the Bourgas Bay (Western Black Sea). Proceedings of The First Biannual Scientific Conference: Black Sea Ecosystem 2005 and Beyond, organized by Commission on the Protection of the Black Sea Against Pollution, May 2006, Istanbul.
Horstmann, U., Davidov, A. (2002) IFM Annual Report. daNUbs project.
Konovalov, S.K., and J.W. Murray (2001). Variations in the chemistry of the Black Sea on a time scale of decades (1960-1995). J. Mar. Syst., 31, 217-243.
Konovalov, S., J.W. Murray, and G.W. Luther III (205) Basic Processes of Black Sea Biogeochemistry. Oceanography, 18, 25-35.
Kucheruk, N. (2005) Integrated study of eutrophication and biodiversity in the Russian coastal waters. Proceedings of The First Biannual Scientific Conference: Black Sea Ecosystem 2005 and Beyond, organized by Commission on the Protection of the Black Sea Against Pollution, May 2006, Istanbul.
Loyeva, I., I. Orlova, N. Pavlenko, Yu. Popov, V. Ukrainskiy, Yu. Denga, V. Komorin,�� V. Lepeskin (2006) Estimation of the ecological state of the north-western part of the Black Sea. Proceedings of The First Biannual Scientific Conference: Black Sea Ecosystem 2005 and Beyond, organized by Commission on the Protection of the Black Sea Against Pollution, May 2006, Istanbul.
Medinets, S. and Medinets, V. (2008) Results of investigations of atmospheric pollutants fluxes to the surface of Zmeiny Island in western part of the Black Sea in 2003-2007. In: 2nd Biannual and Black Sea Scene EC project joint conference on climate change in the Black Sea ����� hypothesis, observations, trends, scenarios and mitigation strategy for the ecosystem. 6-9 October 2008, Sofia, Bulgaria.
Moncheva, S. (2005) Phytoplankton shifts in the Black Sea ����� Driving forces and implication for reference conditions. Proceedings of the JRC Workshop, 26-28 October, 2005-Istanbul
Okus, E.�� (2005)�� Time series analysis of nutrients in southwestern Black Sea and the Sea of Marmara. Proceedings of the JRC Workshop, 26-28 October, 2005-Istanbul
Oguz, T. (2005) Long-Term Impacts of Anthropogenic Forcing on the Black Sea Ecosystem. Oceanography, 18, 112-121.
Oguz, T. and D. Ediger (2007) Comparision of in situ and satellite-derived chlorophyll pigment concentrations, and impact of phytoplankton bloom on the suboxic layer structure in the western Black Sea during May�����June 2001. Deep Sea Res. II, 53, 1923-1933.
Parr et al. (2006) Impact of the Danube River on the Black Sea. Estimation of the ecological state of the north-western part of the Black Sea. Proceedings of The First Biannual Scientific Conference: Black Sea Ecosystem 2005 and Beyond, organized by Commission on the Protection of the Black Sea Against Pollution, May 2006, Istanbul.
PMA AG and AC Activities and Reporting (2007) Final Report on Policy Measures, Development and Data Analysis for 2006/2007. Black Sea Commission, 20 November, 2007 San Diego-Mcglone et al. (2000)
State of the Environment of the Black Sea, 2002. Pressures and trends: 1966-2000. Commission on the Protection of the Black Sea Against Pollution. Istanbul. 101 pp.
Teodoru, C. R., G. Friedl, J. Friedrich, U. Roehl, M. Sturm, B. Wehrli (2007) Spatial distribution and recent changes in carbon, nitrogen and phosphorus accumulation in sediments of the Black Sea. Marine Chemistry, 105, 52�����69. TDA (2007) The Black Sea Transboundary Diagnostic Analysis.
Yakushev, E.V., O.I. Podymov, and V.K. Chasovnikov (2005) Seasonal Changes in the Hydrochemical Structure of the Black Sea Redox Zone, Oceanography, 18, 49-55.
Yunev, O. A., V. I. Vedernikov, O. Basturk, A. Yilmaz, A. E. Kideys, S. Moncheva, S. K. Konovalov (2002) Long-term variations of surface chlorophyll a and primary production in the open Black Sea. MEPS, 230, 11�����28.
Velikova, V. and Cociasu, A. (2004) Summary report on field and laboratory work in 2001-2003 in comparison with previous observations in the Western Black Sea Part. III. Comparison between Roumanian and Bulgarian waters. Nutrient management in the Danube Basin and its impact on the Black Sea. daNUbs Projects (EVK1-CT-2000-00051), Deliverable 7.6, Nutrient Management in the Danube basin and its impact on the Black Sea. EVK1-CT-2000-00051.
Zaitsev Yu.P. (1992) Recent changes in the trophic structure of the Black Sea. Fisheries Oceanography, 1, 180-189.
CHAPTER 3 THE STATE OF CHEMICAL POLLUTION (A. Korshenko et al.)
This chapter describes the state of petroleum hydrocarbon (TPHs), organochlorine pesticide, and trace metal pollution in water and sediments in the Black Sea during the last ten years. The pathways of these anthropogenic pollutants into sea ecosystem are different. Many pollutants are restricted to rather narrow zone in the vicinity of large cities, estuarine areas of the large rivers and industrial places. The petroleum hydrocarbon pollution mostly originates from transportation activity over the sea and mainly confines to the surface.
The data used for the assessment of spatial and temporal variability of the pollutants came from three main sources. The last five years were mainly covered by the international monitoring data collected by Secretariat of the Black Sea Commission. Despite some restriction in the number parameters these data sets were rather well and allowed to compare the pollution level of coastal zones in different countries. The second important source was the international Screening Cruise 1995 (for bottom sediments), the IAEA Cruise (11-20 September 1998) (for water column), the IAEA Cruise (22.09-9.10.2000) (for water column), the IAEA Cruise (24.09-3.10.2003) (for bottom sediments), the BSERP Cruise (6-19.06.2006) (for bottom sediments of Romania and Georgia). The third source was the national scientific expeditions.
3.1. The State Of Total Petroleum Hydrocarbons (TPHs)
State Oceanographic Institute, Moscow, RUSSIA
Depending on the analytical procedures applied in different cruises [5], the petroleum hydrocarbons data are expressed either in total amount or in terms of relative contributions of Aliphatic, Aromatic and Polyaromatic groups in the oil.
3.1.1. Water
The most intensive spatial investigations of the TPHs distribution over the whole Black Sea were carried out during two IAEA Cruises of RV "Professor Vodyanitskyi" during 11-20 September 1998 and 22.09-11.10 2000 [1]. In 1998, 16 stations were visited in the western central basin, the Danube offshore area and Romanian shelf. The average concentration for all sampled area is 0.084 mg/l, the maximum reached 0.23 mg/l in the shallow waters off Romania coast south of Constanta where active ship traffic, oil refinery and harbor activities could be the main reason of very high level of TPHs concentration. TPHs concentrations in the Danube discharge region were not high as compared with the Constanta region. Lowest concentrations (0.03 mg/l) were recorded near the entrance of Bosporus Strait and near Odessa. In general, the spatial distribution of petroleum hydrocarbons in September 1998 was rather uniform and level was low (Fig. 3.1.1).
In the IAEA Cruise 2000, TPHs were measured at 32 stations in the Eastern and Central parts of the Sea. Its total concentration varied from negligibly low values to 0.73 mg/l with an average value of 0.097 mg/l. The anomalously high concentration of 3.27 mg/l was recorded in the surface layer of a shallow station near Feodosiya in Crimea. This level exceeded the Russian standard Maximum Allowed Concentration, MAC, (0.05 mg/l) for marine waters more then 65 times. The second high value (0.73 mg/l) measured close to this site in front of Yalta. Two other stations near Yalta also had quite high TPHs concentrations varied in different horizons from 0.13 to 0.19 mg/l. Such local patch of oil pollution in the Southern Coast of Crimea was the biggest at this time in the Black Sea waters and could be the result either of local spill or municipal discharge of large tourist centers (Table 3.1.1).
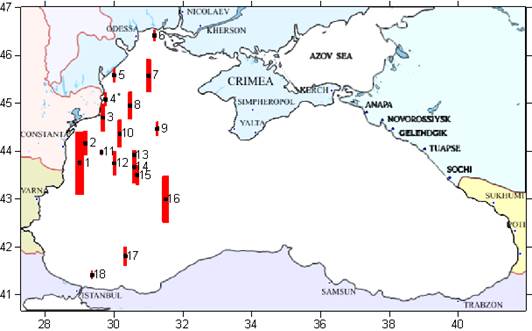
Fig. 3.1.1. Average Total Petroleum Hydrocarbons distribution (mg/l) at 11-20 September 1998.
Table 3.1.1. The average concentration of TPHs (mg/l) in different part of the Black Sea measured during the September-October 2000 IAEA Cruise.
| Region | Central West | Crimea Cost | Kerch Strait | Georgians waters | Sinop polygon | Central East | Central open |
| Concentration | 0.30 | 0.78 | 0.20 | 0.05 | 0.05 | 0.03 | 0.03 |
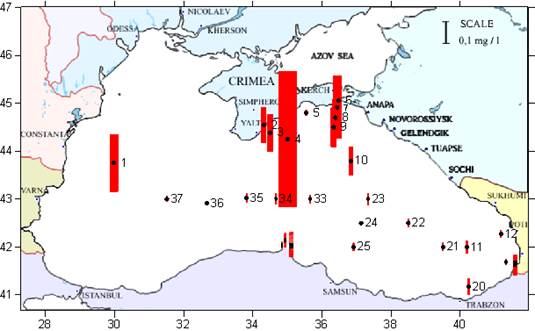
Fig. 3.1.2. Average Total Petroleum Hydrocarbons distribution (mg/l) at 22 September ����� 9 October 2000. The anomalous high concentration 3.27 mg/l near town Feodosiya is not shown on the map.
The waters at the Kerch transect was also relatively polluted by TPHs especially near the entrance of the Kerch Strait (Fig. 3.1.2) suggesting a discharge of oil pollution from the Kerch harbor and intensive ship traffic. On the contrary, the level of pollution in Georgian and Turkish waters was relatively low despite of a well-known center of oil processing in the Batumi area where the concentration of TPHs in surface and subsurface layers was lower than 0.09 mg/l and sometimes were under the detection limit of analytical procedure. In the Cape of Sinop region, the concentration varied from 0.02 to 0.12 mg/l. The Central part of the sea and the Eastern Basin showed only small concentrations of petroleum hydrocarbons which were often below the detection limit and never exceeded 0.05 mg/l.
Table 3.1.2. The average and maximum concentrations of TPHs (mg/l) in Ukrainian part of the Black Sea, 2000-2005.
| Region | Kerch Strait | Crimean towns | Odessa Bay | Odessa region [11] 1988-99 | Harbour Yuzhny | Harbour Illiechevsk | Dnieper and South Bug Mouth | 1992-99 [2](140 samples) |
| Average | 0.05 | 0.01 | 0.01 | 0.03-0.07 | 0.01 | 0.01 | 0.025 | 0.05 |
| Maximum | 0.18 | 0.06 | 0.08 | - | 0.07 | 0.07 | 0.05 | 1.2 |
Table 3.1.3. Annual average (above) and maximum concentrations (below) of TPHs (mg/l) in Ukrainian coastal waters of the Black Sea, 2000-2004 [4].
| Region | 2000 | 2001 | 2002 | 2003 | 2004 | 2004 TPHs (tons)* |
| Danube Delta | 0.05 | 0.05 | 0.05 | 0 | 0 | |
| 0.09 | 0.1 | 0.09 | 0.08 | 0.07 | ||
| Waterpasses in Danube Delta | 0.06 | 0.06 | 0.04 | 0.05 | 0.01 | |
| 0.10 | 0.12 | 0.08 | 0.08 | 0.07 | ||
| Suhoi Liman | 0.05 | 0.05 | 0 | 0 | 0 | |
| 0.3 | 0.25 | 0.28 | 0 | 0 | ||
| Harbour Illiechevsk** | 0.05 | 0.05 | 0 | 0 | 0 | |
| 0.08 | 0.16 | 0 | 0 | 0 | ||
| Harbour Odessa | 0.09 | 0.12 | 0.12 | 0.11 | 0.12 | 0.17 (with Suhoi Liman) |
| 0.24 | 0.35 | 0.33 | 0.56 | 0.51 | ||
| South Bug Estuary & Bug Liman | 0.2 | 0.28 | 0.16 | 0.17 | 0.19 | 43.59 (Dniper and South Bug Mouth) |
| 1.02 | 0.9 | 0.85 | 0.9 | 0.85 | ||
| Balaklava Bay (Crimea) | 0 | 0.05 | 6.9 (Sevastopol) | |||
| 0.06 | 0.08 | |||||
| Harbour Yalta (Crimea) | 0 | 0.05 | 0 | 0 | 0.02 | 1.8 (Large Yalta) |
| 0 | 0.05 | 0.17 | 0.24 | 0.47 | ||
* - estimation of petroleum hydrocarbons (tonns) discharge to the Black Sea in 2004.
** - Harbor Illiechevsk, the Channel and waste-water purification plant.
More recent (2000-2005) monitoring data from the northern part of the sea [3] indicated a maximum 0.18 mg/l in vicinity of Kerch Strait in September 2004 and an average concentration of 0.05 mg/l suggesting that concentrations were often close to analytical limit (Table 3.1.2). The TPHs concentration was very low in the Crimean towns Sevastopol and Evpatoriya despite their dense ship traffic and harbor activities. The monitoring data from the Odessa Bay also showed very low average concentration and moderate maximum level of 0.08 mg/l during 2000-2005. In the Yuzhny harbour, among 37 samples over last 5 years the only five had the concentration above zero. Practically the same situation in the waters of Illiechevsk harbour. At stations in the Dniper and South Bug Mouth the water were also free of TPHs.
According the other Ukrainian monitoring data for 2004, the water pollution by TPHs in the Danube Delta was moderate in August-October: the average value was 0.06 mg/l and maximum reached only 0.07 mg/l both in surface and near-bottom layers [4]. The TPHs was absent in the water slightly north along the coast in Suhoi Liman and Illiechevsk harbor (Table 3.1.3). On the other hand, very high concentrations were noted for the Odessa harbor where the TPHs content in the surface waters varied from 0.11 to 0.51 mg/l. Maximum occurred in October and monthly average value was high as 0.31 mg/l and 2-3 times higher than in January-August. The annual mean value was 0.12 mg/l. Near-bottom layer waters were less polluted and maximum reached 0.34 mg/l. The Bug Liman and South Bug estuarine area were characterized by the TPHs concentrations from zero to 0.85 mg/l in 2004 and the level of pollution slightly increased over the last few years. Similar high concentrations were also recorded in the Dniepr Liman and for the Dniepr river where maxima reached 0.68 and 0.50 mg/l, measured in deep waters in July and at surface in September correspondingly. The pollution increased in whole water column about 1.3-1.8 times in these sites during the last few years. In the Crimean Balaklava Bay, the TPHs concentration varied from zero to 0.08 mg/l and mean value was 0.05 mg/l. Much higher mean values were recorded in the Yalta harbor where maximum in surface layer was as high as 0.47 mg/l in July and reached 0.17 mg/l near the bottom. The data for the 2004 were somehow higher than the average of the 5 years period (2000-2005). The difference could be high as 10 times, like in the Dnieper-South Bug area, Odessa Harbor or Crimean ports. The averaged data probably smoothed the real picks in the water.
On the basis of these data sets, it can be suggested that, apart from accidental spills at localized areas, this part of the Black Sea did not show a chronic TPHs pollution. In general, it can be stated that large spatial and temporal variability of petroleum hydrocarbons distribution were encountered during the last years. It seems that patches of oil pollution were often local and short time visible, therefore the maximums better describes the real level of pollution.
In Romanian coastal waters during 2001-2005, the level of water petroleum hydrocarbons pollution is presented in Table 3.1.4 [3]. In 2005, the average concentration was 0.14 mg/l with the maximum 0.20 mg/l (Portita, October) in the Danube Delta. Along the coast to the south near Mamaia, the TPHs content in the surface waters was much higher and maximum reached level 0.47 mg/l. Almost the same situation with a small variation was noted for all Romanian coast up to Bulgarian border.
Table 3.1.4. The average and maximum concentration of TPHs (mg/l) in the surface coastal waters of Romanian part of the Black Sea, 2001-2005.
| Region | Year | Danube Delta | Mamaia | Constanta | Eforia Sud | Costinesti | Mangalia | Vama Veche |
| Average | 2005 | 0.14 | 0.21 | 0.23 | 0.18 | 0.23 | 0.25 | 0.28 |
| Maximum | 2005 | 0.20 | 0.47 | 0.37 | 0.26 | 0.41 | 0.41 | 0.43 |
| Average | 2001-2004 | 0.22 | 0.17 | 0.15 | 0.14 | 0.16 | 0.22 | 0.14 |
| Maximum | 2001-2004 | 1.28 | 0.75 | 0.76 | 0.71 | 0.67 | 2.27 | 0.40 |
| number of observation | 2001-2004 | 41 | 47 | 68 | 47 | 46 | 48 | 48 |
Typically, the average concentrations in all Romanian coastal waters were highest in 2003. Nevertheless, extremely high mean values were also noted in the previous years. The absolute maximum reached 2.27 mg/l in June 2003 in shallow waters near Mangalia of the Romanian coast. Another high level (1.28 mg/l) was marked in the Danube delta near Portita in April 2004. It is important to note that high concentration like 0.50 ����� 0.70 mg/l was recorded many times in all regions of Romanian coast. In 2001, the average for 50 samples was 0.17 mg/l; a year later for 92 samples - 0.10 mg/l; in 2003 ����� 68 samples and the mean was 0.14 mg/l; in 2004 ����� 135 samples and the mean was 0.02 mg/l; in 2005 ����� 74 samples and 0.21 mg/l. In general, among 344 records of TPHs concentrations in Romanian waters during 2001-2004 only 72 were less then 0.05 mg/l and the other mean values indicated a high level of petroleum hydrocarbon pollution along the Romanian coast.
The seasonal changes of TPHs did not show any clear trend during 2001-2004 measurements due to different number of observations in different months: The averages were 0.12 mg/l in 4 samples in March; 0.21 mg/l in 17 samples in April, 0.23 mg/l in 74 samples in May; 0.18 mg/l in 44 samples in June; 0.08 mg/l in 54 samples in July; 0.14 mg/l in 55 samples in August; 0.20 mg/l in 61 samples in September; 0.15 mg/l in 36 samples in October.
Bulgarian monitoring data did not include petroleum hydrocarbons measurements during 2001-2005.
Turkish coastal TPHs monitoring data covered 2003-2005. Near the outlet of the Bosporus Strait, the concentration at 3 shallow stations varied in the large range from 0.006 to 0.255 mg/l (exceeded 5 times the MAC according Russian legislation for marine waters) and the mean was 0.092 mg/l in January and February 2003. The general level of pollution of Turkish coastal waters was rather low and varied between 0.001 and 0.077 mg/l, the average was 0.011 mg/l next year mid-September. In August 2004 maximum (0.052 mg/l) was marked near the Sile to the east of the Bosporus exit section. All other concentrations fell inside the range of 0.001 ����� 0.042 mg/l with heavier pollution levels observed in coastal waters near Samsun.
In April 2005, the average level of petroleum hydrocarbons content in 63 samples from the Turkish waters was 0.020 mg/l. Maximum was as high as 0.163 mg/l in Ordu area. Slightly lower pollution was recorded near Fatsa (eastern basin) and along the west coast. The situation however changed drastically by the end of September and beginning of October 2005. Some places could be considered as heavily polluted. The maximum concentration of TPHs reached incredible level of 25.466 mg/l at a station along the west coast characterized by surface waters of Danube origin; two other nearby stations had concentrations of 1.935 and 0.855 mg/l. Excluding these extreme values, the average of 60 samples was 0.199 mg/l. High values were spotted practically in all parts of the Turkish coast during October 2003: in Zonguldak, 1.279 mg/l, in Bartin, 0.573 mg/l, in Cide, 0.530 mg/l, in Akcaabat, 0.571 mg/l, in Sile, 0.900 mg/l. In general, very high water pollution was noted in the western part of the Black Sea where mean level for four stations occurred as high as 0.757 mg/l.
During the screening cruise in the Georgian waters in October 2000, the concentration of petroleum hydrocarbons was less than the detection limit of method used (0.04 mg/l) at 5 m depth as well as the near bottom layer at 114 samples out of 140. The overall average was 0.130 mg/l. In twenty four water samples, the TPHs content exceeded 1 MAC (0.05 mg/l) and reached the level of 1.13 mg/l, in average ����� 0.23 mg/l. But the concentration of petroleum hydrocarbons at two coastal stations on the 5 m horizon reached 4.72 and 6.81 mg/l (more then 136 MAC). The reason of such amount of oil products in the water is unknown, probably it was a slick.
The extensive monitoring investigations along Russian coastal waters showed a moderate level of petroleum hydrocarbons pollution in 1988-1996 that was in general characterized by 0.1-0.2 mg/l, e.g. 2-4 MAC according to the Russian regulation for marine waters [12, 13]. At the same time, concentrations at some sites were as high as 1.10 ����� 1.20 mg/l, 22-24 MAC. The maximum was recorded in Sochi area in 1990. The content of TPHs then decreased gradually.
Based on the topographical and hydrological conditions along the Russian coast, the shallow waters were divided into several zones (Fig. 3.1.3). To some extend the environmental parameters are uniform within each zone. The monitoring data from the each zone allowed estimation the magnitudes and local pollution sources.
The monitoring in these coastal waters over the last 5 years (2002-2006) provided 868 measurements with an average value of 0.073 mg/l. This level exceeds the Maximum Allowed Concentration (MAC) 0.05 mg/l according Russian regulation. At the same time the range of variation was extremely large and varied between analytical zeros (e.g. less then detection limit 0.002 mg/l) to 3.200 mg/l. The maximum was marked in 27 September 2003 in surface waters at the shallow station (8 m depth) in the vicinity of village Novaja Matsesta close to city Sochi. At the same time, the concentration of TPHs reached second maximum of 1.971 mg/l in the near-bottom layer. The other TPHs concentrations higher than 1.0 mg/l occurred two days earlier at the rather deep station (51 m depth) near the village Loo close to Lazarevskoe where it reached 1,380 and 1.548 mg/l in surface and bottom waters, respectively.
In general the high content of TPHs exceeded 1 MAC was measured in 421 cases, e.g. approximately in half of the samples. The mean was 0.131 mg/l. The mean concentration in other parts was 0.019 mg/l. The vertical distribution was rather uniform as well (Table 3.1.5) since almost 60% of measurement sites were less 20 m depth. In deep waters, the petroleum content in the water column was only occasionally studied, and the mean for the some measurements at the horizons between 50 m and bottom was 0.020 mg/l.
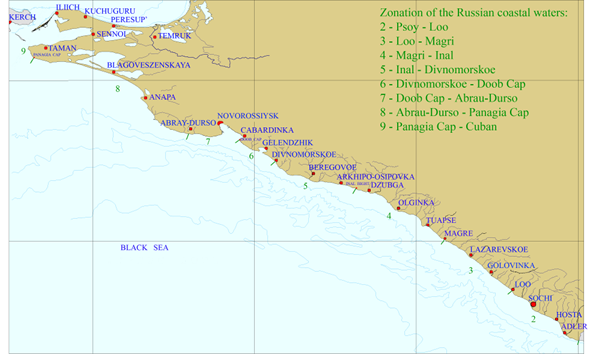
Fig. 3.1.3. Division of the Russian coastal waters in terms of TPHs pollution.
Table 3.1.5. TPHs concentrations in different water layers along the Russian coast in 2002-2006.
| Layer | Number of measures | Mean, mg/l | Maximum, mg/l |
| Surface | 371 | 0.083 | 3.200 |
| Intermediate | 176 | 0.033 | 0.200 |
| Near bottom | 321 | 0.084 | 1.971 |
Geographical pattern of TPHs distribution demonstrate increasing level of TPHs pollution in the coastal waters close to the towns Novorossiysk and Gelendzhik (Table 3.1.6). The most peculiar values were measured during September-October 2003-2005 and therefore could not be completely compared with the other data. The abundant samples from the southern part of the Russian coast and rather low sampling from the northern part showed concentrations in excess of 1 MAC in the surface and bottom waters. Relatively high values were recorded in all regions in September 2003 and October 2004. On the other hand, high TPHs were recorded only in waters between Inal Bight and village Divnomorskoe in July 2005. Interannual variations are not evident for such a short period of measurements (Table 3.1.7). One could suggest that TPHs concentration is slightly increased during the last years but the trend have to be confirmed with other data sets, if available. Seasonal variations are also not evident from this set of data (Table 3.1.8). The only conclusion which could be drawn by these data sets is higher TPHs pollution in the second part of the year with the mean value of 0.078 as compared to 0.050 mg/l for the first half of the year.
Summary: The mean concentration of petroleum hydrocarbons in the Black Sea in general were rather high and usually exceed standard Maximum Allowed Concentration (0.05 mg/l) almost everywhere in the sea (Table 3.1.9). The petroleum pollution appears a major problem for the whole sea during the last two decades. The same situation was in the previous period of 1980-th when the average of TPHs concentration for almost 4 thousands water samples exceeded the threshold of Maximum Allowed Concentration about 2 times [10]. The maximum concentrations could be extremely high, up to 25.5 mg/l, which were observed almost everywhere in the basin. Quite often, such high values were recorded along the tanker and shipping routes connecting the main harbors Odessa, Novorossiysk and Istanbul. The extremes in the coastal shallow waters should be a result of local spills from the ships or discharge from the waste water systems of the large cities. The ballast water discharge emerges one of the most important sources of petroleum pollution [14]. Black Sea rivers can also contribute significantly.
Table 3.1.6. Mean concentration of TPHs (mg/l) and number of measurements (in parantheses) in the different zones of Russian coastal waters in 2002 ����� 2006.
| Parameter / Zone number | 2 | 3 | 4 | 5 | 6 | 7 | 8 | 9 |
| Surface | 0.082(208) | 0.082(48) | 0.053(49) | 0.055(8) | 0.330(9) | 0.145(12) | 0.051(27) | 0.069(6) |
| Intermediate | 0.034(98) | 0.017(45) | 0.035(23) | 0.107(3) | 0.120(2) | 0.075(2) | 0.097(3) | - |
| Near bottom | 0.084(168) | 0.102(41) | 0.059(47) | 0.097(8) | 0.217(9) | 0.109(12) | 0.051(27) | 0.047(6) |
| ��Average | 0.073(474) | 0.066(134) | 0.052(119) | 0.081(19) | 0.258(20) | 0.123(26) | 0.054(57) | 0.058(12) |
| ��Maximum | 3.200 | 1.548 | 0.235 | 0.260 | 0.900 | 0.550 | 0.210 | 0.160 |
| ��Date of Maximum�� value | 27.09.2003 | 25.09.2003 | 18.10.2004 | 16.07.2005 | 18.10.2004 | 18.10.2004 | 13.10.2004 | 13.10.2004 |
Table 3.1.7. Annual variation of the mean concentration of TPHs (mg/l) in Russian coastal waters in 2002 ����� 2006.
| Year | 2002 | 2003 | 2004 | 2005 | 2006 |
| Mean TPHs | 0.027 | 0.058 | 0.091 | 0.082 | 0.064 |
Table 3.1.8. Seasonal variation of the mean concentration of TPHs (mg/l) in Russian coastal waters in 2002 ����� 2006.
| Months | 2 | 3 | 4 | 5 | 6 | 7 | 8 | 9 | 10 | 11 |
| Mean | 0.046 | 0.044 | 0.060 | 0.057 | 0.048 | 0.086 | 0.054 | 0.073 | 0.113 | 0.081 |
| Maximum | 0.210 | 0.160 | 0.080 | 0.300 | 0.110 | 0.640 | 0.260 | 3.200 | 0.900 | 0.820 |
| Number of samples | 22 | 38 | 4 | 52 | 32 | 111 | 178 | 239 | 128 | 64 |
Despite very high concentrations, about the half of samples can be considered as pollution-free implying very high level of spatial heterogeneity TPHs distribution. As a consequence, the current monitoring station network in the Black Sea appears to be not dense enough in terms of spatial coverage and temporal frequency to monitor oil spills. The field monitoring needs to be supported by satellite and/or aircraft images as routinely in Europe.
Satellite imagery can help identifying spills over very large areas. The Synthetic Aperture Radar (SAR) instrument, which can collect data independently of weather and light conditions, is an excellent tool to monitor and detect oil on water surfaces. This instrument offers the most effective means of monitoring oil pollution. It is currently on board the European Space Agency's ENVISAT and ERS-2 satellites and the Canadian Space Agency�����s RADARSAT satellite. In 2000-2004, JRC carried out a systematic mapping of illicit vessel discharges using mosaics of satellite images over all the European Seas (Fig. 3.1.4). These maps and the associated statistics were repeated on an annual basis in order to assess its evolution [6]. This action helped to reveal for the first time the dimension of the oil pollution problem, thus stressing the need for more concerted international actions. For the Black Sea, 1227 oil spills were detected during 2000-2004.
Table 3.1.9. Maximum and mean concentration of Total Petroleum Hydrocarbons (mg/l) in the Black Sea waters in 1992 ����� 2006.
| Area | Year | Waters | Max | Mean |
| IAEA | 1998 | Western shelf | 0.23 (Constantia) | 0.084 |
| IAEA | 2000 | Eastern open | 3.27 (Feodosia) | 0.097 |
| Ukraine | 1992-1999 | coastal | 1.20 | 0.050 |
| Ukraine | 2000-2005 | coastal | 0.18 (Kerch) | 0.050 |
| Ukraine | 2004 | coastal | 0.51 (Odessa) | 0.12 (Odessa) |
| Ukraine | 2004 | coastal | 0.85 (Dnieper ����� South Bug) | |
| Romania | 2001-2005 | coastal | 2.27 (Mandalia) | 0.14-0.28 |
| Turkey | 2003 | coastal | 0.255 (Bosphorus) | 0.092 |
| Turkey | 2004 | coastal | 0.077 (Sile) | 0.011 |
| Turkey | 2005 | coastal | 25.466 (Danube waters),1.935 (Danube waters) | 0.199 (without 3 extremes) |
| Georgia | 2000 | coastal | 6.81 (Georgia) | 0.13 (140 samples) |
| Russia | 2002-2006 | coastal | 3.200 (Novaja Matsesta, Sochi) | 0.073 |
| Black Sea [10] | 1978-1989Winter | coastal + open, surface | 0.89 (central Western shelf) | 0.10 (519 samples) |
| Black Sea [10] | 1978-1989Spring | coastal + open, surface | 0.59 (offshore of Crimea) | 0.08 (379 samples) |
| Black Sea [10] | 1978-1989Summer | coastal + open, surface | 0.55 (Odessa region) | 0.08 (526 samples) |
| Black Sea [10] | 1978-1989Autumn | coastal + open, surface | 1.29 (Sinop region) | 0.09 (425 samples) |
| Black Sea [10] | 1978-1989 | coastal + open | 1.29 (Sinop region) | 0.09 (3828 samples) |
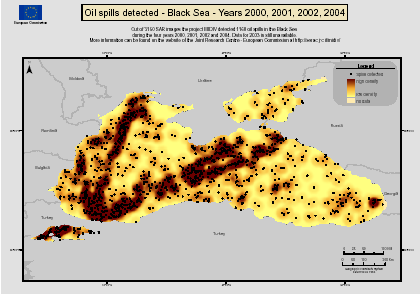
Fig. 3.1.4. The oil spills in the Black Sea for period 2000-2004. Map of oil spills based on images taken by Synthetic Aperture Radars (SARs) of European satellites ERS-2 and Envisat. The oil spill density has been spatially normalized to the spill widths and the number of images available for the detection http://serac.jrc.it/midiv/maps/.
Satellite detection of oil spills with synthetic aperture radar (SAR) can now provide reasonably reliable information, but it is still a major challenge for coastal environment. Difficulties are compounded when there is no a priori knowledge of the occurrence, location or timing of a spill, when volumes are small, or when the oil is mixed with water as it enters the sea ����� just the type of oil pollution that is most common. Thus, systematic multi-sensor routines represent an improvement. The Space Radar Laboratory of the Space Research Institute of RAS (http://www.iki.rssi.ru/asp/lab_554.htm) developed techniques for the synergistic use of satellite data to monitor pollution from pipe-line seeps, waste-water discharges, marine traffic and spillages from routine operations as part of offshore or tanker activities (http://moped.iki.rssi.ru). These techniques need to be implemented for operational monitoring system in coastal waters. First results were obtained during the semi-operational phase of satellite monitoring of the Russian coastal zones of the Black and Azov Seas in 2006-2007 [15, 16, and 17]. The ship routes to the ports of Novorossiysk and Tapes and oil terminal Zhelezny Rog were identified as the most polluted regions. Cumulative charts of oil spills based on the analysis of SAR data are presented (Fig. 3.1.5). Over the period of observations from April to October 2006, around 50 oil spills from ships were registered with the spill sizes of from 0.1 to 13 km2. The integral area of spills detected over the period was around 120 km2. Furthermore, approximately 70 oil spills from ships were detected in the north-eastern part of the Black Sea from April to October 2007, including the catastrophic 11 November 2007 event from the ���œVolgoneft-139���� tanker accident for in the Kerch Strait which was estimated to disperse to 117.6 km2. The total area of spills recorded during the observation period in 2007 was around 309 km2.
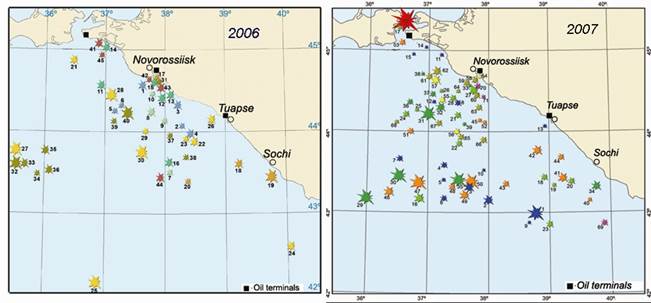
Fig. 3.1.5. Oil spills in the northeastern part of the Black Sea in 2006 and 2007.
3.1.2. Bottom Sediments
The first attempt to assess the level of TPHs pollution in the Black Sea bottom sediments was done in September-December 1995 during the international cruise aboard RV ���œV. Parshin���� [8]. The samples were taken at 25 sites at the outlet of Bosporus Strait and along the Ukraine coast including the Danube Delta as well as the vicinity of city Sochi in the southern part of Russian coast (Fig. 3.1.6). In bottom sediments around Crimea peninsula, the content of petroleum hydrocarbons was below 6.6 ��g/g near Yalta (depth 57 m), and 5.8 and 2.1 ��g/g at the shallower stations in the vicinity of Feodosia (18 m) and Kerch (6 m), respectively. The TPHs concentration increased drastically to 310 ��g/g with the mean value of 210 ��g/g at two sites in the northwestern shelf (Odessa area) with the depth of 11 m and 17 m. Similarly, high concentration was recorded at one station in the Danube Delta (220 ��g/g, 3 m depth) whereas it was 49 ��g/g at another shallower site (12 m depth). In the Bosporus vicinity the 10 samples were taken at rather deep places with about 80-130 m depth. The TPHs concentration was low and varied from 12 to 76 ��g/g with the average of 38.7 ��g/g. In the Russian part the high content of hydrocarbons 170 ��g/g was finding only at one station with 8 m depth placed near cost. Four other stations were much deeper (25-40 m) and the hydrocarbons pollution of bottom sediments reduced to 7.6 ����� 53 ��g/g with mean 22.9 ��g/g.
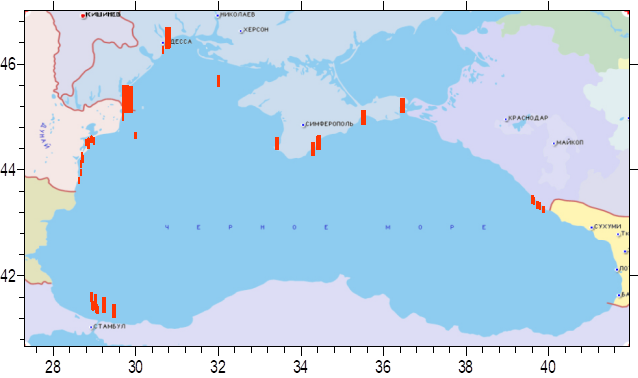
Fig. 3.1.6. Total Petroleum Hydrocarbons distribution in the bottom sediments of coastal area of the Black sea in September-December 1995 [8].
The petroleum hydrocarbons pollution of bottom sediment were sampled at shallow coastal stations with the depth less then 12 m as well as Odessa and Dnieper Deeps below 20 m in 1988-1999 [11]. At the slope of Dnieper Deep, the TPHs concentration varied in a range 1600 - 2000 ��g/g dry weight close to the Odessa city, but apart from the ports it was slightly less as 800 ����� 1700 ��g/g. The Odessa and Yuzhny ports could be considered as a most important source of petroleum pollution. Beside this, the spectrum size of bottom sediment highly influenced on the TPHs level. The maximum numbers were recorded in the central part of the Odessa Deep in the fine clay sediments where the concentrations reached 3400 ����� 5700 ��g/g. At the same time, the minimum was 300 ��g/g only in the sandy sediments close to the coast.
The other set of monitoring data from 169 samples received in the northwestern shelf during 1992-1999 [2]. The maximum reached 825.0 ��g/g while the average value for the whole set was 114.8 ��g/g. The highest pollution was recorded in sediments of the Danube delta region ����� the average for 29 samples reached 210 ��g/g, next was the Dniestr Lagoons outlet area with 169 ��g/g for 23 samples. In the Dniepr-Bug Lagoon area the average of 6 samples was 133 ��g/g. The mean concentration in the Odessa area close to the ports of Odessa, Illiechevsk and Yuzhny was 100 ��g/g for 63 samples. The pollution level was, on the other hand, much lower (15.0 ��g/g) in the central part of the shelf away from the main sources of pollution. After 2000, no data were available for petroleum hydrocarbons in bottom sediments along the Ukrainian coast.
Along Romanian coast the petroleum hydrocarbons in sediments were not sampled until 2005. In the period of April-October 2005, the concentration in bottom sediments of shallow parts of the Romanian coast (depths less 20 m) varied in a very large range from 25,6 to 11736,7 ��g/g. The maximum was noted in June close to Constanta at the site of 5 m water depth. The two other very high values of 6729 and 10090 ��g/g were recorded there in April and October, respectively. The concentrations at all other stations were significantly less with an average value 389.7 ��g/g for 68 samples. The spatial distribution was rather uniform (Table 3.1.10). A very high level was recorded near the main harbor Constanta. A slightly increasing level of petroleum hydrocarbons pollution was noted in the Danube Delta and near the village Vama Veche in the south. In general, the Romanian bottom sediments could be considered as highly polluted by petroleum hydrocarbons. The average level for whole coastal line exceeded almost 8 times the concentration of Netherlands standard for bottom sediments, Permission Level 50 ��g/g [7]. The average data for each part of the Romanian coast also was few times higher then 1 PL (Table 3.1.10).
Table 3.1.10. The mean concentration of TPHs (��g/g) and number of measurements within monitoring programme in the different sites of Romanian coast in 2005.
| DanubeDelta | Mamaia | ConstantaNorth | ConstantaSouth | Eforie Sud | Costinesti | Mangalia | Vama Veche | |
| Mean | 339.2 | 273.6 | 221.5 | 4484.4 | 231.2 | 291.9 | 258.3 | 499.5 |
| Number of samples | 10 | 13 | 5 | 8 | 8 | 11 | 8 | 8 |
In June 2006 four samples were taken along the transect off Constanta at depths 14, 36, 45 and 53 m. Total content of petroleum hydrocarbons in the bottom sediments did not exceed 74.4 ��g/g and the average was only 33.7 ��g/g for all four samples with minimum 6.6 ��g/g. Those data are highly different from almost 100 times higher values recorded in 2005. It could be explained by spatial heterogeneity of bottom sediment pollution depending from many factors.
The only petroleum hydrocarbons pollution monitoring of bottom sediments in Turkish coastal area was performed in April and September-October 2005. In April the level of TPHs was low and varied from 1.6 to 233.2 ��g/g in the western part of the Turkish coast. The maximum reached 38.7 ��g/g only, at stations with 12-51 m water depth in the vicinity of Sakarya River. However, near the town Zonguldak, the pollution level drastically increased up to the extremely high number of 11999.1 ��g/g at a site with 13 m water depth, 9025.0 ��g/g at 50 m and 475.5 ��g/g at 100 m water depth. The bottom sediments from Cide to Fatsa in the eastern part were relatively clean with mean value of 165.0 ��g/g for 16 stations placed at the depth range of 9-111 m. The minimum here was 2.3 ��g/g, maximum reached 793.7 ��g/g and was noted for the deepest station near Cide. The mean for 15 stations of the eastern part was 234.7 ��g/g and maximum was 2512.4 ��g/g near Pazar. In general, at 40 sites along the Turkish coast sampled in April 2005 the mean value was 700.3 ��g/g. Almost ten times lower values were recorded in October 2005 with the mean of 77.4 ��g/g for the 63 stations. The maximum was 1016.5 ��g/g near Zonguldak.
According to forecasts the volume of oil and oil product transportation through Georgian ports is estimated to be about 50-60 million tonnes per year in 2010-2015. Intense development of marine infrastructure is expected to aggravate current complex ecological state of the marine ecosystem of the sea for which oil pollution is the most dangerous. Within the frame of the international project on the ���œStudy of the background ecological status of the Eastern part of the Black Sea along the coast of Georgia����, the concentration of petroleum hydrocarbons in the bottom sediments was determined during 2000. Samples of bottom sediments were taken from 75 stations on the Georgian shelf at the depth range from 10 to 1500 m. A gradually decreasing petroleum hydrocarbon concentration was observed along the topographic slope down to the depth of 200 m. The average concentration for the sites with depths less than 50 m was 26.9 ��g/g, from 50 to 100 m - 19.5 ��g/g, and from 100 to 200 m - 11.4 ��g/g. High content of petroleum hydrocarbons was detected in the bottom sediments of the Poti harbour area, 35.3 ��g/g on the average. In the bottom sediments to the north of the Batumi harbour, the concentration of petroleum hydrocarbons also increased up to 17.7 ����� 21.7 ��g/g, on the average 10.5 ��g/g. Apparently, flows of sediments contaminated with petroleum products moved from the Batumi area northwards. In the gorge of the Natanebi River petroleum deposits and oil manifestations, petroleum hydrocarbons content was measured at 152.7 ��g/g.
Method used for identification of petroleum hydrocarbons was enabled to identify not only the groups of petroleum products, but the approximate time of oil spills as well [5,6,7]. The TPHs in the bottom sediment was of different origin and differed in terms of light and heavy fractions. Latest spills were mostly found in the regions of Batumi and Poti harbours as well as between estuaries of Khobi and Tsivi Rivers. Their origin was the man-made pollution due to the impact of ports and terminals. In the deep stations starting from the depth of 200 m, concentration of TPHs increased which may likely be due to re-deposition of petroleum products absorbed on the clay particles transported from the coastal water to the deep water area. At the same time, anoxic conditions prevented biogenic degradation of the hydrocarbons.
Table 3.1.11. The concentration of TPHs (��g/g) and other physical and chemical parameters of the bottom sediments of the Georgian part of the Black Sea in June 2006 [9].
| Region | TPHs (��g/g) | EOM (mg/g) | Total Organic Carbon, TOC (%) | Grain Size Fines, <65.5 ��m (vol%) | Total PAHs (ng/g) | Total HCHs (pg/g ) | Total DDTs (pg/g) | Total PCBs (pg/g) |
| Batumi | 6.1 | 0.031 | 0.13 | 42.55 | 145.1 | 318 | 496 | 864 |
| Kobuleti | 202.2 | 0.43 | 0.65 | 54.71 | 27384.8 | 1118 | 16550 | 4000 |
| Natanebi | 76.7 | 0.45 | 1.59 | 79.76 | 3944.5 | 1634 | 5090 | 6200 |
| Supsa | 70.3 | 0.18 | 1.66 | 75.86 | 4074.6 | 1336 | 3679 | 4320 |
| Poti | 15.6 | 0.042 | 0.24 | 9.92 | 710.3 | 664 | 1269 | 1445 |
In June 2006, at five sites at 60 m water depth along Georgian coast in vicinity of Batumi, Kobuleti, Poti and estuaries of the Natanebi and Supsa Rivers, the maximum was recorded near Kobuleti and reached the level 202.2 ��g/g [9]. The minimum was 6.1 ��g/g near Batumi and mean value was 74.2 ��g/g. The concentration of extracted organic matter (EOM) in the bottom sediments varied between 0.03 and 0.45 mg/g and, in general, the high concentration of TPHs is correlated with the high EOM content. The same correlation was also evident with the grain size of bottom sediments. The coarse ground had less concentration of petroleum hydrocarbons (Table 3.1.11). Majority of fine sediment near estuary Natabeni and Supsa was not heavily polluted by hydrocarbons and could not be regarded as ���œhot spots����.
Prior to 2000, high content of hydrocarbons (170 ��g/g) was found only at one coastal station at 8 m depth in Russian coastal waters. At other deeper stations (25-40 m) the hydrocarbons pollution was in the range of 7.6 ����� 53 ��g/g with mean 22.9 ��g/g [8]. In December 2000, the southern part of the Russian coast from the town Gelendzhik to the village Adler (8 stations placed at 26-41 m water depth) was characterized by the minimum concentration level of 10.7 ��g/g (measured at the traverse of estuary Chyhykt River close to Lasarevskoe). The maximum reached 117.0 ��g/g at the traverse of the Sochi harbour. The average was 32.8 ��g/g.
In June-July 2002, monitoring of the TPH pollution level of sediments showed drastic differences to south of Taman. The aliphatics fraction reached the level of 45-84 ��g/g and aromatics 35-62 ��g/g in deep parts, while they had only 5-9 ��g/g and 2 ��g/g, respectively, in shallow stations. The 10-20 fold differences could be the result of size spectrum of bottom sediment particles, which is much smaller in the deep zone with active sedimentation.
In August 2004, the concentration of total petroleum hydrocarbons in the bottom sediments in the southern part of the Russian coast, between the rivers Hosta and Shapsukho near Tuapse, varied in a very wide range from 11.9 to 2840.0 ��g/g with the average of 394.4 ��g/g. Two most extreme values were registered in the shallow estuaries of the rivers Tuapse (2840.0 ��g/g) and Sochi (1400.0 ��g/g) at 6-7 m water depth. Without these extremes, the average value still remained very high (221.8 ��g/g, more then 4 PL [7]) and demonstrated a rather wide spreads of petroleum pollution along southern and central part of Russian coast. In estuaries of the Hosta and Sochi Rivers of the southern zone 2, the mean was 227.0 ��g/g. The mean concentration near villages Loo, Lazarevskoe and the Shahe River at the depth about 40-60 m, on the other hand, was much lower with a value 28.5 ��g/g. Slightly to north, the pollution of bottom sediments by TPHs was below 1 MAC at all points at the distance 2 nm from the coast and depth 40-60 m up to the Shapsukho River.
In general, the TPHs pollution level in coastal bottom sediments can be divided into two groups: the offshore stations at more than 2 nm away from the coast located at depths 40-60 m and inshore shallow stations. The average level for the offshore sites was 31.3 ��g/g and the variation was only from 11.9 to 74.1 ��g/g. The inshore group contained the shallow estuaries of the Sochi River with the mean 481.0 ��g/g, and estuary of the Tuapse River with the mean 787.0 ��g/g. The difference in petroleum hydrocarbons concentration up to 10-20 times in inshore and offshore regions is evident and should be related to large volumes of municipal and manufacturing waste from two large cities and the discharges from two rivers.
The investigations of bottom sediments pollution by petroleum hydrocarbons in the northern part of Russian coast were carried out in October 2004. Inside the Gelendzhik Bight the concentration of TPHs in the bottom sediments was 61.2 ��g/g. Significantly higher values between 122.0 ��g/g were measured near the pear in Sheskharis and 1900.0 ��g/g in the western part of Novorossiysk harbor. The mean value was 911.0 ��g/g. An opposite situation was observed in the Anapa Bight slightly to north. Two samples from the 5 m water depth showed only 5.0 and 88.0 ��g/g TPHs concentrations therefore much lower than the southern parts. Similar moderate values (59.5 ��g/g) were received in bottom sediments of the port Kavkaz in the Kerch Strait at the point of 6 m depth.
In July 2005, several samples were collected in the southern part of the Russian coast from the River Sochi up to the village Dzankhot in the north near Gelendzhik. All samples were taken at the depth 30-50 m slightly away from the shore. The concentration was rather moderate and varied in the narrow range from 35.3 to 88.0 ��g/g with the average value of 54.0 ��g/g. The only station in the shallow estuary of the River Mzumta (9 m depth) showed the maximum recorded level.
Summary: During the last 10 years, the mean concentration of petroleum hydrocarbons in the bottom sediments of coastal parts of the Black Sea varied from very low level up to high value of about 0.8 mg/g (Table 3.1.12). Usually in the most sites of the coast the average concentration was about 1 PL (50 ��g/g, [7]) but several maxima exceeded this threshold 13-16 times. Those extremely polluted sites are placed in Romania, Turkish and Russian waters, close to the main sources of TPHs, namely large ports, oil refinery or oil terminals for transportation. The maximum values around 12 mg/g were recorded at Romanian and Turkish coasts at the very shallow depths and most likely represented fresh oil spills in 2005. Due to high patchiness of oil distribution in the sea such occasional extreme values are expected.
Table 3.1.12. Maximum and mean concentration of TPHs (��g/g) in the bottom sediments of the Black Sea in 1995 ����� 2006.
| Project | Year | Region | Max. value | Max. Depth�� (m) | Mean (Depth <20 m) | Mean (Depth >20 m) | Mean |
| Screening | 1995 | Crimea | 310.0 | 11 | 116.2 | 4.7 | 71.6 |
| Screening | 1995 | Russian | 170.0 | 8 | 170.0 | 22.9 | 52.3 |
| Screening | 1995 | Bosporus | 76.0 | 107 | - | 38.7 | 38.7 |
| Research | 1988-1999 | Ukraine | 5700.0 | - | - | - | - |
| Monitoring | 1992-1999 | Ukraine | 825.0 | - | - | - | 114.8 |
| Monitoring | 2005 | Romania | 11736.7 | 5 | 775.4 | - | 775.4 |
| BSERP | 2006 | Romania | 74.4 | 36 | 6.6 | 42.8 | 33.7 |
| Monitoring | 04.2005 | Turkey | 11999.1 | 13 | 2078.1 | 457.2 | 700.3 |
| Monitoring | 10.2005 | Turkey | 1016.5 | 51 | 84.0 | 76.4 | 77.4 |
| Research | 2000 | Georgia | 152.7 | 88 | 19.0 | 19.0 | 19.0 |
| BSERP | 2006 | Georgia | 202.2 | 60 | - | 74.2 | 74.2 |
| Research | 2000 | Russia | 117.0 | 41 | - | 32.8 | 32.8 |
| Research | 2002 | Russia | 144.0 | 70 | - | 60.5 | 60.5 |
| Research | 2003 | Russia | 152.0 | 50 | 25.5 | 96.3 | 36.7 |
| Monitoring | 08.2004 | Russia | 2840.0 | 7 | 646.0 | 31.3 | 394.4 |
| Monitoring | 10.2004 | Russia | 1900.0 | 15 | 671.0 | 122.0 | 625.2 |
| Monitoring | 2005 | Russia | 88.0 | 9 | 88.0 | 49.1 | 54.0 |
TPHs concentrations in the bottom sediments decreased with increasing depth; i.e. towards offshore (Table 3.1.12). The average level of concentrations was usually highest at depths shallower than 20 m. Some uncertainties came from the sampling strategy; i.e. due to different number of sampling in each site. Irregular and often patchy sampling in many parts of the sea greatly limited a better evaluation of the TPHs pollution. In many cases, the pollution assessment was made on the basis of only few samples of bottom sediments taken during the last 10 years or even none at all. The further monitoring program is much desired for more reliable description of bottom sediments pollution by petroleum hydrocarbons especially in vicinity of main oil sources.
3.2. The State Of Chlorinated Pesticides
Alexander Korshenko
State Oceanographic Institute, Moscow, RUSSIA
Sergei Melnikov
Regional Centre ���œMonitoring of Arctic����, Sankt-Petersburg, RUSSIA
3.2.1. Water
The pesticides investigation in the Black Sea waters significantly differs from the petroleum hydrocarbons studies. Due to low concentration of chlorinated hydrocarbons in the marine water this parameter was not included into the measurements list neither during the international IAEA Cruise of the RV "Professor Vodyanitskyi" in 11-20 September 1998, nor in the second IAEA cruise of the RV "Professor Vodyanitskyi" during 22 September ����� 11 October 2000 [1]. The main source of the information on the pattern of pesticides distribution was provided by the national scientific and monitoring programs.
177 water samples were collected for chlorinated hydrocarbon measurements in the surface layer of shallow waters of the North-Western part of the Black from 1988 to 1999 [2]. In general, the level of pesticides was low. The average concentration of lindane (γ-HCH) was 0.48 ng/l (Table 3.2.1). The data varied within the range from analytical zero to 4.0 ng/l. The DDT and its metabolites DDE and DDD had a slightly higher level ����� average 1.08 ng/l with the range 0.0 ����� 14.4 ng/l; 0.55 ng/l (0.0 ����� 5.4 ng/l); 0.38 ng/l (0.0 ����� 6.3 ng/l), respectively. Important point is to note the predominance of DDT in comparison with its metabolites. It suggests a more recent and ongoing water pollution in the studied area. The method of liquid-gas chromatography applied at the end of this monitoring period allowed to identify very low concentrations of some other chlorinated pesticides like hexa-chlorbenzene, aldrin and heptachlor. Their average and maximum concentration in 1999 was 0.26 and 4.18 ng/l for hexa-chlorbenzene, 0.22 and 3.12 ng/l for aldrin, 0.01 and 0.22 ng/l for heptachlor, respectively.
57 samples analysis were taken for pesticide analysis in Romanian coastal waters during April, July and October 2005 within the framework of national monitoring program [3]. The stations were placed along Romanian coastline at shallow sites at depths less than 20 m. The pesticides concentration of the DDT group exceeded the detection limit of the method used (DL = 0.001 ng/l) only in 18 water samples. The maximum 14.75 ng/l total concentration of DDT group was recorded in April near Mangalia close to beach at 5 m depth isobath. Individual concentration of DDT there was 6.95, DDD 5.91 and DDE 1.89 ng/l. The DDT level exceeded the detection limit, DL, only in this one sample, and the DDT was not registered in other cases. Except this outstanding sample, DDD was recorded 5 times with an average 0.32 ng/l and the maximum 1.01 ng/l. DDE exceeded the DL 17 times. Its average was 0.12 ng/l and the maximum 0.47 ng/l.
Among pesticides of the HCH group, the lindane (γ-HCH) was found rather often in all places along the Romanian coast and in the Danube Delta. Its concentration exceeded the DL (0.001 ng/l) in 34 samples. The average of all samples was 0.064 ng/l and the maximum reached 0.3 ng/l in July near Costanesti. The average for samples where concentration of γ-HCH was higher than its DL was 0.108 ng/l.
No data were available to make an assessment of water pesticides pollution along the Bulgarian, Turkish and Georgian coasts. These pollutants were not included into routine national monitoring programs.
Water samples were collected along the Russian coastal waters from 23 May 2002 to 23 November 2006. Investigations were performed within the frame of national monitoring program. In May, October and November 2002, 48 water samples obtained in the southern region close to the city Sochi showed no pesticides concentration above the DL which seems to be rather unrealistic and suggest either false sampling or measurement. These monitoring data were thus excluded from the analysis. The same also applies for the February 2003 data set.
The September-October 2003 samplings were performed as a part of the ���œAero visual monitoring program���� and covered the southern and central parts of the Russian coast between the Cape Inal close to Dzubga [3]. The average of total DDT concentration was 0.84 ng/l and varied within range of 0.17-3.26 ng/l (Table 3.2.1). Maximum concentrations of total DDTs, as well as 2.30 ng/l for DDT and 0.96 ng/l for DDE were recorded in the near bottom layer at a shallow station (8 m depth) close to the village Novaja Matsesta in the Sochi region. The next highest total DDTs values of 2.20 ng/l and DDT of 1.36 ng/l were also recorded in the upper layer at the same station.
The spatial distribution of total DDTs group pesticides was rather uniform. The average for different zones of coastal waters was almost the same: for zone 2 ����� 0.81 ng/l, for zone 3 ����� 0.89 ng/l, zone 4 ����� 0.83 ng/l. The vertical variations were also small; the average for samples taken above 20 m depth horizon was 0.89 ng/l and slightly higher than 0.74 ng/l below 20 m. See Fig. 3.1.3 for the locations of these zones.
Among different DDTs forms and metabolites, the dominant role belonged to 4,4-DDT with the average for the whole set of data 0.42 ng/l and maximum 2.00 ng/l. The average and maximum of 2,4-DDT were 0.06/0.30 ng/l; metabolites 2,4-DDE ����� 0.04/0.27 ng/l; 4,4-DDE ����� 0.30/0.84 ng/l; 2,4-DDD ����� 0.00/0.18 ng/l; 4,4-DDD ����� 0.01/0.36 ng/l. This structure of group concentration suggests rather ���˜fresh����� DDT pollution of marine coastal waters in the region.
Table 3.2.1. Maximum and average concentration of pesticides (ng/l), and number of observations (in parantheses) in marine waters of the Black Sea in 1992 ����� 2005.
| Project | Year | Region | γ-HCH | Α-HCH | β-HCH | HCH total | DDT | DDE | DDD | DDT total | HCB* | Other |
| Monitoring[2] | 1992-1999 | Ukraine | 4.0/0.48(177) | - | - | - | 14.4/1.081(77) | 5.4/0.55(177) | 6.3/0.38(177) | - | 4.18/0.26(?**) | 3.34/0.23(?**) |
| Monitoring[3] | 2005 | Romania | 0.3/0.064(57) | - | - | - | 6.95/0.12(57) | 1.89/0.07(57) | 5.91/0.13(57) | 14.75/0.32(57) | - | - |
| IAEA Cruise [1] | 09.1998 | Western Black Sea | - | - | - | - | - | - | - | - | - | - |
| IAEA Cruise [1] | 09.2000 | Eastern Black Sea | - | - | - | - | - | - | - | - | - | - |
| Monitoring[3] | 2005 | Bulgaria | - | - | - | - | - | - | - | - | - | - |
| AeroVisual Monitoring | 2003 | Russia | 2.33/0.23(40) | 2.32/0.39(40) | 3.88/2.70(40) | 6.50/3.31(40) | 2.30/0.48(40) | 0.96/0.34(40) | 0.36/0.02(40) | 3.26/0.84(40) | 0.32/0.06(40) | 0.86/0.26(40) |
| AeroVisual Monitoring | 07-08.2004 | Russia | 3.60/0.14(80) | 0.59/0.11(80) | 4.99/3.14(80) | 7.21/3.38(80) | 1.28/0.17(80) | 0.39/0.04(80) | 0/0(80) | 1.66/0.21(80) | 0.28/0.06(80) | 0.18/0.01(80) |
| AeroVisual Monitoring | 10.2004 | Russia | 0.19/0.13(100) | 0.20/0.12(100) | 3.42/2.74(84) | 3.76/2.85(100) | 0/0(84) | 0.34/0.05(84) | 0/0(84) | 0.34/0.05(84) | 0.11/0.09(84) | 0/0(84) |
| AeroVisual Monitoring | 07.2005 | Russia | 0.35/0.16(59) | 0.68/0.43(59) | 6.81/3.98(59) | 7.80/4.55(59) | 0.64/0.15(59) | 0.23/0.02(59) | 0.77/0.08(59) | 1.29/0.20(59) | 0.14/0.07(59) | 0.18/0.09(59)PCB |
Notes: The bold number
exceed the 1 MAC = 10 ng/l.
HCB* - hexachlorobenzene,
** - the only samples treated in 1999.
0.18/0.09/59PCB - pentachlorobenzene, maximum, average and number of
samples.
The total HCH concentration was much higher than DDT and varied from 2.12 to 6.50 ng/l; the average for 40 samples was 3.31 ng/l. The highest concentrations of 6.50 and 5.78 ng/l were recorded in shallow places with 6-8 m depth close to villages Novaja Matsesta and Nizne-Nikolaevka situated between Hosta and Sochi where DDT pollution was also highest. Similar to DDT the spatial distribution of these pesticides was rather uniform. The average was 3.49 ng/l in the second zone; 2.98 ng/l in the third zone; 3.47 ng/l in the fourth. The average was 3.36 ng/l for shallow stations less than 25 m, and 2.95 ng/l for deeper stations.
Among different forms of HCH, the dominant one with the average level of 2.70 ng/l and maximum 3.88 ng/l was the β-HCH (Table 3.2.1). The lindane and α-HCH had the mean concentrations of 0.23/2.33 ng/l and 0.39/2.32 ng/l, respectively.
Hexachlorobenzene content exceeded the DL = 0.01 ng/l in 19 samples. The average for all studied area was 0.06 ng/l and the maximum reached 0.32 ng/l. Heptachlor had a maximum (0.86 ng/l) in vicinity of Sochi and the average value for all stations was 0.06 ng/l. Aldrin concentration (maximum 0.48 ng/l) was also marked near Sochi. Cischlordane concentration exceeded the DL only in 7 samples, maximum was 0.11 ng/l, cisnonachlor spreaded much wider over the whole area and was registered in 24 samples; the average was 0.14 ng/l and maximum reached 0.40 ng/l at a coastal station close to the village Chemitokvadzhe near Lazarevskoe. The concentration of octachlorstyrene, heptachlorepoxide, transchlordane, transnonachlor, photomirex and mirex did not exceed the DL in all samples.
In the second round of ���œAero visual monitoring programme���� during July-August 2004, 80 water samples were taken within the central and southern parts of the Russian coast. The total DDT concentration exceeded DL=0.05 ng/l in 39 samples and reached the maximum 1.66 ng/l at a station located 2 nautical miles away from the coast off the River Shapsukho mouth close to the town Tuapse. The average for the whole set of samples was 0.21 ng/l. The DDT content was much higher in the central part of coast in the fourth zone (average was 0.34 ng/l), 5 times lower (0.07 ng/l) in the third zone, and slightly higher in the second zone (0.16 ng/l).
Among the forms of DDT group, 4,4-DDT exceeded the DL in 36 samples and reached 0.94 ng/l and the average was 0.14 ng/l. The spatial distribution of 4,4-DDT showed a maximum (average 0.219 ng/l) in the central part of Russian coast (zone 4). It reduced southward to 0.06 ng/l in the zone 3 and was twice higher in the Sochi area (0.11 ng/l). The 2,4-DDT reached maximum 0.54 ng/l but average was as low as 0.03 ng/l. The average content of another form 4,4-DDE, although measured up to 0.39 ng/l, was 0.04 ng/l only. The 2,4-DDE was practically absent and its maximum was only 0.07 ng/l. The concentration of both DDD forms did not exceed DL in all samples.
Similar to previous year, the HCHs concentration was an order of magnitude higher than the DDT group. The maximum of total HCHs reached 7.21 ng/l and average was 3.38 ng/l. The maximum was recorded in the subsurface layer off Tuapse at a distance 7 nm from the coast. In general the HCH was distributed evenly over the investigated area of coastal waters. The averages for three different zones were very close: 3.65 ng/l for the zone 2, 3.05 ng/l for the zone 3, and 3.41 ng/l for the zone 4. Also there was no appreciable difference between the shallow and deep stations; the average was 3.52 ng/l at stations shallower than 20 m, and 3.26 ng/l for deep ones.
The maximum of β-HCH concentrations reached 4.99 ng/l and average was 3.14 ng/l. Much lower concentrations were recorded for α-HCH (0.59/0.10 ng/l) and lindane (3.60/0.14 ng/l). Among other pesticides, hexachlorobenzene was recorded rather often in all places along the Russian coast with the maximum and average concentrations of 0.28, 0.06 ng/l, respectively. Pentachlorobenzene seldom traced in the water column at a maximum concentration 0.18 ng/l. The concentrations of heptachlor, aldrin, octachlorstyrene, heptachlorepoxide, transchlordane, cischlordane, cisnonachlor, transnonachlor, photomirex and mirex did not exceed the DL in all samples.
During 9-19 October 2004, the entire Russian shelf was studied from Sochi in the south and to the Kerch Strait in the north. Among 84 samples of marine waters collected, the concentration of DDE exceeded the DL (0.05 ng/l) only in 25 cases. The average level was 0.05 ng/l. The maximum of DDE (0.34 ng/l) was measured inside the Novorossiysk port. Other forms of this group never exceeded the DL (Table 3.2.1). The HCH was again significantly higher and rather uniform. No special place or patches with high concentration was found. The average for the 100 samples was 2.85 ng/l and they varied within a narrow range from 0.90 to 3.76 ng/l and no single sample was free of these pesticides. The maximum was recorded at station placed at 2.5 miles away from the coast near the village Olginka in the zone 4. The averages for different zones varied between 2.44 and 3.17 ng/l. The mean level of α-HCH for 40 samples was 0.12 ng/l and the maximum was 0.20 ng/l. The corresponding values were 2.74 and 3.42 ng/l for β-HCH and 0.13 and 0.19 ng/l for γ-HCH. The concentrations of other pesticides did not exceed the DL in all samples with the exception of relatively high hexachlorobenzene (0.07 and 0.11 ng/l) measured in two samples from Novorossiysk Bight.
During the 4-18 July 2005 ���œAero visual monitoring���� measurement program, the DDT pesticides were found in low quantities (Table 3.2.1). However, in contrary to the previous investigations, the DDT and DDD were also recorded in the samples. The average and maximum levels of total DDT for the entire Russian coastal stations were 0.20 ng/l and 1.29 ng/l, respectively that exceed the 0.1 MAC level. The pattern of geographical distribution showed decreasing of DDT content in the waters from south to north (Table 3.2.2). The highest concentration was found in near-bottom layer of 50 m deep station in the vicinity of Katkova Szel close to Lazarevskoe (zone 3). DDTs showed a vertically uniform distribution with the equal mean concentration of 0.25 ng/l in the subsurface and near-bottom layers.
Table 3.2.2. The average concentration of chlorinated pesticides (ng/l) in the different zones of Russian costal waters in July 2005.
| Average | 2 | 3 | 4 | 5 | 6 | 7 | 8 | 9 | |
| DDT total | 0.24 | 0.43 | 0.73 | 0.21 | 0.18 | 0.40 | 0.00 | 0.04 | 0.07 |
| HCH total | 4.55 | 4.61 | 4.79 | 4.95 | 5.15 | 4.91 | 3.79 | 4.45 | 3.08 |
The concentration of pesticides from HCH group was almost 5 times higher than DDT mainly due to a high contribution of β-HCH (Table 3.2.1). The dominance of this form of HCH could be the sign of old pollution and contrasted with low lindane concentrations with the average 0.16 ng/l and the maximum 0.35 ng/l observed near Cape Codosh close to Tuapse. The concentration of β-HCH reached the maximum level 6.81 ng/l in near bottom waters at 60 m depth close to the Cape Uch-Dere and Dagomys River estuary. Their content in the near-bottom layer was slightly higher than in the surface; 4.26 ng/l and 3.73 ng/l, respectively. The HCH distribution did not exhibit a visible geographical trend. All coastal zones were almost equally polluted by HCH (Table 3.2.2).
The concentrations of chlororganic pesticides heptachlor, aldrin, octachlorstyrene, heptachlorepoxide, transchlordane, cischlordane, cisnonachlor, transnonachlor, photomirex, 1,2,3,4 TCB, 1,2,3,5 TCB, 1,2,4,5 TCB and mirex were lower then their detection limit 0.05 ng/l in all samples. Hexachlorobenzene occured in 11 samples in the range from DL to 0.14 ng/l (Table 3.2.1). Maximum content was measured in the near bottom layer at depth 47 m off the village Ashe in the zone 3. Pentachlorobenzene occurred only in five samples with the maximum 0.18 ng/l in bottom waters at 50 m depth in the vicinity of Cape Codosh in the zone 4.
Summary: The measurements of pesticide concentration in water were performed rather seldom due to their very low concentrations (Table 3.2.1) and in the frame of international monitoring programme on the Black Sea (BSIMAP) their measurements in water were optional as well as in most of the international monitoring programs. Despite the fact that most of the samples practically free from pesticides due to their concentrations below the Detection Limit (0.05 ng/l), some very condense patches were however detected. Their patchiness may be related to unusual physical conditions like stormy weather or large freshwater discharge into the sea after floods. The densest patch was recorded in Romanian coastal waters (along 5 m isobath) near town Mangalia in April 2005. In this sample the BOD5 also low probably due to the stabilization effect of high pesticides concentration on microbiological community. This patch was a local feature since no pesticides were found in the neighboring stations along 20 m isobath.
The results of Russian monitoring programs suggested very low DDT concentrations in marine waters. Their maxima reached 0.1-0.3 MAC. The DDT pollution in southern part of the Russian coastal waters was much higher than the northern part. The HCH content was about 10 times higher mainly because of the accumulation of ���˜old����� β-HCH. Nearly uniform pesticide concentrations in surface and near bottom layers support the idea of their spreading from coastal point sources.
In summary, very low level pesticide pollution was observed in coastal waters in general except some occasional patches with very high pesticides concentrations in different layers. The pollution by pesticides could be considered as an ���˜old����� pollution due to low contributions of DDT and lindane in comparison with its metabolites.
3.2.2. Bottom Sediments and Biota
During the first international cruise in September 1995, 10 samples were taken along the Ukraine coastline from the town Kerch on the eastern side of the Crimea peninsula to the Danube delta on the west (Table 3.2.3). The depths of sampling were in the range from 3 m to 78 m. The bottom sediments around Crimea (sampling sites were Karkinitsky Gulf, Balaklava, Yalta, Feodosiya, Kerch) practically free from the HCH pesticides. Their amount varied from 0.016 to 0.189 ng/g. The strong contrast was observed in sediments from the northern-western shelf. The total concentration of HCH had a minimum 1.25 ng/g, average 1.69 ng/g and maximum 2.25 ng/gin Illichevsk port, Odessa bay and Danube Delta region. Among metabolites, α-HCH and β-HCH were slightly more important than lindane. Hexachlorobenzene (HCB) had a similar spatial distribution with the average 0.221 ng/g, and the maximum 1.300 ng/gwas measured in the Danube Delta.
The DDT had extremely high concentration in the NW Shelf sediments contrary to its absence around Crimea. The maximum of total DDTs concentration reported for Odessa Bay exceeded highest level of the Crimean concentrations more then 110 times (Tabl. 3.2.3).
For the NW Shelf of the Black Sea, the historical data from the period 1992-1999 showed rather low concentrations of g-HCH in the bottom sediments. The average of the data from 182 samples was 0.38 ng/g varying in the range between analytical zero and 4.5 ng/g [2]. This data set showed lindane concentration in zooplankton at an average value of 12.74 ng/g comprising a wide range between zero and 78.92 ng/g. Similar estimation for benthic animals was one order of magnitude lower: with the average of 1.54 ng/g for the range from below the detection limit to 16.2 ng/g (Table 3.2.3). The average concentration of lindane varied within the narrow range of 0.26-0.79 ng/g during 1992-1999 (Table 3.2.3).
The average and maximum concentrations were 2.38, 54.2 ng/g for DDT, 2.65, 54.3 for DDE and 3.08, 48.8 for DDD. They were not significant except in the Danube area where their total average concentration was 20.4 ng/g exceedin the permission level, PL, almost 10 times (Table 3.2.3). Very high level of DDT group was registered in zooplankton organisms, one order of magnitude higher than in sediments. Approximately equal concentrations of DDT and its metabolites appear to indicate a mixture of new and old pollution. In all sub-regions of the NWS the total concentration of DDT averaged over the period 1992-1999 exceeded the PL for bottom sediments.
Table 3.2.3. The average concentration of pesticides in the bottom sediments in the North-Western Shelf of Ukrainian waters, ng/g.
| 1992-99[2] | Odessaregion | Dnieper-Bug | Dniester | Danube | Open part of NWS | Zoo-plankton | Zoo-benthos | Suspend-ed matter |
| g-HCH | 0.36 | 0.47 | 0.33 | 0.79 | 0.26 | 12.74 | 1.54 | 0.23 |
| DDT | 1.22 | 1.24 | 2.81 | 6.38 | 2.14 | 17.11 | ||
| DDE | 2.35 | 1.89 | 3.19 | 5.30 | 1.27 | 19.1 | ||
| DDD | 1.92 | 1.16 | 4.14 | 8.76 | 0.56 | 5.08 | ||
| DDTtotal* | 5.49 | 4.29 | 10.14 | 20.44 | 3.97 | 7.01 | 345.0 | |
| DDTtotal2000[1] | 2.50 | 19.57 | ||||||
| DDTtotal2005[3] | 18.86 | 16.52 | 6.1 | 6.5 | Sevastopol0.53 | Kerch0 | ||
- total concentration of DDT and its metabolites (sum of DDT, DDE, DDD).
The bold values show higher than the permission level (PL) according Neue Niederlandische Liste. Altlasten Spektrum 3/95: total of DDT group is 2.5 ng/g, for g-HCH is 0.05 ng/g.
Rather moderate level of the total DDT concentration (2.50 ng/g) measured at two samples of bottom sediments in June 2000 near the Tendra split of the Ukrainian Coast compared well with the previous data (Table 3.2.3). The same also occurred in the Danube region reflecting its traditional high level of DDT pesticides pollution. In the bottom sediments of the Odessa harbor the pesticides measurements in May and October 2004 showed that the g-HCH content varied from 0.12 to 0.17 ng/g of dry bottom sediments, DDT from 2.91 to 3.24 ng/g, DDE from 0.16 to 0.31 ng/g, and DDD from 0.21 to 0.39 ng/g. The important feature was the predominance of the ���œfresh����� pollution, and lower level of metabolites than DDT itself.
In the vicinity of Odessa harbor at the depth 24 m, the sediment core was sampled in 6 October 2003 and then split into 10 samples for the analysis of organic contaminants [18]. The most polluted part by pesticides of HCH group was the upper 9 cm. In this thin layer the average concentration of total HCH was 3,59 ng/g (maximum 5,04 ng/g) whereas it was only 0,42 ng/g (max 0,59 ng/g) within the rest of the core. The average value in the whole column of core was 1,69 ng/g. In general the HCH pollution of bottom sediments here was not too high and agreed with the previous data.
An opposite situation was however noted for the DDT group. These pesticides showed extremely high concentration all around the Black sea. The main feature was a ���œfresh���� character of pollution due to dominance of DDT. In the upper 9 cm its concentration reached the extremely high level of 58000 ng/g. Further below in the sediment core DDT concentration decreased almost 2000 times. The total content of the DDT group attained here 63950 ng/g or 25580 PL according the Neue Niederlandische Liste [7].
During the observation at five stations in 4-19 January 2005, an extremely high concentration of DDT and its metabolites were found in the Odessa harbor (72.83 ng/g). Without this extreme value, the average DDT content was only 3.37 ng/g. At nearby stations (Dnieper and Bug Liman), the DDT concentration was also high, 16.52 ng/g, but about three times lower in the Dniester region to the south. In general, one can note that the concentration of DDT group was relatively low in the Danube region during 2005. In the Sevastopol harbor, the total concentration of DDT was also low.
First extended investigation of bottom sediments pollution by wide spectrum of pesticides in the coastal waters of Romania was done in 1993 by sampling at 15 stations from the Danube Delta to the southern border of Romania [8]. The total concentration of HCH group for 4 stations in the Danube Delta was very high and reached the level of 40.0 ng/g with an average value of 13.15 ng/g. The maximum concentration of 3.02 ng/g was recorded near the port Constanta while the average for the marine stations was 1.48 ng/g only. The lindane (γ-HCH) was widely presented in the bottom sediments, especially in the Danube area. Its averages for Danube and the rest of Romanian coast were 8.63 and 0.65 ng/g, respectively. For α-HCH those numbers were 3.70 and 0.36 ng/g; for β-HCH ����� 0.82 and 0.46 ng/g. Pesticides of DDT group were widely presented in the bottom sediments off Romanian coast in 1993 as well. The total content was very high and reached the level 71.63 ng/g and the average for all fifteen stations was 12.73 ng/g. DDD was the second most abundant after DDT. The most polluted region by DDD was the sediments in the Danube delta (the average 16.5 ng/g, and the maximum 43.1 ng/g) followed by the Constanta port (31.5 ng/g). The average DDT concentration in the Danube delta was 7.08 ng/g and maximum ����� 20.00 ng/g. The concentration of hexachlorobenzene (HCB) varied from analytical zero to 23.00 ng/g. The most polluted region by HCB was, once again, two stations in the Danube delta and two stations near Constanta. Heptachlor, aldrin, dieldrin and endrin occurred mainly in the port Constanta with rather low concentrations in the range 0.17-0.25 ng/g.
Three sediment cores were sampled in the Danube delta and near the Constanta port in autumn 2003 [18]. The average concentration of HCH for the whole column of bottom sediments was 1.55 ng/g. Among single metabolites, lindane was less abundant. Among the sampling sites, the Danube delta was generally found much more polluted by HCH due to its high lipid content. In the Romanian shelf sediments DDTs concentration was very high with the average total content of 25.67 ng/g and maximum 83.80 ng/g. In particular, the DDT pollution in the Danube delta exceeded 10-folds the Constanta area with the respective average values of 29.48 ng/g and 2.94 ng/g. Among different forms of DDT group the DDD dominated wherever DDT had 20.3% from the total.
In April, June, July and October 2005 the average level of total concentration of pesticides from DDT group in 34 monitoring samples of bottom sediments was 0.047 ng/g. In most samples the concentration was rather low and only much higher at five stations. Its maximum was recorded in July at 5 m depth near Constanta Sud where total DDT reached 1.26 ng/g and consisted of 0.79 ng/g DDT, 0.43 ng/g DDD and 0.045 ng/g DDE. The lower values for metabolites could be a sign of ���˜fresh����� pollution. The maximum of lindane concentration (0.98 ng/g) was recorded in April 2005 at shallow place in the vicinity of Sf. Gheorghe in the Danube Delta. The second highest concentration 0.82 ng/g was also recorded during the same period in the Danube Delta near Buhaz and varied between 0.002 and 0.37 ng/g in other stations. The average for the whole data set was 0.13 ng/g.
In June, 7, 2006 during the international cruise ���œMonitoring Survey for the Black Sea ����� 2006����, bottom sediments were sampled along a transect at 1, 10, 20 and 30 nm from the city Constanta. The depth at these points was 14, 36, 45 and 53 m. The total concentration of pesticides of DDT group was rather high and varied between 1.29 and 9.87 ng/g. The highest concentrations (8.71 ����� 9.87 ng/g) were recorded in the central stations while it was much lower (1.29 ����� 1.36 ng/g) near both ends. It could be due to the size spectrum of bottom sediments particles. In the central stations, the percentage of small-size fractions less then 65 ��m was as high as 42-43.4 % while its contribution was only 32 % at other stations. The positive correlation between organic pollutants concentration and increasing the percentage of small particles is well-known.
The Total Organic Carbon (TOC) and Extracted Organic Matter (EOM) contents were also found to be higher at central stations (1.25-1.44 %; 0.110-0.270) with respect to others (0.16-0.61 %; 0.047-0.064 mg/g). Among different forms, the metabolites of DDT took the main role. The average of DDD concentration was 2.82 ng/g, DDE 1.43 ng/g and DDT only 0.46 ng/g. It could be considered as an ���˜old����� pollution by the DDT group. The total HCH concentration in the area near Constanta varied from 0.36 to 2.37 ng/g. As for other pesticides the maximum was recorded in the centre of transect. The mean lindane concentration was only 0.12 ng/g, but β-HCH reached 1.70 ng/g (average 0.77 ng/g) and α-HCH 0.38 ng/g(average 0.17 ng/g). Among other pesticides, the hexachlorobenzene (HCB) occurred in relatively high concentrations up to 0.42 ng/g and the average for four samples was 0.18 ng/g. The others, including cis Chlordane, trans Chlordane, trans-Nonachlor, Heptachlor, Aldrin, Dieldrin, Endrin, Heptachlor epoxide, Methoxychlor, a-Endosulfan, b-Endosulfan and Endosulfan sulfate, all together, did not exceed 0.20-0.22 ng/g. The total concentration of all pesticides in June 2006 was 3.59; 22.77; 22.32 and 3.67 ng/g at four stations at Constanta transect.
No routine monitoring data were available on pesticides concentration in the bottom sediments along Bulgarian coast line. These substances were not included into the national monitoring program. During international cruise ���œAssessment of Marine Pollution in the Black Sea Based on the Analysis of Sediment Cores���� 24-27 September 2003, three sediment cores were sampled in the vicinity of Bourgas, Varna and Cape Kaliakra at 15 m depth [18]. At all stations the upper 10 cm layer of bottom sediments was found to be most polluted by all types of pesticides, but the pollution level significantly decreased at deeper levels. The average total HCH concentration was measured in the upper layer as 1.27 ng/g and the highest value of 2.12 ng/g was spotted near Bourgas. The pollution level in the vicinity of Varna was comparable to Bourgas, but the Cape Kaliakra site attained significantly lower level of HCH content with an average value of 0.21 ng/g. The different forms of HCH contributed to the pollution at an almost similar rate, but the DDT took 37% of total DDTs. The average DDTs concentration in the Varna core was 8.32 ng/g, in the Bourgas area 1.98 ng/g, and reduced to 0.35 ng/g in the Cape Kaliakra site. Among other pesticides cis-chlordane, trans-nonachlor, heptachlor, aldrin and dieldrin had average concentration 0.01 ng/g, and trans-chlordane was twice higher. Almost all concentration of endrin, α-endosulfan, β-endosulfan and endosulfan sulfate was lower then detection limit (0.001 ng/g).
During international cruise in September 1995 in the Bosporus outlet area, 10 samples were taken at depth range 80-131 m [8]. Among DDT group all metabolites were presented almost in equal proportion. The total values reached 7.21 ng/g and the average was 3.54 ng/g. The concentration of pesticides from HCH group were about ten times lower in the studied area. The average level of total content for the group was 0.30 ng/g. Similar to the total DDT, its different forms were in relatively equal concentrations. No hexachlorobenzene pollution was recorded in bottom sediments. From other pesticides only aldrin (maximum concentration 0.18 ng/g) and dieldrin (maximum concentration 0.077 ng/g) were recorded in all samples. Endrin was found in a few samples but reached the maximum concentration 0.25 ng/g in one sample. Heptachlor occurred in two places with negligible amount.
In 15-19 June 2006 during the international cruise ���œMonitoring Survey for the Black Sea ����� 2006���� in vicinity of Georgian towns and rivers Batumi, Kobuleti, Natanebi, Supsa and Poti the bottom sediments were sampled at depth 60 m [9]. The total HCH average concentration for the all sampled sites was 1.01 ng/g. The ratio between metabolites was 1:2.6:7.4 for γ-HCH, α-HCH and β-HCH, respectively. The maximum and minimum HCHs were recorded near Natanebi and Batumi. Similar to other regions, DDTs concentration along Georgian coast was much higher in comparison with HCH. Maximum DDT total concentration reached 16.55 ng/g (6.6 times of the PL) close to Kobuleti. The ratio of metabolites was approximately 1:3:15 for DDT, DDE and DDD. Other chlorinated hydrocarbons were found at lower quantities: HCB (maximum 0.42 ng/g), cis-chlordane (0.04 ng/g), trans-chlordane (0.09 ng/g), trans-nonachlor (0.003 ng/g), heptachlor (0.02 ng/g), aldrin (0.002 ng/g), dieldrin (0.06 ng/g), endrin (0.04 ng/g), heptachlor epoxide (0.02 ng/g), methoxychlor (0.02 ng/g), α-endosulfan (0.02 ng/g), β-endosulfan (0.05 ng/g), endosulfan sulfate (0.05 ng/g).
Along the Russian coast, five samples of bottom sediments were taken from the depth 8 m inside of port Sochi, and 25-40 m from other sites in the area between cities Sochi and Adler close to Georgian border during the December 1995 cruise. The maximum of total content of HCH group was 0.81 ng/g. Among their metabolites the β-HCH dominated. The concentration of γ-HCH exceeded the permission level (PL) for bottom sediments almost two times [7]. The DDTs were much more abundant in the bottom sediments. Their total concentration reached 12.36 ng/g (4.9 PL). In contrary with HCH, in the metabolites structure the DDT played main role and it can be considered as a ���œfresh���� pollution.
Table 3.2.4. The concentration (ng/g) of organic pollutants in biota and bottom sediments along the Russian coast in August-September 2003.
| 2003 | Kerch Strait | Anapa | Novorossiysk | Gelendzhik+Blue | Arkhipo-Osipovka | Tuapse | Lazarevskaya | Sochi | Adler |
| HCHtotal | 0.14 | 0.05 | 0 | 0.37 | 1.29 | 0.75 | 0.81 | 0.98 | 0.94 |
| HCHbiota** | 3.11 | 2.10 | |||||||
| DDT total | 0.86 | 0.33 | 1.370 | 8.73* | 5.29* | 2.04 | 4.83* | 8.40* | 5.82* |
| DDTbiota | 0.75 | 3.74 | |||||||
| Other Pesticides | 0.20 | 0 | 0 | 0.10 | 0.38 | 0.11 | 0.31 | 0.24 | 0.18 |
- The bold value exceeds the permission level (PL) according Neue Niederlandische Liste. Altlasten Spektrum 3/95: Total of DDT group is 2.5 ng/g, for g-HCH is 0.05 ng/g[7].
- ** biota ����� Bivalvia.
Along the Russian coastline, bottom sediment pollution by organic substances was investigated in the shallow waters in June-July 2003. In the Kerch Strait near the island Tuzla, the concentration of HCH in the bottom sediments was under the detection limit (0.05 ng/g of dry material). Slightly to the south at the anchor place near the Cape Panagia, the concentration of α-HCH (0.05 ng/g) and β-HCH (0.09 ng/g) exceeded the detection limit (Table 3.2.4). At the same time all forms of HCH were 10-20 times higher in the body of bottom invertebrates; α-HCH 0.56 ng/g, β-HCH 1.99 ng/g, γ-HCH 0.56 ng/g (maximum). Not all forms of the DDT group existed in bottom sediments at significant values, but 4,4 DDE (0.60 ng/g) and 4,4 DDD (0.45 ng/g) reached rather high concentrations. This type of pesticides was however found only in a minor level in the body of mollusks in this area.
Other types of chlorinated hydrocarbons, namely heptachlor, aldrin, octachlorstyrene, heptachlorepoxide, trans-chlordane, cis-chlordane, trans-nonachlor, cis-nonachlor, photo-mirex and mirex were not recorded in sediments at this time, even if their heavy agricultural use around the Azov Sea. The only hexachlorobenzene was observed in bottom sediments near the island Tuzla with concentration 0.20 ng/g and few times more in the tissue of the benthic animals ����� 0.79 ng/g.
Slightly to the south along the coastal line (in shallow waters) at the traverse of the Bugaz Lagoon, β-HCH (0.05 ng/g), 4,4 DDE (0.16 ng/g) and 4,4 DDD (0.09 ng/g) were detected. Near the town Anapa only 4,4 DDE (0.22 ng/g) was found in sediments. In the vicinity of harbor Kabardinka, near Novorossiysk, almost all forms of the group DDT were presented in rather significant quantity ����� 2,4 DDE (0.06), 4,4 DDE (0.48), 2,4 DDD (0.24), 4,4 DDD (0.53), 2,4 DDT (0.06 ng/g). Other pesticides were below the detection limit. From two places close to the Gelendzhik Bay and Blue Bay only the latter had a visible content in sediments (α-HCH 0.08 ng/g, β-HCH 0.67 ng/g) and a high level of this group was recorded in the tissues of bottom invertebrates near Gelendzhik Bay: α-HCH 0.57 ng/g, β-HCH 1.44 ng/g, γ-HCH 0.09 ng/g. Again, sediments in the Blue Bay consisted of very high concentrations of DDT group: 2,4 DDE 0.21 ng/g, 4,4 DDE 5.21 ng/g, 2,4 DDD 1.21 ng/g, 4,4 DDD 5.04 ng/g, 2,4 DDT 0.34 ng/g, 4,4 DDT 1.99 ng/g. Maximum total DDT level of 14.00 ng/g was recorded for the whole Russian coast. In the Gelendzhik Bay these pesticides were found approximately at equal levels in bottom sediments and in biota but they were about five times lower than in the Blue Bay. Among other pesticides, only hexachlorobenzene was in relatively significant concentrations in bottom sediments (0.09 ng/g) and biota (0.20 ng/g). A slightly to south along coast in vicinity of the village Arkhipo-Osipovka the content of pesticides in bottom sediments was rather high not only for the groups HCH (α-HCH 0.05 ng/g, β-HCH 1.24 ng/g) and DDT (2,4 DDE 0.09 ng/g, 4,4 DDE 1.60 ng/g, 2,4 DDD 0.58 ng/g, 4,4 DDD 2.64 ng/g, 4,4 DDT 0.39 ng/g), but for also for phenylpolychloride (0.12 ng/g), hexachlorobenzene (0.15 ng/g) and cis-nonachlor (0.11 ng/g).
In shallow waters near the town Tuapse, the concentration of pesticides from the HCH group was not too high, α-HCH 0.08 ng/g, β-HCH 0.67 ng/g. Almost all forms of DDT were marked in bottom sediments with the maximum level 1.85 ng/g for 4,4 DDD. Also minor quantity of phenylpolychloride (0.07 ng/g) and hexachlorobenzene (0.16 ng/g) were found in a single sample. Concentrations of α-HCH (max. 0.14 ng/g) and β-HCH (max. 1.15 ng/g) were not high in the bottom sediments near ���œLazarevskaya����. The DDT group was much higher in 4 samples; the maximum reached 0.08 ng/g for 2,4 DDE, 1.70 ng/g for 4,4 DDE, 1.09 ng/g for 2,4 DDD, 4.40 ng/g for 4,4 DDD, 0.10 ng/g for 2,4 DDT and 0.68 ng/g for 4,4 DDT. The average level exceeded twice the permission level for the bottom sediments. Like in the other parts of the Russian coast, the phenylpolychloride (0.07-0.10 ng/g) and hexachlorobenzene (0.09-0.46 ng/g) were also detected in the samples. For the area around the town Sochi, the concentration of HCH in 5 samples was not high and the variation of the data was very small suggesting a rather uniform spatial distribution in this part of the basin: α-HCH varied from 0.10 to 0.14 ng/g; β-HCH varied from 0.30 to 1.16 ng/g in bottom sediments. Among DDT group, some parts of the area showed abnormally high peaks. For instance, the maximum of 4,4 DDE (3.960 ng/g) and 4,4 DDT (5.100 ng/g) were recorded in the sediments inside of the Sochi harbor. At the same time maximum 4,4 DDD concentration (6.49 ng/g) was recorded in another sample. In general, the DDT was very high in this area and comparable with the Gelendzhik and Blue Bay areas. Among other pesticides the phenylpolychloride (0.07 ng/g) and hexachlorobenzene (0.07-0.71 ng/g) were found at quantities above the detection limit. The part of the area bordering Georgia often considered as highly polluted due to high discharge from the river Mzumta. Nevertheless, the concentration of pesticides was not too high. The content of α-HCH (0.18-0.24 ng/g) and β-HCH (0.58-0.85 ng/g) was similar to other parts of this area. The same also applies for the DDT metabolites with the exception of 4,4 DDD showing a maximum 5.81 ng/g, and consequently total DDT content reached 10.28 ng/g. The hexachlorobenzene was presented in all 4 samples (0.05-0.16 ng/g, average level 0.09 ng/g); phenylpolychloride - only in two (0.17-0.19 ng/g).
The pesticides content in bottom sediments along Russian coast had several main features during August-September 2003. The concentration of g-HCH (lindane) never reached the detection limit in sediments, but this pesticide were found at large quantities in bodies of bottom invertebrates. The other isomers of HCH were widely distributed but never occurred at high quantities; maximum was less 2.00 ng/g. The DDT pesticides occurred more often at high concentration especially in the south. The maximum reached 14.00 ng/g and was beyond the permission level about 3.6 times. The average values for DDT and its metabolites (DDT 1.10 ng/g, DDE 3.07 ng/g and DDD 1.29 ng/g) clearly showed the dominance of metabolites over DDT that suggested an old pollution. Among others pesticides, only hexachlorobenzene and phenylpolychloride were generally observed in minor quantities, and cis-nonachlor and cis-chlordane were detected in bottom sediments only once.
In August and October 2004 the study of bottom sediment pollution was performed along the entire Russian coasts. In comparison with the similar investigations in 2004, a significant increase in the level of pesticides pollution was recorded in bottom sediments of the Novorossiysk, Tuapse and Sochi harbors. The maximum concentration of g-HCH and total DDT reached 0,50 ng/g (9,8 PL) and 155 ng/g (61,9 PL), respectively.
Summary: Among the chlorinated pesticides, the HCHs and DDTs were most important pollutant in bottom sediments of the Black Sea during the last several decades. They both belong to the group of very dangerous chemical substances and their consumption was prohibited long time ago in the Black Sea basin. Nevertheless, their huge amount stored in the agricultural fields or old dilapidated storage places in the past are still the source of pollution today. In the absence of the quality standards for sediment pollution in the Black Sea riparian countries, the Netherlands Permission Levels (PL) for pollutants in the sediments [7] are used as the guidelines of the pollution levels in the Black Sea sediments. The permission level is 0.05 ng/g for lindane and 2.5 ng/g for DDTs total. Based on the Russian standards for the level of Extremely High Pollution (EHP) that is "5 times higher than the level of Maximum Allowed Concentration����, the EHP levels are considered to be 0.25 ng/g for γ-HCH and 12.5 ng/g for DDTs total.
HCH pollution. Maximum lindane concentration exceeded the EHP level practically in all measurements performed during the last 13 years (Fig. 3.2.1). Each country had specific hot spots with very high lindane concentration in sediments due to fresh lindane discharges into the sea. The highest values of 4.5 ng/gin Ukrainian shelf in 1992 and 29.0 ng/g in Romanian coastal area in 1993 were never repeated again despite that highly polluted lindane patches exceeding the EHP level were recorded in Romania (the Danube Delta and port Constanta in 2003, the Danube Delta in 2005), Bulgaria (Varna and Bourgas Bays in 2003), Turkey (Bosporus Outlet in 1995), Russia (Kerch Strait in 2003, Novorossiysk harbor and estuary river Sochi in 2004), and Ukraine (the Danube Delta and Odessa Bay in1995, Odessa Bay in 2003). Maximum concentrations of HCH metabolites were usually comparable with lindane (Table 3.2.5).
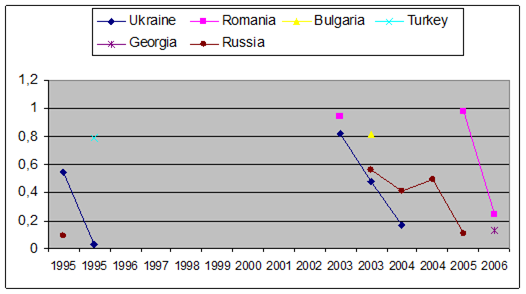
Fig. 3.2.1. The maximum concentration of γ-HCH (ng/g) in the different regions of the Black Sea (the maximums 4.5 ng/gin Ukrainian waters 1992 and 29.0 ng/gin Romanian water 1993 are not presented in the figure). The duplication of some years means different seasons of expeditions.
The average γ-HCH concentration was about two-fold lower than its extremes, nevertheless many average data exceed the PL (Fig. 3.2.2 and Table 3.2.6). Based on a rather sparse data set, it is difficult to assess the long-term trend of γ-HCH concentration in sediments of the basin. Taking into account the historical data, it is appropriate to set EHP = 0.25 ng/g as a measure of extremely high local pollution of γ-HCH.
Table 3.2.5. Maximum and mean concentration of pesticides (ng/g), and number of measurements (in parentheses) in the bottom sediments of the Black Sea in 1993 ����� 2006.
| Project | Year | Region | γ-HCH | α-HCH | β-HCH | HCH total | DDT | DDE | DDD | DDT total | HCB* | Depth range |
| Monitoring[2] | 1992-1999 | Ukraine | 4.5/0.38 (182) | - | - | - | 54.2/2.38(182) | 54.3/2.65(182) | 48.8/3.08(182) | - | - | - |
| Screening[8] | 1995 | Ukraine,NW Shelf | 0.55/0.33(4) | 1.10/0.74 (4) | 0.90/0.63 (4) | 2.25/1.69(4) | 20.00/11.74 (4) | 4.47/2.56(4) | 40.50/23.68(4) | 65.0/38.0(4) | 1.30/0.54 (4) | 3-17 m |
| Screening[8] | 1995 | Ukraine,Crimea | 0.027/0.016 (6) | 0.048/0.015 (6) | 0.14/0.038 (6) | 0.19/0.07(6) | 0.002/0.01(6) | 0.28/0.13(6) | 0.38/0.18(6) | 0.59/0.31 (6) | 0.024/0.01(6) | 6-78 m |
| Monitoring | 2000 | Ukraine | - | - | - | - | - | - | - | 19.6/11.0(2) | - | 18-23 m |
| Screening [18] | 2003 | Ukraine(0-9 cm) | 0.82/0.55(4) | 0.56/0.43 (4) | 3.90/2.60(4) | 5.04/3.59(4) | 58000/16224(4) | 2840/815(4) | 3110/1155(4) | 63950/18194(4) | 0.42/0.34(4) | 24.0 |
| Screening [18] | 2003 | Ukraine(9-36 cm) | 0.48/0.31(6) | 0.09/0.06(6) | 0.08/0.05(6) | 0.59/0.42(6) | 29.60/8.58(6) | 5.20/1.55(6) | 6.90/2.77(6) | 41.7/12.9(6) | 0.33/0.20(6) | 24.0 |
| Monitoring | 2004 | Ukraine, Odessa | 0.17/-(-) | - | - | - | 3.24/-(-) | 0.31/-(-) | 0.39/-(-) | - | - | - |
| Monitoring | 2005 | Ukraine | - | - | - | - | - | - | - | 72.8/12.4(10) | - | 2-23 m |
| Screening[8] | 1993 | Romania | 29.00/2.78(15) | 8.60/1.25(15) | 2.40/0.56(15) | 40.00/4.59(15) | 20.00/2.43(15) | 8.53/2.28(15) | 43.1/8.02(15) | 71.6/12.7(15) | 23.00/2.28(15) | - |
| Screening [18] | 2003 | Romania | 0.94/0.37(27) | 2.10/0.50(27) | 2.00/0.71(27) | 5.04/1.55(27) | 41.20/5.20(27) | 7.00/2.61(27) | 57.00/17.86(27) | 83.80/25.67(27) | 22.00/1.87(27) | 14-18 m |
| Monitoring | 2005 | Romania | 0.98/0.13(34) | - | - | - | 0.79/0.03(34) | 0.05/0.004(34) | 0.43/0.014(34) | 1.26/0.047(34) | - | 0-20 m |
| Screening [9] | 2006 | Romania | 0.24/0.12(4) | 0.38/0.17(4) | 1.70/0.77(4) | 2.37/1.08(4) | 0.89/0.46(4) | 2.78/1.42(4) | 5.10/2.82(4) | 9.87/5.31(4) | 0.42/0.18(4) | 14-53 m |
| Screening [18] | 2003 | Bulgaria | 0.81/0.23(28) | 0.42/0.18(28) | 0.90/0.32(28) | 2.12/0.74(28) | 5.23/1.08(28) | 3.9/1.24(28) | 7.0/1.87(28) | 14.0/4.18(28) | 10.00/0.94(28) | 15.0-15.8 m |
| Screening[8] | 1995 | Turkey | 0.79/0.14(10) | 0.21/0.09(10) | 0.22/0.07(10) | 1.10/0.30(10) | 1.54/1.15(4) | 2.85/1.49(7) | 4.32/2.03(10) | 7.21/3.54(10) | 0.25/0.09(10) | 80-131 m |
| Screening [9] | 2006 | Georgia | 0.13/0.09(5) | 0.41/0.23(5) | 1.10/0.67(5) | 1.63/1.01(5) | 0.89/0.41(5) | 2.78/1.10(5) | 13.3/3.35(5) | 16.55/5.4(5) | 0.42/0.17(5) | 60 m |
| Screening[8] | 1995 | Russia, Sochi | 0.09/0.05(5) | 0.19/0.15(5) | 0.56/0.36(5) | 0.81/0.57(5) | 8.69/3.43(5) | 2.74/1.60(5) | 5.56/2.86(5) | 12.36/7.8(9)(5) | 0.26/0.08(5) | 8-40 m |
| Aero-Visual Monitoring | 2003 | Russia** | 0.56/0.03(25) | 0.57/0.13/25 | 1.99/0.68(25) | 3.11/0.83(25) | 5.73/0.71(25) | 5.42/1.25(25) | 7.88/2.82(25) | 14.0/4.78(25) | 1.26/0.20(25) | 6-100 m |
| Aero-Visual Monitoring | 2004August | Russia | 0.41/0.04(22) | 1.07/0.20(22) | 1.57/0.64(22) | 3.06/0.88(22) | 25.87/4.84(22) | 10.97/2.98(22) | 72.79/9.53(22) | 89.0/17.34(22) | 1.30/0.43(22) | 6-68 m |
| Aero-Visual Monitoring | 2004October | Russia | 0.49/0.07(12) | 0.44/0.15(12) | 0.89/0.40(12) | 1.63/0.63(12) | 28.43/11.89(12) | 40.24/9.38(12) | 120.13/28.9(12) | 154.7/50.17(12) | 0.89/0.30(12) | 5-25 m |
| Aero-Visual Monitoring | 2005July | Russia | 0.11/0.04(8) | 0.32/0.15(8) | 0.69/0.41(8) | 0.86/0.59(8) | 2.07/0.82(8) | 7.20/3.24(8) | 8.82/3.96(8) | 18.09/8.01(8) | 0.50/0.25(8) | 9-52 m |
HCB* - hexachlorobenzene
Russia** - averaged for all Russian coastal waters in 2003.
Table. 3.2.6. The repetitions of high γ-HCH concentration in the bottom sediments exceeds the PL 0.05 ng/g in the different sets of samples (in per cent).
| Project | Year | Region | Max γ-HCH (ng/g) | Average γ-HCH (ng/g) | γ-HCH > PL 0.05 ng/g(%) |
| Screening | 1995 | Ukraine, NW Shelf | 0.55 | 0.33 | 100 |
| Screening | 1995 | Ukraine, Crimea | 0.027 | 0.016 | 0 |
| Screening | 2003 | Ukraine (0-9 cm) | 0.82 | 0.55 | 100 |
| Screening | 2003 | Ukraine (9-36 cm) | 0.48 | 0.31 | 100 |
| Screening | 1993 | Romania | 29.0 | 2.78 | 100 |
| Screening | 2003 | Romania | 0.94 | 0.37 | 100 |
| Monitoring | 2005 | Romania | 0.98 | 0.13 | 41.1 |
| Screening | 2006 | Romania | 0.24 | 0.12 | 75 |
| Screening | 2003 | Bulgaria | 0.81 | 0.23 | 100 |
| Screening | 1995 | Turkey | 0.79 | 0.14 | 50 |
| Screening | 2006 | Georgia | 0.13 | 0.09 | 80 |
| Screening | 1995 | Russia, Sochi | 0.09 | 0.05 | 50 |
| Monitoring | 2003 | Russia | 0.56 | 0.03 | 4 |
| Monitoring | 2004 | Russia, Southern | 0.41 | 0.04 | 22.7 |
| Monitoring | 2004 | Russia, Northern | 0.49 | 0.07 | 50 |
| Monitoring | 2005 | Russia | 0.11 | 0.04 | 50 |
DDT pollution. Similar to the HCH group, maximum concentration of the DDTs group in sediments exceeded the EHP level of 12.5 ng/g practically at all regions of the Black Sea (Fig. 3.2.3). Enormously high pollution (63950 ng/g) in the Odessa area in 2003 can only be explained as an accidental event. Nevertheless, other sites in coastal zones around the Black Sea were also highly polluted by DDTs. Those ���œhot spots���� are - Danube Delta, Odessa Bay and Illichevsk port (1995), Danube River mouth (2000), Odessa Bay (2003), Odessa and Uzhnui ports, Dniepr and South Bug Mouth (2005) in Ukraine; the Danube Delta, port Constanta and Sinoe (1993), Sf.Gheorghe and Sulina (2003) in Romania; ����� Varna (2003) in Bulgaria; Kobuleti (2006) in Georgia; Sochi port and Adler Canyon (1995), Sochi harbour, Sochi river estuary, Tuapse river estuary, Loo village, Blue Bight (Gelendzhik), Novorossiysk harbor (2003) in Russia (Fig. 3.2.4).
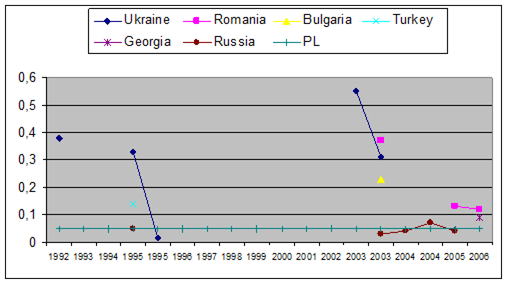
Fig. 3.2.2. The repetition factor of exceeding of PL by average concentration of γ-HCH (ng/g) in the bottom sediments of different regions of the Black Sea. The outstanding 2.78 ng/gin Romania 1993 is not presented in the figure. The duplication of some years means different seasons of expeditions. The Permission Level is 0.05 ng/g.
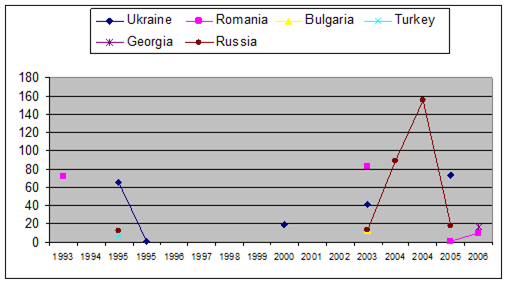
Fig. 3.2.3. The maximum concentration of pesticides DDTs group (ng/g) in the bottom sediments of different regions of the Black Sea (the maximum 63950 ng/gin Ukrainian waters 2003 is not presented in the figure). The duplication of some years means different seasons of expeditions. Total number of analyzed bottom sediments samples is 217.
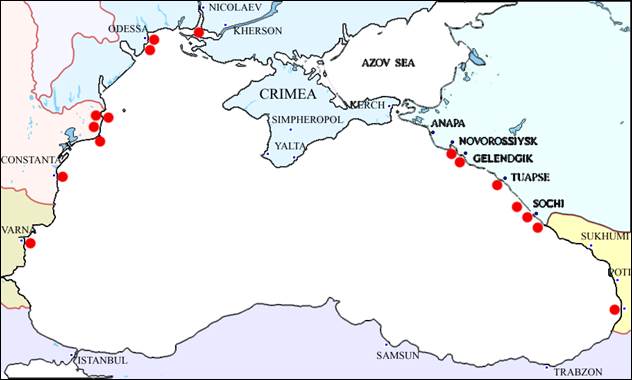
Fig. 3.2.4. The ���œhot spot���� sites in the coastal zone of the Black Sea with total DDTs concentration in sediments exceeding the level of Extremely High Pollution (12.5 ng/g) level during 1993-2006.
Table. 3.2.7. The repetitions of high DDTs concentration in the bottom sediments exceeds the PL 2.5 ng/g in the different sets of samples (in per cent).
| Project | Year | Region | Max DDTs (ng/g) | Average DDTs (ng/g) | DDTs > PL 2.5 ng/g(%) |
| Screening | 1995 | Ukraine, NW Shelf | 64.97 | 37.97 | 100 |
| Screening | 1995 | Ukraine, Crimea | 0.59 | 0.31 | 0 |
| Monitoring | 2000 | Ukraine | 19.57 | 11.03 | 100 |
| Screening | 2003 | Ukraine (0-9 cm) | 63950 | 18194 | 100 |
| Screening | 2003 | Ukraine (9-36 cm) | 41.7 | 12.9 | 83.3 |
| Monitoring | 2005 | Ukraine | 72.83 | 12.40 | 40 |
| Screening | 1993 | Romania | 71.63 | 12.73 | 100 |
| Screening | 2003 | Romania | 83.8 | 25.67 | 77.8 |
| Monitoring | 2005 | Romania | 1.26 | 0.05 | 0 |
| Screening | 2006 | Romania | 9.87 | 5.31 | 50 |
| Screening | 2003 | Bulgaria | 14.03 | 4.18 | 46.4 |
| Screening | 1995 | Turkey | 7.21 | 3.54 | 70 |
| Screening | 2006 | Georgia | 16.55 | 5.37 | 60 |
| Screening | 1995 | Russia, Sochi | 12.36 | 7.89 | 100 |
| Monitoring | 2003 | Russia | 14.03 | 4.18 | 64.0 |
| Monitoring | 2004 | Russia, Southern | 89.0 | 17.34 | 81.8 |
| Monitoring | 2004 | Russia, Northern | 154.71 | 50.17 | 83.8 |
| Monitoring | 2005 | Russia | 18.09 | 8.01 | 87.5 |
High level of pollution by pesticides from DDTs group in bottom sediments are also clearly evident in the data set consisting of 222 samples since 1995. Almost all samples collected in the coastal zone around the Black Sea showed total concentration of pesticides of DDT group higher than 50% of the Permission Level. The relatively low concentrations in sediments around the Crimea peninsula should be related to their low level discharges from local rivers into the sea, even though the usage of pesticides in grape and wine manufacturing is common in the region. Along the Russian coast with highly developed wine industry (e.g. Gelendzhik region), the pollution by DDTs pesticides in general much higher. When the entire data set was taken into account, 61.3% of samples contained the DDTs concentration comparable with its PL level of 2.5 ng/g (Table 3.2.7).
As a conclusion, practically the entire coastal waters around the sea contained a very high level of DDTs pollution in bottom sediments without any clear indication of reduction in such highly dangerous anthropogenic pollution.
Other pesticides were close to their detection limits for all costal zones of the Black Sea, except rather high concentrations of hexachlorobenzene in sediments along the Romanian and Bulgarian coasts (Table 3.2.7). It could be clear the absence of worries concerning different marked in the bottom sediments usually. The content of these modern chlorinated pesticides in the Black Sea therefore contradicted with high concentration of lindane and DDT.
3.3. The State Of Trace Metals
���������� Alexander Korshenko
State Oceanographic Institute, Moscow, RUSSIA
Ukrainian Scientific Centre of the Ecology of Sea, Odessa, UKRAINE
B.Gvakharia and Nino Machitadze
���œGamma����, Tbilisi, GEORGIA
Andra Oros
National Institute for Marine Research and Development, Constanta, ROMANIA
3.3.1. Ukrainian sector of the Black Sea - Northwestern region
Water: The most recent trace metals measurements in Ukrainian coastal waters were performed within the framework of the marine ecological monitoring programme in December 2004-January 2005. These measurements clearly indicated a low level trace metal pollution in coastal waters. The trace metal contents at all measurement sites were typically one or two order of magnitude below the Maximum Allowed Concentration (MAC) accepted for Ukrainian waters (Table 3.3.1).
According to the earlier measurements conducted during 1995-2000, trace metal concentrations in different marine waters of the northwestern Black Sea were also found to be rather low. These concentrations represented the sum of the dissolved and suspended forms due to the conservation of samples aboard by nitric acid. A summary of the trace metal levels are provided below.
Cadmium: The contamination of marine waters by cadmium could be evaluated as insignificant since its concentration was persistently 30-50 times lower than the MAC value in all investigated regions, except the dredged materials dumping site close to Odessa where maximum cadmium concentration near the bottom reached 0,56 ��g/l in 1999 (Fig. 3.3.1).
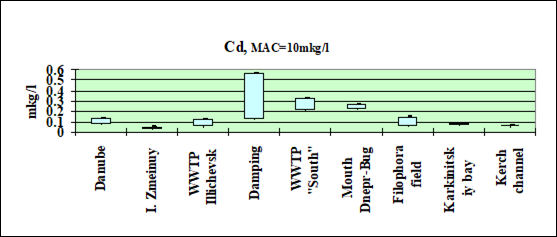
Fig. 3.3.1 Concentration of cadmium (��g/l) in Ukrainian marine waters in 1995-2000.
Mercury: Like cadmium, mercury concentration did not exceed 0.1 MAC (Fig. 3.3.2) except the damping sites where it was roughly 0.2 MAC.
Lead: Maximum lead concentration of 17.0 ��g/l exceeded 1 MAC level by 1.7 times only at the Waste Waters Treatment Plant (WWTP) site of the town Illiechevsk in 2000 (Fig. 3.3.3). In other regions of the Black Sea, concentration in marine waters varied mainly in the range 0.5-2.0 ��g/l with slightly higher values in the Danube discharge region (3.1 ��g/l) and Dnieper- South Bug lagoon (5.2 ��g/l).
Table 3.3.1. The trace metals concentration (��g/l) in Ukrainian waters of the Black Sea in December 2004 - January 2005 (25th cruise of R/V ���œVladimir Parshin����).
| No of station | Areas | Hg | Cd | Co | Cu | Pb | Zn | As | Fe |
| MAC (��g/l) | 0,1 | 10 | 5 | 5 | 10 | 50 | 10 | 50 | |
| 1 | External raid of Odessa port | 0,012 | 0,06 | <0,5 | 3,0 | 5,8 | 11,3 | 1,8 | <50 |
| 3 | Waste waters discharge ���œNorth���� in Odessa | 0,012 | 0,09 | <0,5 | 1,0 | 9,3 | 7,1 | 1,6 | <50 |
| 4 | Mouth of port Yuzhny in Odessa Bay | <0,010 | <0,05 | <0,5 | 1,8 | 1,7 | 2,0 | 2,0 | <50 |
| 6 | Mouth of Dnieper -Bug lagoon | <0,010 | <0,05 | <0,5 | 2,0 | 1,9 | 5,8 | 1,2 | <50 |
| 8 | Odessa shallows | <0,010 | <0,05 | <0,5 | 0,6 | 2,5 | 3,5 | 1,5 | <50 |
| 10 | Odessa shallows | <0,010 | <0,05 | <0,5 | 0,9 | <1,0 | 2,1 | 1,6 | <50 |
| 11 | Place of damping | <0,010 | <0,05 | <0,5 | 0,4 | <1,0 | 1,4 | 2,0 | <50 |
| 12 | Waste waters discharge ���œSourth���� in Odessa | 0,011 | 0,08 | <0,5 | 2,0 | <1,0 | 2,8 | 1,4 | <50 |
| 13 | Mouth of port Illiechevsk in Odessa Bay | <0,010 | 0,08 | <0,5 | 0,7 | <1,0 | 0,5 | 1,9 | <50 |
| 14 | Place of damping | <0,010 | 0,15 | <0,5 | 2,1 | 1,7 | 3,8 | 2,2 | <50 |
| 15 | Mouth of Dniestr lagoon | <0,010 | <0,05 | <0,5 | 0,7 | <1,0 | 7,4 | 1,2 | <50 |
| 24 | Centre of Northern-Western shelf | <0,010 | 0,07 | <0,5 | 2,3 | <1,0 | 2,1 | <1,0 | <50 |
| 30 | Mouth of Danube (north) | <0,010 | <0,05 | <0,5 | 1,7 | 1,2 | 4,9 | 1,4 | <50 |
| 56 | Cup Tarkhankut in Crimea | <0,010 | 0,06 | <0,5 | 0,7 | <1,0 | 5,4 | 2,0 | <50 |
| 60 | Yalta | <0,010 | <0,05 | <0,5 | 0,3 | <1,0 | 1,7 | <1,0 | <50 |
| 73 | Kerch Strait (centre) | <0,010 | <0,05 | <0,5 | 0,7 | <1,0 | 2,5 | 1,2 | <50 |
| 75 | Kerch Strait (exit) | <0,010 | <0,05 | <0,5 | 1,3 | <1,0 | 4,1 | 1,4 | <50 |
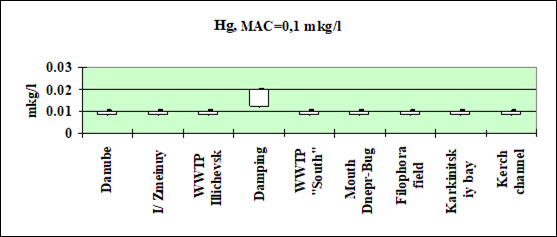
Fig. 3.3.2 Concentration of mercury (��g/l) in Ukrainian marine waters in 1995-2000.
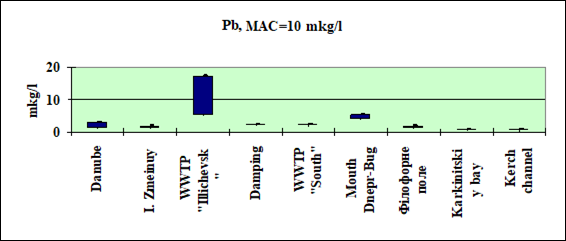
Fig. 3.3.3. Concentration of lead (��g/l) in Ukrainian marine waters in 1995-2000.
Zinc: Concentration of zinc higher then 1 MAC was observed in the dumping area (145 ��g/l) and the Illiechevsk WWTP site, where the maximum concentration (823 ��g/l, more than16 MAC) was measured in 2000 (Fig. 3.3.4). In comparison with other areas, zinc concentration attained slightly higher values of 20 ��g/l and 30 ��g/l in the Danube and Dniepr estuaries, respectively.
Copper: In four of the total 11 measurement sites, copper concentration in marine water was higher then 1 MAC. These sites are as follows: near Odessa WWTP ���œSouth���� (1.4 MAC), damping site (1.6 MAC), Dnieper and Bug estuarine zone (5.0 MAC) and the Illiechevsk WWTP (30 MAC) (Fig. 3.3.5).
Arsenic: Concentration of this metal in marine waters was insignificant and did not exceed 1 MAC. In comparison with other places, the arsenic content was slightly higher in the Danube estuarine waters and in Karkinitsky Gulf (Fig. 3.3.6).
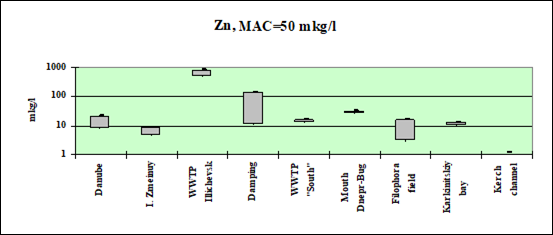 ��
��Fig. 3.3.4 Concentration of zinc (��g/l) in Ukrainian marine waters in 1995-2000.
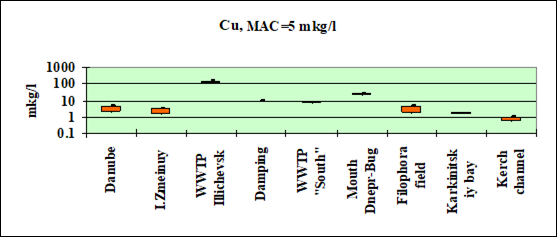 ��
��Fig. 3.3.5 Concentration of copper (��g/l) in Ukrainian marine waters in 1995-2000.
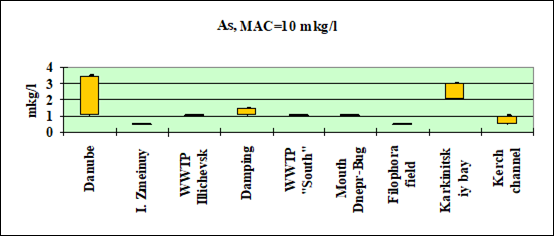 ��
��Fig. 3.3.6 Concentration of arsenic (��g/l) in Ukrainian marine waters in 1995-2000.
Chromium. Chromium concentration was below 1 MAC level at all measurement sites with the highest concentration of 2.8 ��g/l in the Danube discharge area and 1.0 ��g/l in the Odessa damping site and the WWTP ���œSouth���� site (Fig. 3.3.7).
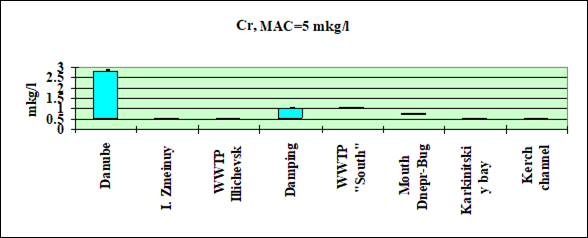 ��
��Fig. 3.3.7 Concentration of chromium (��g/l) in Ukrainian marine waters in 1995-2000.
In summary, higher metal concentrations were observed mostly in coastal areas with clear anthropogenic influence from the main land-base sources. They were, however, lower than the MAC levels. In the open areas of the Black Sea, they were close to their natural background values.
Bottom Sediments: The current data on metals concentration in the bottom sediments in the Ukrainian coastal zone of the northwestern Black Sea were obtained during the R/V ���œVladimir Parshin���� cruise in December 2004-January 2005. In contradiction with marine waters, bottom sediments often showed a rather high level metal pollution with maximum concentrations measured in the Danube discharge region (Table 3.3.2). Even though mercury content, known to be the most toxic metal, never exceeded the Permission Level (PL), it increased significantly close to the Odessa port, the vicinity of Danube estuarine zone, and the Crimean cities Sevastopol and Alushta. Cadmium concentration varied in the range from 0.1 PL to 0.7 PL measured in the Danube discharge region. A similar distribution was also noted for cobalt where data from different sites varied between 3.1 and 12.1 ��g/g (0.2-0.6 PL).
On the contrary, copper concentration in bottom sediments, in general, was high and exceeded the PL in 8 cases; close to the Odessa port (82 μg/g), the dumping site, the Danube discharge area, and the vicinity of Crimean towns Sevastopol, Balaklava, Yalta and Alushta. The average for the Ukrainian shelf was 26.36 μg/g. Lead concentration varied in the range of 5.2-46.2 μg/g, and the average was 20.92 μg/g. This level was significantly less than the threshold. Zinc concentration exceeded the PL more than twice in the dumping place and only slightly in the Danube estuarine region. The North-Western shelf was not found to be polluted by arsenic. Its content was high only near Crimea and in the Kerch Strait. Pollution of bottom sediments by chromium exceeded the PL at several sites. Maximum level of metal pollution was noted for nickel. Its content varied from 7.0 up to71.7 μg/g with an average value of 31.06 μg/g. Its concentration therefore was higher than its PL in 16 cases from 39 samples (41%).
Table 3.2. The trace metals concentration (��g/g) in the bottom sediments of Ukrainian part of the Black Sea in December 2004 - January 2005 (25 cruise of R/V ���œVladimir Parshin����).
| N of station | Areas | Hg | Cd | Co | Cu | Pb | Zn | As | Cr | Ni | Al* |
| PL (��g/g) [7] | 0.3 | 0.8 | 20 | 35 | 85 | 140 | 29 | 100 | 35 | n.a | |
| 1 | External raid of Odessa port | 0.150 | 0.49 | 7.3 | 81.9 | 26.2 | 117 | 9.00 | 164 | 27.0 | 28900 |
| 3 | Waste waters discharge ���œNorth���� in Odessa | 0.037 | 0.20 | 3.1 | 6.30 | 5.20 | 38.0 | 6.20 | 12.4 | 7.0 | 5640 |
| 4 | Mouth of port Yuzhny in Odessa Bay | 0.034 | 0.41 | 8.1 | 34.8 | 25.4 | 97.6 | 11.4 | 63.8 | 43.6 | 30300 |
| 6 | Mouth of Dnieper - Bug lagoon | 0.034 | 0.35 | 4.7 | 19.8 | 12.1 | 61.7 | 5.70 | 40.0 | 9.2 | 21600 |
| 8 | Odessa shallows | 0.038 | 0.42 | 6.5 | 31.2 | 30.3 | 78.1 | 1.5 | 67.4 | 35.4 | 27300 |
| 10 | Odessa shallows | 0.50 | 5.3 | 27.9 | 18.9 | 59.9 | 6.50 | 71.6 | 15.7 | 30600 | |
| 11 | Place of damping | 0.020 | 0.25 | 8.2 | 19.7 | 16.5 | 64.1 | 7.30 | 72.6 | 17.7 | 38900 |
| 12 | Waste waters discharge ���œSourth���� in Odessa | 0.098 | 0.38 | 7.2 | 31.8 | 24.8 | 97.3 | 6.00 | 89.5 | 28.0 | 27600 |
| 13 | Mouth of port Illiechevsk in Odessa Bay | 0.056 | 0.34 | 6.4 | 28.8 | 22.3 | 88.8 | 14.4 | 135 | 37.8 | 28200 |
| 14 | Place of damping | 0.063 | 0.39 | 7.5 | 39.7 | 29.7 | 302 | 10.2 | 71.8 | 29.5 | 33500 |
| 15 | Mouth of Dniestr lagoon | 0.021 | 0.12 | 3.1 | 4.60 | 8.00 | 29.7 | 2.80 | 32.0 | 10.6 | 12600 |
| 24 | Centre of Northern-Western shelf | 0.020 | 0.10 | 3.0 | 8.87 | 9.87 | 22.0 | 3.4 | 13.4 | 20.1 | 6540 |
| 29 | Mouth of Sasyuk lake | 0.094 | 0.28 | 6.7 | 30.8 | 29.1 | 92.7 | 15.7 | 69.2 | 36.9 | 30600 |
| 30 | Mouth of Danube (north) | 0.067 | 0.17 | 4.7 | 9.60 | 10.8 | 34.8 | 2.60 | 26.6 | 16.0 | 18800 |
| 34 | Mouth of Danube (north) | 0.250 | 0.52 | 9.6 | 54.2 | 37.3 | 144 | 10.4 | 108 | 60.6 | 45600 |
| 35 | Mouth of Danube (south) | 0.283 | 0.58 | 10.6 | 71.6 | 46.2 | 177 | 16.1 | 120 | 71.7 | 53000 |
| 39 | Mouth of Danube (east) | 0.048 | 0.15 | 6.1 | 16.2 | 18.1 | 51.6 | 9.00 | 46.7 | 21.0 | 23900 |
| 40 | Mouth of Danube (east) | 0.025 | 0.09 | 3.1 | 8.48 | 9.10 | 24.5 | 6.40 | 22.0 | 14.2 | 16600 |
| 41 | Mouth of Danube (east) | 0.042 | 0.10 | 3.9 | 11.1 | 11.7 | 30.8 | 6.20 | 24.6 | 14.8 | 15400 |
| 42 | Mouth of Danube (east) | 0.041 | 0.16 | 3.2 | 12.2 | 11.3 | 26.6 | 5.30 | 18.1 | 11.7 | 12200 |
| 43 | Mouth of Danube (east) | 0.058 | 0.14 | 5.4 | 15.1 | 13.0 | 46.8 | 7.80 | 38.2 | 23.4 | 19700 |
| 44 | Mouth of Danube (east) | 0.049 | 0.21 | 7.4 | 24.6 | 18.8 | 67.8 | 12.2 | 68.8 | 34.6 | 29800 |
| 45 | Mouth of Danube (east) | 0.064 | 0.20 | 5.5 | 18.3 | 18.1 | 56.4 | 12.2 | 41.8 | 19.7 | 23300 |
| 46 | Mouth of Danube (east) | 0.142 | 0.37 | 9.2 | 35.4 | 44.2 | 115 | 20.4 | 88.2 | 47.7 | 30000 |
| 47 | Mouth of Danube (east) | 0.042 | 0.18 | 5.4 | 20.4 | 13.2 | 58.6 | 13.1 | 45.9 | 33.5 | 18500 |
| 49 | Mouth of Danube (east) | 0.038 | 0.16 | 5.3 | 16.9 | 6.10 | 35.5 | 10.1 | 20.2 | 22.2 | 9460 |
| 54 | Karkinitskiy Gulf | 0.020 | 0.16 | 3.3 | 12.3 | 17.5 | 44.2 | 6.40 | 52.3 | 44.5 | 26800 |
| 56 | Cup Tarkhankut in Crimea | 0.030 | 0.16 | 5.8 | 30.2 | 28.1 | 76.9 | 5.30 | 53.1 | 30.1 | 31400 |
| 57 | Mouth of port Sevastopol | 0.136 | 0.24 | 8.1 | 39.7 | 24.1 | 97.0 | 25.2 | 77.5 | 42.1 | 53400 |
| 58 | Mouth of port Balaklava | 0.085 | 0.20 | 7.8 | 38.6 | 32.0 | 101 | 24.0 | 81.5 | 41.1 | 50800 |
| 60 | Yalta | 0.072 | 0.17 | 9.2 | 37.6 | 27.4 | 110 | 13.9 | 86.0 | 55.3 | 35000 |
| 61 | Alushta | 0.205 | 0.14 | 10.5 | 35.6 | 32.0 | 120 | 31.5 | 106 | 46.2 | 62200 |
| 62 | Feodosia | 0.075 | 0.20 | 9.1 | 34.7 | 24.0 | 108 | 14.8 | 94.1 | 45.4 | 50200 |
| 69 | Kerch Strait (centre) | 0.019 | 0.13 | 6.5 | 8.60 | 14.6 | 61.6 | 6.40 | 81.0 | 14.5 | 25600 |
| 70 | Kerch Strait (centre) | 0.020 | 0.08 | 6.0 | 4.70 | 11.4 | 42.1 | 10.5 | 81.6 | 17.0 | 25600 |
| 71 | Kerch Strait (centre) | 0.028 | 0.09 | 6.0 | 6.80 | 10.2 | 53.5 | 45.2 | 49.3 | 15.2 | 17900 |
| 73 | Kerch Strait (centre) | 0.086 | 0.22 | 11.9 | 31.9 | 25.2 | 113 | 15.6 | 97.2 | 51.5 | 53200 |
| 74 | Kerch Strait (centre) | 0.060 | 0.27 | 12.1 | 33.7 | 26.2 | 120 | 22.2 | 108 | 48.7 | 64400 |
| 75 | Kerch Strait (exit) | 0.059 | 0.32 | 10.8 | 33.5 | 27.0 | 118 | 10.6 | 106 | 50.3 | 51200 |
* - Aluminum used only as indicator of fine fraction of bottom sediments
n.a ����� not available
Trace metal concentrations in bottom sediments of the Phyllophora field occupying the central part of the northwestern shelf was monitored during July-August 2007 (26th cruise of R/V ���œVladimir Parshin����). This data set indicated low level of mercury, cadmium, lead, arsenic and chromium pollution (Table 3.3.3). Nickel concentration exceeded the PL in 75% of the samples and reached the maximum 92.1 ��g/g. Copper concentration was also above PL in 50% of the samples but the level of pollution wasn�����t too high. Cobalt and arsenic in bottom sediments were detected in moderate levels, mostly below the PL.
In general for the Ukrainian coastal zone not too much cases of high pollution of bottom sediments were noted during last 10 years. The copper and chromium pollutions were wide spread over the NWS (Fig. 3.3.8a,b). High chromium concentration was also found along the Crimea coast. Over the last decade the tendency of decreasing of maximum mercury and cadmium concentration in the Danube region were noted. No appreciable level of lead pollution was registered in bottom sediments.
3.3.2. Russian sector of the Black Sea - Northeastern region
Bottom Sediments: Metal concentration measurements in bottom sediments performed in June-July 2002 to the south of Taman showed large variations irrespective of sampling depths at 20m, 40m, 70m, and 100m (Table 3.3.4). Minimum concentrations of aluminum, vanadium, chromium, manganese, nickel, copper and arsenic were measured at 40 m depth. The opposite case occurred at 70 m depth where these elements attained maximum values, except manganese. Lead concentration increased to nearly 7.6 μg/g along the shore at 20m depth. The cadmium was below the detection limit at all sites.
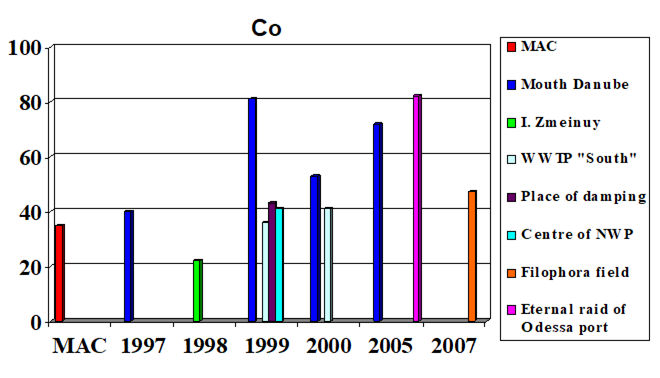
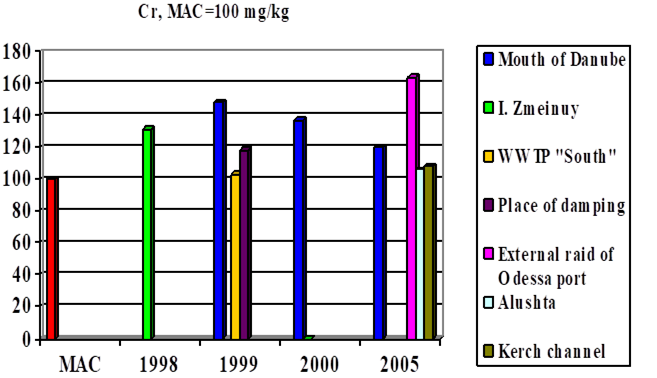
Figure 3.3.8. The high copper and chromium concentration (��g/g) in the bottom sediments of Ukrainian part of the Black Sea.
Table 3.3.3 The trace metal concentration (��g/g) in the bottom sediments of Phyllophora field and NW Shelf of the Black Sea in July-August 2007 (26 cruise of R/V ���œVladimir Parshin����).
| Hg | Cd | Co | Cu | Pb | Zn | As | Cr | Ni | ||
| PL (��g/g) [7] | ||||||||||
| Number�� of stations | Depthm | 0.3 | 0.8 | 20 | 35 | 85 | 140 | 29 | 100 | 35 |
| 2 | 32 | <0.001 | 0.02 | 0.92 | 1.60 | 3.60 | 5.3 | 0.98 | 4.30 | 7.5 |
| 39 | 0.043 | 0.30 | 8.13 | 34.8 | 28.9 | 73.7 | 6.90 | 41.4 | 46.2 | |
| 45 | 0.039 | 0.33 | 12.2 | 44.0 | 37.0 | 96.2 | 8.00 | 55.1 | 55.9 | |
| 75 | 0.020 | 0.17 | 4.90 | 12.7 | 10.2 | 35.3 | 4.00 | 13.1 | 24.2 | |
| 84 | 44 | 0.023 | 0.29 | 7.92 | 27.5 | 19.4 | 57.2 | 5.90 | 25.2 | 41.6 |
| 142 | 39 | 0.033 | 0.31 | 11.2 | 27.4 | 19.9 | 80.3 | 8.80 | 32.3 | 49.0 |
| 157 | 39 | 0.032 | 0.27 | 10.4 | 22.6 | 26.2 | 66.2 | 5.30 | 29.2 | 35.4 |
| 177 | 0.088 | 0.31 | 11.0 | 37.3 | 37.4 | 166 | 8.00 | 53.3 | 67.7 | |
| 221 | 50 | 0.080 | 0.29 | 22.8 | 46.9 | 32.1 | 99.2 | 22.1 | 46.7 | 92.1 |
| 234 | 66 | 0.028 | 0.22 | 15.6 | 38.7 | 38.2 | 104 | 17.6 | 52.4 | 62.3 |
| 246 | 32 | 0.127 | 0.46 | 17.4 | 38.0 | 18.6 | 95.7 | 9.70 | 52.8 | 71.2 |
| 262 | 1000 | 0.095 | 0.50 | 14.6 | 38.2 | 20.7 | 70.7 | 9.80 | 58.2 | 54.4 |
Table 3.3.4 Metal concentration (μg/g) in bottom sediments measured during June-July 2002 to the south of Taman.
| Depth, m | Al | V | Cr | Mn | Ni | Cu | Zn | As | Cd | Pb |
| 20 | 2184 | 128,4 | 47 | 661 | 28,6 | 53 | 31,06 | 7,25 | 0 | 7,6 |
| 40 | 876 | 54 | 27 | 163,5 | 5,5 | 38 | 30,08 | 2,02 | 0 | 4,3 |
| 70 | 3206 | 293 | 64 | 377,5 | 44 | 92 | 56,28 | 4,47 | 0 | 0,6 |
| 100 | 1488 | 115,2 | 42 | 255 | 32,2 | 79 | 25,61 | 5,35 | 0 | 5,0 |
3.3.3. Georgian sector of the Black Sea - Southeastern region
Bottom Sediments: Concentrations of Fe, Mn, Cu, Zn, Cr, V, Ni, Pb, Mo were measured in 186 samples of bottom sediments during 1993-1995 at shallow areas (3-15 m depth range) of the Georgian shelf.�� Additional trace metal measurements (Fe, Al, Cu, Zn, Cr, As, Ba and Pb) were performed in 2000 [19, 23, 24, 25]. 170 samples from 75 stations of the sea were collected throughout the entire Georgian shelf covering the depth range from 10 to 1500 m. A summary of these measurements is provided in Table 3.3.5.
Table 3.3.5. The metals concentration (μg/g) in the bottom sediments of Georgian shelf in 1993-1995 and 2000.
| Cr | Mn | Cu | Zn | As | Pb | |
| 1993-1995 | ||||||
| min/max | 10/1300 | 700/9300 | 40/900 | 60/300 | - | 7,0-48 |
| Average | 215 | 1937 | 50 | 136 | - | 17,7 |
| 2000 | ||||||
| min/max | 40/700 | - | 20/325 | 60/260 | 5,0/95 | 7-50 |
| Average | 81 | - | 81 | 102 | 15 | 20 |
Copper and Zink: High concentrations of Cu (325 μg/g) and Zn (260 μg/g) were found in bottom sediments collected from shallower depths near the estuary of Chorokhi River in response to the wastes discharged from mining enterprises in Murgul and Artvin regions of Turkey, in the immediate proximity of the boundary with Georgia and from Meria (Adjaria) within the Georgian sector. They however decreased to the north. In sediments of the underwater slope of Kolheti lowland, Cu and Zn were distributed evenly at their background levels ranging from 20 to 45 (the average: 30 μg/g) for Cu and from 62 to 170 (the average: 110 μg/g) for Zn.
Arsenic: The distribution of arsenic in the shallow bottom sediments within Adjara section of underwater slope was analogous with distribution of Cu and Zn. Arsenic was introduced as a part of the sulphide minerals discharged into the sea together with other chalcophilic elements from the mining regions of Georgia and Turkey.
Chromium: This metal was distributed unevenly in bottom sediments. It mainly accumulated in sediments of the Chakvistskali-Supsa inter-mouth region with maximum concentrations 700 μg/g in the estuarine regions of the Chakvistskali and Natanebi Rivers. The main carriers of chromium are dark minerals (magnetite, biotite, pyroxene), the rock-forming minerals of the volcanic ores of basic composition (basalts, andesites, porphyrites, tuffs, tuff breccias, etc.) by the small rivers of the region (Korolistskali, Chakvistskali, Choloki, Natanebi, Supsa) [20]. In contrast to the copper and zinc, accumulation of chromium is natural, since it is not connected with any anthropogenic action. The difference between 1995 and 2000 was mainly related to the difference in sampling depths.
Lead: Lead was distributed evenly throughout the Georgian shelf. The maximum concentration did not exceed 50 μg/g, minimum was 7 μg/g, and the average for all Georgian shelf was 18 μg/g that corresponded to the local background level. Situation has not changed since mid-1990s.
Barium: High content of barium in bottom sediments was mainly confined into coastal zone of the Georgian shelf. The maximum concentration (in the limits of 0.1-0.2%) was found in the region between the Chorokhi River mouth to Batumi. Its distribution was related to the products of weathering of the barites- polymetallic layers of the South Caucasus, transported to the sea by the Chorokhi River. Accumulation of barium was also observed in the estuary sediments of Kintrishi River (0.05-0.1%). In coastal regions of the West Georgia, metamorphic geological formations containing clay minerals (in particular zeolites), rich in barium, were found. Possibly, that terrigenous material was enriched by above mentioned minerals, which explains comparatively high content of barium along the coast.
Aluminium: Being one of the basic rock-forming elements, aluminium constituted 2% to 7.5% of sediments of the Georgian shelf which are found at higher proportions in the area of Kolkheti lowland. On the average, in the northern part of the Georgian shelf, aluminium content was 3-4% higher than in south because of gradually increase of clay fractions in sediments in the northwards direction.
Iron: Coastal region of the shelf located in the inter-mouths of Korolistskali, Chakvistskali, Kintrishi, Natanebi and Supsa Rivers was characterized by high content of iron (>11%). These rivers drain the western extremity of Adjara-Trialeti folded system and carry the products of red sol crust weathering into the sea. High content of iron is related with the dark minerals (magnetite, black mica, etc.) [21, 22]. In this region, high content of iron coincided with high content of chromium, which pointed to their common source. Within the limits of Kolkheti lowland, iron content varied from 3% to 5% in sediments of the underwater slope.
Manganese: In sediments from Chorokhi River estuary to the town Kolkheti, Mn distribution was practically homogeneous and equal to the natural background level from 0.07 to 0.27% with 0.13% on the average. This level corresponds to Mn concentration in the red-colored soil of coastal zone of Adjaria and Gurii. In the area between Natanebi and Supsa Rivers, thickness of this type of soil is maximal and the discharge into the sea is therefore most intensive. To the north of the Supsa estuary, Mn content in sediments increased stepwise up to 0.93%, on the average 0.25%. It came into the sea in a large volume with suspended solids and particles of the Rioni River waters. In 1950-to-80s, Mn content in river particles was as high as 5.0-5.9%, and reached 5.0-14.8% level in sediments close to the northern branch of Rioni. That was however decreased to 0.3% in 1995. The decreasing Mn content in the Rioni discharge depends upon reduction of activity at the Chiature mining factory.
3.3.4. Romanian sector of the Black Sea ����� Western region
The investigations carried out in 2000�����2005 on trace metals levels in water and sediments along the Romanian coastal zone evinced the following mean values and ranges:
Seawater (total concentrations): copper 14.09 ��g/l (1.46 ����� 27.31 ��g/l); cadmium 2.15 ��g/l���� (0.27 ����� 4.60 ��g/l); lead 11.58 ��g/l (1.03 ����� 30.04 ��g/l); nickel 4.23 ��g/l (0.65 ����� 8.74 ��g/l); chromium 5.28 ��g/l (1.50 ����� 12.23 ��g/l); manganese 17.01 ��g/l (2.72 ����� 36.58 ��g/l); zinc 9.06 ��g/l (0.40 ����� 26.98 ��g/l).
Sediments: copper 61.83 ��g/g dw (18.71 ����� 134.35 ��g/g dw); cadmium 1.81 ��g/g dw (0.37 ����� 3.35 ��g/g dw); lead 55.52 ��g/g dw (15.71 ����� 107.35 ��g/g); nickel 32.24 ��g/g dw (4.30 ����� 89.05 ��g/g dw); chromium 12.01 ��g/g de (3.01 ����� 23.34 ��g/g dw); manganese 185.13 ��g/g dw (78.90 ����� 399.67 ��g/g dw); zinc 117.90 ��g/g dw (26.98 ����� 181.63 ��g/g dw).
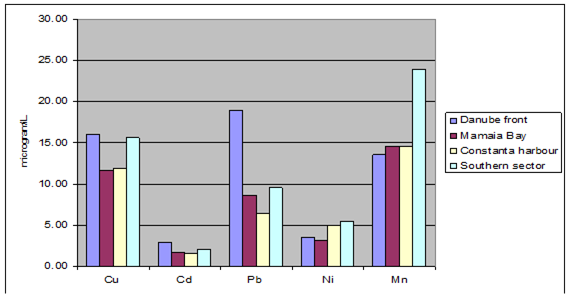
Fig. 3.3.9. Trace metal average values (2000 ����� 2005) in seawater along Romanian littoral
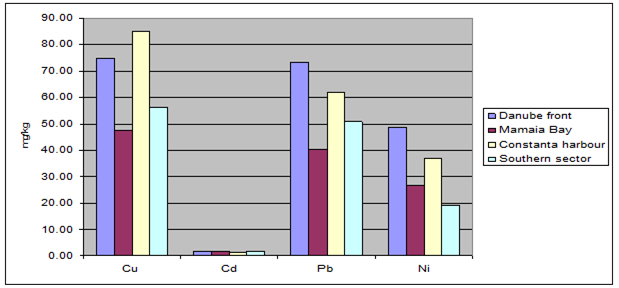
Fig. 3.3.10. Trace metal average values (2000 ����� 2005) in sediments along Romanian littoral
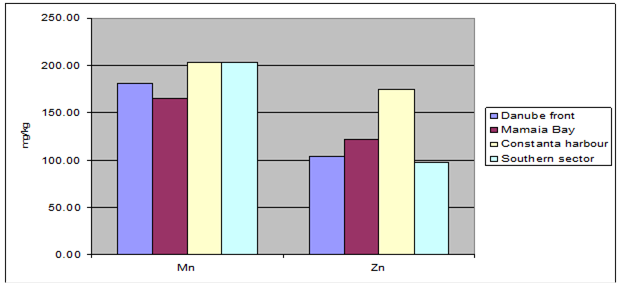
Fig. 3.3.10. (cont�����d) Trace metal average values (2000 ����� 2005) in sediments along Romanian littoral
Trace metals distribution in seawater and sediments along the Romanian littoral during 2000�����2005 presented a wide range of concentrations, under the influence of natural and anthropogenic factors. Strong impact of human activities was reflected, for instance, in the increased values of some metals in harbour sediments (Constanta Port). In comparison with the central sector of the littoral (Mamaia Bay) and the southern extremity, that were characterized by moderate�� values, in front of the Danube mouths higher concentrations of metals were measured, both in water and sediments. (Fig. 1B;�� Fig. 2).
Acknowlegments. The authors are grateful to the Secretariat of Black Sea Convention for providing the data collected for riparian countries used for this assessment. Special thanks to the personnel who were involved with sampling at sea and their analysis, particularly those working in ���œTyphoon���� in Obninsk, O. Mjakoshin and Y. Yurenko in Sochi Hydrometeorological Centre, and Vakhtang Gvakharia (Georgia).
References
1. IAEA Regional Technical Co-operation Project RER/2/003 (2004) Marine Environmental Assessment of the Black Sea Region, working paper: Project Report, 356 p.
2. State of the Black Sea Environment. National Report of Ukraine. 1996-2000. ����� Chapter 4: Chemistry. V.Mikhailov, Yu.Denga, I.Orlova, V.Lepeshkin, R.Lisovsky, M.Pavlenko, L.Fetisov, V.Solovyov. ����� Odessa, Astroprint, p.34-53.
3. BSC ����� Black Sea Commission Annual Reports.
4. Marine Water Pollution. Annual Report 2004 By Korshenko A.N., I.G. Matveichuk, T.I. Plotnikova, V.P. Luchkov, V.S. Kirianov. - Moscow, Meteoagency of Roshydromet, 2006, 200 p.
5. Oradovsky S.G. (1993) Guidance on the methods of chemical analysis of seawater, Ed., St.Petersburg, Hydrometeoizdat, 220 pp.
6. Ferraro G., D. Tarchi, J. Fortuny, A. Sieber (2006) Satellite monitoring of accidental and deliberate marine oil pollution. In: Marine Surface Films Chemical Characteristics, Influence on Air-Sea Interactions and Remote Sensing. Eds. M. Gade, H. H��hnerfuss and G.M. Korenowski. Springer, 273-288.
7. Neue Niederlandische Liste. Altlasten Spektrum 3/93.
8. Black Sea Pollution Assessment. Ed. L.D. Mee and G. Topping, United Nations Publications, New York, 1998, 380 pp.
9. BSERP-2006 Cruise Report
10. Modern state of the Black sea waters pollution. Ed. Simonov A.I., Ryabinin A.I. ���œSeas project����, Vol.IV, Black Sea, Issue 3, Sevastopol, ���œEKOSI-Hydrophysika����, 1996, 230 p.
11. Savin P.T., N.F. Podpletnaya. Comparative characteristics of oil pollution of the nearshore and open areas of Odessa Region. ����� Problems of the sea coastal zone management and sustainable development. Abstracts of XXII International Coastal Conference, Gelendzhik, 16-20 May, 2007, 278-280.
12. Geoecology of shelf and coasts of Russian seas. Ed. N.A.Aibulatov. ����� M.: Noosphere, 2001, p. 314-316.
13. The list of fishing norms: maximum allowed concentations (MAC) and as a guide safe levels of influence (OBUV) by harmfull substances for the waters of basins having fishery importance. ����� Moscow, VNIRO, 1999, 304 p.
14. Patin S.A. Ecological problems of oil and gas resources development on the marine shelf. ����� M.: VNIRO Publishing, 1997, p. 131-140.
13. Mityagina M., O. Lavrova & T. Bocharova. Detection and Discrimination of Sea Surface Films in the Coastal Zone of Northeastern Black Sea Using SAR Data. ESA-ed.:, vol.1: ESA-SP-636, 2007.
16. Shcherbak S.S., O.Y. Lavrova, M.I. Mityagina, T.Y. Bocharova, V.A. Krovotyntsev, A.G. Ostrovskii. Multisensor satellite monitoring of seawater state and oil pollution in the north-eastern coastal zone of the Black Sea. International Journal of Remote Sensing. 2008. (in print).
17. Lavrova Olga, Marina Mityagina and Tatiana Bocharova, Satellite monitoring of sea surface state of Russia�����s coastal zone of the Black and Azov Seas // The 2nd International Workshop on Advances in SAAR Oceanography from Envisat and ERS Missions, January 2008, EASA-Esrin, Frscati, Italy.
18. Black Sea 2003 Cruise. Contaminant screening. Project Technical Report. Monaco, April 2004, 44 p.
19. Manual for the Geochemical analyses of Marine Sediments and Suspended Particle Mater. Reference Methods for Marine Pollution Studies. No. 63. UNEP 1995.
20. Machitadze N., V. Gvakharia, A. Tvalchrelidze (2001). Vanadium and chromium content in present sediments of Georgian sector of the Black sea. - Bull. of Georg. acad.of Sci., 164, No 3, p. 501-503.
21. Machitadze N., M. Tvalchrelidze, V. Gvakharia (2001). Particularities of geochemical zones formation in the sediments of south-eastern sector of the Black sea Georgia. - Bull. of Georg. acad.of Sci., 163, No 2, p. 297-300.
22. Gvakharia V.G., N.O. Machitadze, A.G. Tvalchrelidze (2002). Distribution Cu, Zn, Mo and Fe in contemporary marine sediments of the Georgian sector of Black sea. - A. Janelidze Geological Institute, Proceeding, New Series, Vol. 117, p. 424-429.
23. USEPA Method 418.1, TNRCC Method 1006.
24. Gvakharia V.G., Gelashvili N.E., Gvakharia T.A., Adamia T.M., Janashvili N.D., Maisuradze G.B. (2004). Method for determination of petroleum hydrocarbons and the study of pollution level of bottom sediments within the Georgian section of the Black Sea water area. - Georgian Engineering News, №2, p. 108-110.
25. Gvakharia V., Tsitsishvili V., Maisuradze G., Gelashvili N., Loria Kh., Girgvliani D. (2002). Use of Chromatography in Ecological Audit of Water Areas and Neighboring Territories of Bleak Sea coast of Georgia. - Second West Ukrainian Symposium on Adsorption & Chromatography, p. 151-155.
CHAPTER 4 THE STATE OF RADIOACTIVE POLLUTION (V. Egorov et al.)��
V.N. Egorov, S.B. Gulin, N.Yu. Mirzoyeva, G.G. Polikarpov, N.A. Stokozov
The A.O. Kovalevsky Institute of Biology of the Southern Seas, NASU, Sevastopol,Ukraine
G.V. Laptev, O.V. Voitsekhovych
Ukrainian Hydrometeorological Institute, Kiev, Ukraine
SE SPA ���œTyphoon���� of Roshydromet, Obninsk, Russia
Chapter co-ordinator: I. Osvath,
�� Marine Environment Laboratories, International Atomic Energy Agency, Monaco
4.1. Introduction
Due to its geographical location and limited water exchange with the rest of the World Ocean, the Black Sea has been one of the marine basins most contaminated with artificial radioactivity. Anthropogenic radionuclides originated primarily from two sources: the large-scale atmospheric nuclear weapons tests carried out before 1963 and the Chernobyl Nuclear Power Plant accident in April 1986 (Buesseler and Livingston, 1996). The Black Sea received relatively high levels of atmospheric deposition from nuclear weapons testing, the global fallout reaching its maximum in the 40o-50oN latitude band (UNSCEAR, 2000), which runs across the Black Sea. The Chernobyl accident further led to direct contamination by fallout on the sea-surface. Secondary contributions from the deposition of radionuclides released to the atmosphere on the drainage basin entered the sea through river discharges, principally through the Danube and Dnieper Rivers (Livingston et al., 1988; Polikarpov et al., 1992). 137Cs and 90Sr are the most significant radionuclides reaching the Black Sea from these sources, due to their inventories, half-life and dosimetry. Additional relatively long-lived (e.g. Pu isotopes, 241Am) or short-lived radionuclides (e.g. 95Zr/95Nb, 103Ru, 106Ru, 110mAg, 125Sb, 131I, 134Cs, 140Ba/140La, 141Ce, 144Ce) have been reported and were traceable to the above-mentioned sources. There is no official record and no environmental evidence of radioactive waste dumping into the Black Sea (IAEA, 1999) as an additional pollution source. Monitoring of 137Cs and 90Sr in water, sediment and biota and significant research on marine radioactivity were carried out in the Black Sea since the early 1960s. In the period 1986-2005, within the framework of various international and national field campaigns and monitoring programmes, the Black Sea riparian countries collaborated in numerous studies. The present chapter provides an overview of these studies and assesses recent levels of radioactive pollution.
4.2. Concentrations and inventories of radionuclides in the water column
The regionally-averaged vertical profiles of 137Cs and 90Sr concentrations for the central deep basin (Fig. 4.1) indicate a three layer structure formed by high-concentrations in the surface mixed layer, decreasing concentrations in the gradient layer, and low concentrations in the deep layer underneath. This structure has evolved by the progressive penetration of radionuclides to greater depths and the decrease in surface concentrations.
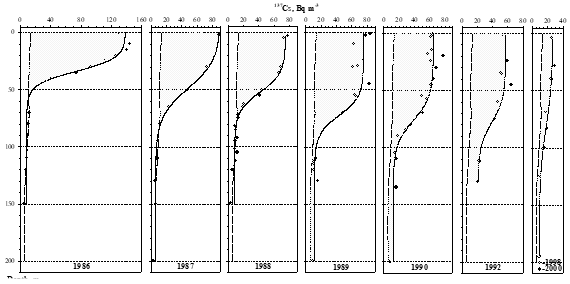
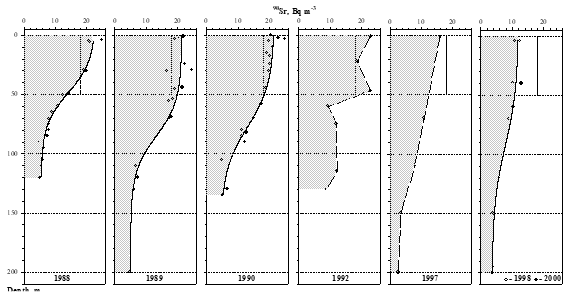
Fig. 4.1. Vertical distributions of 137Cs (on top) and 90Sr (below) concentrations in the Black Sea central basin in 1986-2000 (circles), curve-fitted profiles (solid lines) and average levels of 137Cs concentration in the 0-200 m layer and 90Sr in the 0-50 m layer before the Chernobyl NPP accident (dashed lines) (Stokozov and Egorov, 2002)
The atmospheric fallout deposited on the surface of the entire Black Sea during the first days of May 1986 was estimated at 1700-2400 TBq of 137Cs, which corresponded to nearly 2% of the total 137Cs release into the environment following the Chernobyl NPP accident (Nikitin et al., 1988; Polikarpov et al., 1991; Egorov et al., 1993). Shortly after the accident, the 137Cs inventory in the surface 0-50 m layer reached 2700 TBq, exceeding its pre-Chernobyl value by a factor of 6-10. This inventory decreased abruptly to 1600 TBq in 1987 and then more gradually to around 500-600 TBq in 1998-2000 and 350��60 TBq in 2001-2004 (Fig. 4.2). The 137Cs input of 26 TBq from the Danube and the Dnieper Rivers over the period 1986-2000 was negligible in comparison with the direct contribution of atmospheric fallout (Voitsekhovych, 2001). The outflow of 137Cs through the Bosporus Strait was 250 TBq over the period 1986-2000 (Egorov et al., 2002, 2005).


Fig. 4.2. Temporal evolution of the 137Cs inventory in the 0-50 m water layer of the Black Sea after the Chernobyl NPP accident: estimates based on measured water concentrations (circles) and modeling (solid and dashed lines) (Egorov et al., 1993). A corresponding average environmental half-life of 5-7 y can be estimated for 137Cs in surface waters.
The contribution of Chernobyl-origin 90Sr deposition on the sea-surface was estimated to be 100-300 TBq, which resulted in a rapid increase of concentrations in the surface mixed layer (Egorov et al., 1999). The Dnieper and Danube Rivers added around 160 TBq of 90Sr into the sea during 1986-2000, comparable in magnitude to the amount introduced by fallout after the Chernobyl NPP accident (Voitsekhovych, 2001). The 90Sr outflow through the Bosphorus was 110 TBq over the period 1986-2000 (Egorov et al., 2002, 2005). Estimates given by Egorov et al. (2006) indicate a 90Sr inventory of 1770��790 TBq in the waters of the Black Sea in 1998-2000, 20% of which are attributable to the Chernobyl NPP accidental release, the majority of the 90Sr inventory being contributed by global fallout.. An area of particular interest due to secondary releases through the Dnieper from flooding of contaminated areas in the vicinity of the Chernobyl NPP, constituting an additional regional contamination source for the Black Sea, is the Dnieper-Bug estuary area. NW Black Sea annual mean surface concentrations of 16-21 Bq m-3 90Sr were reported for 2001-2005, representing an increase as compared to the 1998-2000 annual means of between 10-15 Bq m-3 90Sr (Egorov et al., 2006).
The evolution of 137Cs and 90Sr levels in coastal waters is illustrated by the values reported for the North-Eastern Black Sea (Table 4.1). Higher maximum post-Chernobyl levels in water were recorded in Sevastopol Bay, reaching up to 815 Bq m-3 and 157 Bq m-3 for 137Cs and 90Sr respectively (Fig. 4.4). As compared to initial levels measured after the Chernobyl accident, variations in average 137Cs concentration values reported for 2001-2006 in coastal surface water narrowed down considerably, being mostly attributable to seasonal freshwater inflow and generally correlating well with salinity. Values between 12-21 Bq m-3 were reported for Varna, Bulgaria in 2002-2004 (Veleva, 2006), 11-26 Bq m-3 in 2003-2005 at the Georgian coast (Pagava, 2006), 15-36 Bq m-3 in 2001-2005, with a single value close to 50 Bq m-3 in September 2004, for Constanza, Romania (Puscasu and Dima, 2006), being similar to those reported for the Russian coast (Table 4.1).
Relatively few data were published recently on Pu isotopes in Black Sea water. Values reported for 239+240Pu�� over the period 1989-1998 range between 3 mBq m-3 in surface water and 13 mBq m-3 at 150-200 m depth.
Table 4.1. The dynamics of 137Cs and 90Sr levels (Bq m-3) in surface waters of the North-Eastern Black Sea near the Russian Coast.
| Year | 137Cs | 90Sr | ||
| Range | Average | Range | Average | |
| Before Chernoby (l) NPP accident1 | Homogeneous distribution | 18.5 | Homogeneous distribution | 22.2 |
| 1986, June-July (2) | 250-470 | 360��50 | 74-100 | 86��8 |
| 1986, October (2) | 104-159 | 127��17 | 22-37 | 28��4 |
| 1987, June (2) | 48-59 | 56��4 | - | - |
| 2000-20013 | 20.0-28.0 | 23.5��3.0 | 12.3-16.3 | 14.5��2.0 |
| 2004 | 20.0-23.5 | 21.7��1.8 | 10.3-11.0 | 10.7��0.4 |
| 2005 | 20.2-22.6 | 21.4��1.2 | 11.5-12.9 | 12.2��0.7 |
Sources: (1) Vakulovsky et al. (1980, 1994 ), (2) Nikitin et al. (1988), (3) IAEA (2004)
4.3. Concentrations and inventories of radionuclides in sediment
The highest 137Cs concentrations measured in 1992-1994 in the upper 5-cm layer of NW-W Black Sea shelf bottom sediments were found near the Danube Delta, the Dnieper-Bug Estuary, and around the Tarkhankut Cape of the Crimea peninsula (Egorov et al., 2006). A similar pattern of contamination was found in 2003-2004 (Voitsekhovych et al., 2006), reflecting the contributions of the post-Chernobyl initial atmospheric deposition, further river inflow and sediment transport and deposition. Total inventories of 137Cs in bottom sediments near the river mouths in 1990-1994 were in the range 10-40 kBq m-2, one order of magnitude higher than at shelf break (2-5 kBq m-2) and two orders of magnitude higher than at the continental slope and deep-water basin (0.2-0.3 kBq m-2) (Egorov et al., 2006). Pre-Chernobyl inventories of 137Cs in bottom sediments ranged between 1-8 kBq m-2 in coastal and shelf areas and were below 0.2 kBq m-2 in deeper areas (Vakulovsky et al, 1982). Maximum pre-Chernobyl 137Cs concentrations in superficial bottom sediments of about 100 Bq kg-1 d.w. were reported by Vakulovsky et al. (1982). Maxima in the range of 500 Bq kg-1 d.w. 137Cs were reported offshore the Danube mouths in September 1986 (Osvath et al., 1990), with current maxima reaching up to 100 Bq kg-1 d.w. 137Cs according to Voitsekhovych et al. (2006).
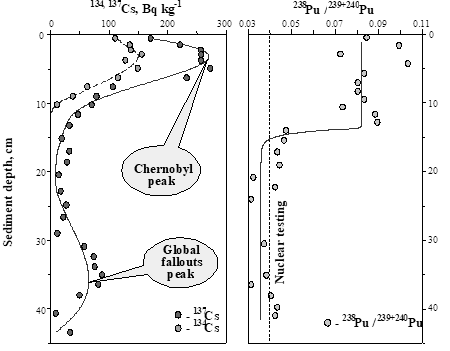
Fig. 4.3. Vertical distributions of 134Cs, 137Cs activities (Bq kg-1 d.w.) and the 238Pu/239+240Pu activity ratio versus sediment depth (cm) in the Danube delta region in 1997.
Well-preserved 137Cs profiles in the deep basin and NW Black Sea bottom sediments (Egorov et al., 2006; Voitsekhovych et al., 2006) showed two subsurface peaks attributable to global fallout from atmospheric nuclear weapons testing and the Chernobyl accident. The Chernobyl origin of the upper peak in the 137Cs activity profile was documented using the activity ratio of 134Cs/137Cs, as the activity ratio of the short-lived 134Cs (T1/2 = 2.06 years) to the longer-lived 137Cs (T1/2 = 30.17 years) is known to be 0.53 in the Chernobyl release (Pentreath, 1988).�� A further differentiation of the pre- and post-Chernobyl sediments was carried out using the activity ratio 238Pu / 239+240Pu, that was of about 0.04 for the pre-Chernobyl global fallout (Fig. 4.3) compared to 0.47 in the Chernobyl release (Pentreath, 1988). 210Pb dating for well preserved cores, corroborated with indications from markers such as 137Cs and Pu isotopes, was used for evaluating contributions from both radioactive and non-radioactive contamination sources and also sediment mass accumulation rates (Voitsekhovych et al., 2006; Gulin et al., 2002; IAEA, 2004).
Post-Chernobyl 239+240Pu concentrations up to 0.4 Bq kg-1 d.w. were reported for sediments from both coastal and deep basin areas, depending on location and sediment composition (Egorov et al., 2006), with estimated 238Pu / 239+240Pu activity ratios varying in the range 0.105�����0.165. These analyses indicated that about 75% of the total plutonium contamination in the Black Sea bottom sediments was caused by global fallout.
90Sr being a soluble radionuclide, its levels in sediments remain generally low in the Black Sea. Pre-Chernobyl maxima of around 45 Bq m-2 90Sr inventory and 1.3 Bq kg-1 d.w. 90Sr concentrations were reported by Vakulovsky et al. (1982) for superficial bottom sediments. Following the Chernobyl accident, in the Black Sea at large concentrations of 90Sr in superficial bottom sediments remained in the same range as their pre-Chernobyl levels. Higher values were reported for the NW Black Sea, in particular offshore the Dnieper-Bug estuary area, where Mirzoyeva et al. (2005) reported concentrations of 90Sr in the 0-5 cm layer of bottom sediments ranging up to 45 Bq kg-1 d.w. in 1986, 80 Bq kg-1 d.w. in 1989, 45 Bq kg-1 d.w. in 1990-1996 and 150 Bq kg-1 d.w. in 1997-2000. They relate the differences observed to river input, as previously mentioned, periods of high water inflow through the Dnieper and, to a lesser extent, through the Danube, resulting in increases of 90Sr levels in offshore superficial sediments.
Radionuclides in beach sand are typically reported for radioprotection purposes. Concentrations in the past years range between roughly 0.5-12 Bq kg-1 d.w. for 137Cs, 0.2-10 Bq kg-1 d.w.�� for 90Sr and are below 0.2 Bq kg-1 d.w. for 239+240Pu (IAEA, 2004).
��4.4.�� Radionuclides in marine biota
The results of radioecological monitoring of the Sevastopol bays have shown that the increase of 137Cs and 90Sr concentrations in seawater recorded in May 1986 were followed by increases in the respective concentrations in marine biota (Fig. 4.4). Egorov et al. (2002) approximated the decrease recorded during the following years with exponential functions and estimated environmental half-lives for 90Sr of 8.4 y for water, 4.9 y for seaweed, 6.7 y for mussels; and for 137Cs 6.1 y for water, 4.7 y for seaweed, 7.5 y for mussels in the Sevastopol Bays. The doses delivered to the Black Sea biota by the anthropogenic radionuclides 90Sr and 137Cs after the Chernobyl NPP accident did not exceed the chronic exposure levels and the post-Chernobyl 90Sr and 137Cs contaminations did not introduce significant effects on biota in the Sevastopol Bay (Polikarpov, 1998; Mirzoyeva and Lazorenko, 2004). Maximum dose rates from anthropogenic radionuclides recorded in 1986 were found around 17%, 5.5% and 20% of the doses received from the natural 210Po by fish, molluscs and seaweed, respectively.
Coastal monitoring results in countries around the Black Sea for the period 2000-2005 (Nikitin et al., 2006; Patrascu, 2006; Veleva, 2006; Pagava, 2006) indicate low levels of anthropogenic radionuclides in seaweed, molluscs and fish (Table 4.2). 239+240Pu concentrations up to 17 mBq kg-1 w.w. in seaweed, 2.4 mBq kg-1 w.w. in mollusks and 1 mBq kg-1 w.w. in fish were reported at the NE Black Sea coast in 2000-2005 (Nikitin et al., 2006). Variations are observed between species and also depending on location, age etc., however, levels are generally low, with no radiological significance either for the biota themselves or for the human populations consuming edible species of marine biota.


Fig. 4.4. Temporal evolution of 137Cs (on the right) and 90Sr (on the left) concentrations in water (a), algae Cystoseira crinita (b), mollusc�� Mytilus galloprovincialis (c) and fish Merlangius ��merlangus euxinus (d) in the Sevastopol bays in 1986-2005.
Table 4.3. The ranges of 137Cs and 90Sr concentrations in marine biota (Bq kg-1 w.w.) from coastal measurements performed by the riparian countries in the years 2000-2005.
| Biota | 137Cs | 90Sr |
| Seaweed | 0.3-3 | 0.4-2.5 |
| Molluscs | 0.3-2 | 0.02-3.2 |
| Fish | 0.8-3 | 0.02-3.2 |
4.5. Conclusions
Chernobyl atmospheric fallout deposited 1.7-2.4 PBq of 137Cs into the Black Sea surface, which temporarily increased the 137Cs inventory of the 0-50 m surface layer by a factor of 6-10 in comparison with its pre-Chernobyl value. The contribution of Chernobyl-origin 90Sr (0.1-0.3 PBq) from atmospheric fallout was lower in comparison with that of 137Cs. A subsequent 90Sr input from the Danube and the Dnieper Rivers (about 0.16 PBq) was an important contribution to the budget of this radionuclide in the Black Sea, but the riverine 137Cs input (0.02-0.03 PBq) was insignificant. The decrease of the 137Cs inventory in the surface layer after Chernobyl has been mainly controlled by vertical mixing, loss through the Bosphorus Strait, and radioactive decay. The loss through the Bosphorus accounted for 2-2.5% of the 137Cs inventory.�� In the case of 90Sr, these processes have been compensated by river inputs from the Dnieper and Danube Rivers up to 1994-1995 and partially after 2000. The vertical mixing of 137Cs and 90Sr was mainly effective within the 0-200 m layer. Sediment inventories of 137Cs in the Danube and Dnieper delta regions exceeded with one order of magnitude the values in the slope zone and two orders of magnitude those in the deep basin. Marine biota along the coastal areas of the Black Sea presented very low levels of anthropogenic radionuclides.
��Although the Black Sea was ranked at the level of the year 2000 amongst the marine regions of the World Ocean as the 2nd highest in terms of 90Sr concentrations in surface seawater (after the Irish Sea) and 3rd highest in 137Cs concentrations (after the Baltic and Irish Seas) (IAEA, 2005), the levels of anthropogenic radionuclides found in the Black Sea environment associate insignificant radiological doses to human populations.
References
Buesseler, K.O. and Livingston, H.D (1996). Natural and man-made radionuclides in the Black Sea. In: P. Gu��gu��niat, P. Germain and H. M��tivier, Editors, Radionuclides in the Oceans: Inputs and Inventories, Editions de Physique, IPSN.
Buesseler, K.O.and Livingston, H.D. (1997). Time-series profiles of 134Cs, 137Cs and 90Sr in the Black Sea. In Sencitivity to change: Black Sea, Baltic Sea and North Sea. Eds. Ozsoy, E. and Mikaelyan A. Dordrecht: Kluwer Academic, 239-251.
Egorov, V.N., Polikarpov, G.G., Kulebakina, L.G., Stokozov, N.A., Yevtushenko, D.B. (1993). Model of large-scale contamination of the Black Sea with the long-lived radionuclides 137Cs and 90Sr resulting from the Chernobyl NPP accident. Water Resources, 20 (3), 326-330 (in Russian).
Egorov, V.N., Povinec, P.P., Polikarpov, G.G., Stokozov, N.A., Gulin, S.B., Kulebakina, L.G., Osvath, I. (1999). 90Sr and 137Cs in the Black Sea after the Chernobyl NPP accident: inventories, balance and tracer applications. J.�� Environmental Radioactivity, 49 (3), 137-156.
Egorov, V.N., Polikarpov, G.G., Osvath, I., Stokozov, N.A., Gulin, S.B., Mirzoyeva N.Yu. (2002). The Black Sea radioecological response to the 90Sr and 137Cs contamination after the Chernobyl NPP accident. Marine Ecological J., 1(1), 5-15. (In Russian).
Egorov, V.N., Polikarpov, G.G., Stokozov, N.A., Mirzoeva N. Yu. (2005). Estimation of 90Sr and 137Cs transfer from the Black Sea to the Mediterranean basin after Chernobyl NPP accident. Marine Ecological J., 4(4), 33-41.
Mirzoyeva, N.Yu., Egorov, V.N., Polikarpov, G.G. (2005) Content 90Sr in the Black Sea bottom sediments after the Chernobyl NPP accident and its using as a radiotracer for the assessment of the sedimentation rate.�� System control of Environment (means and monitoring): collected scientific articles, NAS of Ukraine. MHI, Sevastopol, 2005, 276 ����� 282 (in Russian)
Egorov V.N., Polikarpov G.G., Gulin S.B., Osvath I., Stokozov N.A. Lazorenko G.E., 2006. XX years of radioecological response studies of the Black Sea to the Chernobyl NPP accident. Presented at the First Biannual Scientific Conference ���œBlack Sea Ecosystem 2005 and Beyond����, Istanbul, 8-10 May 2006.
Gulin, S.B., Polikarpov, G.G., Egorov, V.N., Martin, J.M., Korotkov, A.A., Stokozov, N.A. (2002). Radioactive contamination of the north-western Black Sea sediments. Estuarine, Coastal and Shelf Science, 54 (3), 541 - 549.
IAEA (1999). Inventory of radioactive waste disposals at sea. International Atomic Energy Agency, IAEA-TECDOC-1105, August 1999.
IAEA (2004). Regional Technical Co-operation Project RER/2/003 ���œMarine Environmental Assessment of the Black Sea����. Working material. Reproduced by the IAEA, Vienna, Austria, 2004.
Livingston, H.D., Buesseler, K.O., Izdar, E., & Konuk, T. (1988). Characteristics of Chernobyl fallout in the Southern Black Sea. In: Radionuclides: a tool for oceanography. J.C.Guary, P. Guegueniat, & R.J.Pentreath (Eds.), Essex: UK Elsevier. 204-216.
Nikitin A.I., Medinets V.I., Chumichev V.B., Katrich I.Yu., Vakulovsky S.M., Kozlov A.I., Lepeshkin V.I. (1988) Radioactive contamination of the Black sea caused by the Chernobyl NPP accident as of October 1986, Atomnaya Energia, 65 (2), 134�����137 (in Russian).
Nikitin A.I., Chumichev V.B.,�� Valetova N.K.,�� Katrich I.Yu.,�� Kabanov A.I., Yurenko Yu.I. (2006) Monitoring of artificial radionuclides in the marine environment of the Russian Coast of the Black Sea: results obtained during the years 2004-2005.
Osvath I., Dovlete C., Bologa A. (1990). Radioactivity in the Romanian sector of the Black Sea. Proc. International Symposium on post-Chernobyl environmental radioactivity studies in East-European countries. Kazimierz, Poland, 1990, pp108-112.
Pagava S. (2006). Report on the Black Sea environmental pollution by radioactivity, Georgia 2003-2005. I. Javakhishvili Tbilisi State University, Tbilisi, Georgia. Report to the IAEA, 2006.
Pentreath R.J. (1988). Sources of artificial radionuclides in the marine environment. In: Radionuclides: A Tool for Oceanography. Guary J.C., Guegueniat P., Pentreath R.J. (Eds.), Essex: UK Elsevier, 12 -23.
Polikarpov, G.G., Kulebakina, L.G., Timoshchuk, V.I., Stokozov, N.A. (1991). 90Sr and 137Cs in surface waters of the Dnieper River, the Black Sea and the Aegean Sea in 1987 and 1988, J. Environmental Radioactivity, 13, 25-28.
Polikarpov G.G., Livingston H.D., Kulebakina L.G., Buesseler K.O., Stokozov N.A., Casso S.A. (1992). Inflow of Chernobyl 90Sr to the Black Sea from the Dnieper River. Estuarine, Coastal and Shelf Science, 34, 315 - 320.
Polikarpov G.G. (1998). Conceptual model of responses of organisms, populations and ecosystems in all possible dose rates of ionizing radiation in the environment. Procc. of RADOC 96-97 conference, Norwich/Lowestoft, 8-11 April, 1997. Radiation Protection Dosimetry, 75(1-4), 181-185.
Patrascu, V. (2006). Romanian contribution by NIMRD Constanza to radioactivity assessment in Black Sea biota. Report to the IAEA, 2006.
Puscasu C., Dima D. (2006). Assessment of marine radioactivity in the Romanian sector of the Black Sea. Environmental Protection Agency, Constantza, Romania. Report to the IAEA, 2006.
Stokozov N.A. & Egorov V.N. (2003). Vertical water mixing in the Black Sea: evidences from long - term post - Chernobyl 137Cs profiles. Procc. of NATO Advanced Research Workshop on Past and Present Water Column Anoxia, Sevastopol, Ukraine, 4-8 October 2003. 88-89.
UNSCEAR (2000). Sources and effects of ionizing radiation. United Nations Scientific Committee on the Effects of Atomic Radiation UNSCEAR 2000 Report to the General Assembly with Scientific Annexes. Vol I: Sources. UN, New York, 2000
Vakulovsky, S.M., Katrich, I.Yu., Krasnopevtcev, U.V., Nikitin, A.I., Chumichev, V.B., Shkuro, V.M. (1980). Spatial distribution and balance of H-3 and Cs-137 in the Black Sea in 1977. Atomic Energy, 49 (2), 105-108 (in Russian).
Vakulovsky, S.M., Krasnopevtsev, Yu.V., Nikitin, A.I., Chumichev, V.B. (1982). Distribution of 137Cs and 90Sr between the water and bottom sediments in the Black sea in 1977. Okeanologia, v.XXII, issue 6, Moscow, 1982, pp.966-969 (in Russian)
Vakulovsky, S.M., Nikitin, A.I., Chumichev, V.B., Katrich, I.Yu., Voitsekhovich, O.V., Medinets, V.V.Рisarev, V.I., Bovkun, L.А., Khersonsky E.S. (1994) Cesium-137 and strontium-90 contamination of water bodies in the areas affected by releases from the Chernobyl nuclear power plant accident: An overview. J.�� Environmental Radioactivity, 23, 103-122.
Veleva B. (2006). Report on results obtained in Bulgaria on Black Sea environmental pollution, with a focus on marine radioactivity. National Institute of Meteorology and Hydrology, Sofia, Bulgaria. Report to the IAEA, 2006.
Voitsekhovych, O.V. (2001). Project status report of the Ukrainian Hydrometeorological Institute (UHMI), Central geophysical observatory (CGO), Marine Branch of UHMI (2001). National Report for the IAEA Regional Technical Co-operation Project RER/2/003 ���œMarine Environmental�� Assessment in the Black Sea����. UHMI, Kiev�����Sevastopol,. 83 p.
Voitsekhovych, O.V. , Kanivets V.V., Laptev G.V. (2006). Current state of radioactivity studies in the Ukrainian Hydrometeorological Institute (UHMI) 2002-2005. Progress Report to the IAEA, 2006.
CHAPTER 5 THE STATE OF PHYTOPLANKTON (D. Nesterova et al.) ��
Odessa Branch, Institute of Biology of the Southern Seas, NASU, Odessa, Ukraine
Institute of Oceanology, Bulgarian Academy of Sciences, Varna, Bulgaria
A. Mikaelyan1, A. Vershinin1 and V. Akatov2
�� 1 P.P.Shirshov Institute of Oceanology RAS, Moscow, Russia
2 Maykop State Technological University,Maykop, Russia
National Institute for Marine Research and Development ���œGrigore Antipa���� (NIMRD), Constanta, Romania
3 Marine Sciences, Faculty of Fisheries, Istanbul University, Istanbul, Turkey
�� 4 Sinop University, Fisheries Faculty, 57000 Sinop, Turkey
Georgian Marine Ecology and Fisheries Research Institute (MEFRI),
5.1. Introduction
Phytoplankton as the foundation of marine trophic chain is among the best indicators for assessment of the state of eutrophication. Nutrient enrichment/eutrophication often gives rise to shifts in phytoplankton species composition (e.g. from diatoms to dinoflagellates) and an increase in the frequency and/or magnitude and/or duration of phytoplankton (including nuisance/potentially toxic) blooms. The present chapter analyzes the recent trends of changes in phytoplankton species composition and then highlights main features of its contemporary state along the Black Sea shelf waters. The assessments are based on the evaluation of historical data as well as those collected during the present decade within the framework of various international and regional field campaigns as well as national monitoring programs.��
5.2. Species composition
Data compiled by many sources documented 750 phytoplankton species in the Black Sea (Ivanov 1965, Pitsyk 1950, Sorokin, 2002). Owing to considerable differences in hydrological and hydrochemical properties, phytoplankton composition differed considerably in different parts of the sea. In particular, the shallow, less saline and heavily euthrophied northwestern part of the sea sustained large number of brackish and freshwater species as compared with other parts (Ivanov, 1967).
��Northwestern and Crimean shelves: A summary of the lists of phytoplankton species studied in 1973-2005 in the northwestern Black Sea shelf (NWS) (Nesterova, 1998; Guslyakov and Terenko, 1999; Nesterova and Terenko, 2000; Terenko, 2004; Nesterova and Terenko, 2007) showed that phytoplankton is represented by 697 species and interspecies pertaining to 11 phyla (Table 5.1). During 1973 ����� 2005, diatoms and dinophytes constituted main species as observed prior to 1973, but their ratio has changed in comparison to 1950s (Ivanov, 1967). The diatom species decreased from 48.3% to 34.9%, while dinophytes increased from 20.4 % to 28.5 %. Freshwater green algae species increased from 16.7% to 22.5%, while blue-green algae remained around 5-6%. Due to revised phytoplankton composition, representatives of new phyla of Cryptophyceae Hillea fusiformis, Prasinophyceae Pterosperma cristatum, Pt. jorgensenii and a Choanoflagellida Bicosta spinifera species appeared. An increase in the species diversity of dinophytes was noted in 1973 ����� 1993 when 36 new species were listed in the NWBS (Nesterova, 1998). Later, 48 species were added to the list of which 37 were new to the Black Sea (Terenko, 2004; 2005). The dinophytes included potentially toxic species Alexandrium psedogonyaulax, Cochlodinium polykrikoides, Gyrodinium cf. aureolum (Terenko, 2005, 2005 а) as well as a new species (Prorocentrum ponticus) and a new variety (Prorocentrum micans var. micans f. duplex) (Krakhmalniy and Terenko, 2002). Similarly, new green algae appeared as the genera Monoraphidium (M. contortum, M. obtusum) and Scenedesmus (Sc. polyglobulus). At present, the number of marine and marine-brackish species decreased from 60.3% to 50.5%. Simultaneously, there has been an increase in freshwater and freshwater-brackish species ����� 49.5% and 39.7%, respectively.
The bulk of phytoplankton abundance and biomass is represented by a massive development of a small group of species in certain seasons. In the 1950s ����� 1960s, it was 41 species (Ivanov, 1967), and increased to 85 species in the past two decades (Black Sea, 1998). Besides the usual representatives as Skeletonema costatum, Cerataulina pelagica, Chaetoceros socialis, Leptocylindrus danicus, Prorocentrum cordatum, Pr.micans, other species like Leptocylindrus minimus, Chaetoceros insignis, Gyrodinium cornutum, cryptophytes Hillea fusiformis, coccolithophorides Emiliania huxleyi, freshwater diatoms Skeletonema subsalsum, Stephanodiscus hantzschii, blue-green algae of the genera Gleocapsa Merismopedia have entered into the NWBS phytoplankton bloom events. Common species including Heterocapsa triquetra, Scripsiella trochoidea were found in the NWBS in 1957-1961 (Ivanov, 1963). Besides, typical summer ����� autumn phytoplankton species like Thalassionema nitzschioides, Chaetoceros curvisetus were observed in 1950 ����� 1960, while Pseudosolenia calcar avis tended to decrease in frequency and abundance (Nesterova, 1987).
Table 5.1. Taxonomic composition of Black Sea phytoplankton in Ukraine waters
| Phyla | Northwestern part | Southeastern coast of Crimea | ||
| 1954-60* | 1973-05** | 1938-59*** | 1979-98**** | |
| Bacillariophyceae |
180 |
243 |
73 |
63 |
| Dinophyceae | 76 | 199 | 39 | 69 |
| Cryptophyceae | - | 8 | 3 | - |
| Chlorophyceae | 62 | 158 | 4 | 3 |
| Cyanophyceae | 24 | 37 | 4 | 2 |
| Prymnesiophyceae | 9 | 25 | 19 | - |
| Chrysophyceae | 4 | 6 | 5 | 27 |
| Dictyochophyceae | 5 | 7 | - | - |
| Prasinophyceae | - | 2 | - | - |
| Euglenophyceae | 12 | 11 | - | 1 |
| Choanoflagellidea | - | 1 | - | - |
| Total | 372 | 697 | 125 | 165 |
*������� Ivanov (1967); **������� Nesterova (2006); Nesterova, Terenko, 2007; ***������� Proshkina-Lavrenko (1955) and Ivanov (1965); **** ����� Senichkina et al. (2001)
Phytoplankton species in the southeastern coast of Crimea during the 1940�����1960s included 125 species and interspecies taxa from 5 algal phyla (Table 5.1) (Stroykina, 1950; Koshevoy, 1959; Mironov, 1961). In more recent years (1979�����1998), it increased to 165 species and varieties, which all indicated some changes in taxonomic composition. In contrast to the previous phase, dinophytes increased from 31.2 % to 41.8 and chrysophytes from 4% to 15.1%, while diatoms decreased from 58.4% to 38.1%. The species diversity of coccolithophorids rose to 74 new species which were common for the whole Black Sea, while 21 species were observed for the first time.
Compared to 211 species and varieties of planktonic algae recorded in the Sevastopol Bay in 1948 (Senicheva, 2000), there were 84 species in 1996 - 1997 and 173 species and varieties in 2001 ����� 2004. The latter was represented by 11 classes and 2 taxonomic groups; small flagellate algae and olive green cells. The basis of species diversity was similar to that of the NWBS and mainly composed of diatoms (45%), dinophytes (35%), and also Prasinophyceae (11%) (Polikarpov et al., 2003). The composition of dominant species of Skeletonema costatum, Leptocylindrus danicus, Chaetoceros socialis near Sevastopol for a period of 65 years has not undergone significant changes (Polikarpov et al., 2003). Pseudo-nitzschia delicatissima was an exception replacing Cerataulina pelagica in 2001 ����� 2004. Changes have been noted mainly in the composition of subdominant species replacing the dinophyte algae of the genera Glenodinium, Protoperidinium, Prorocentrum for Prymnesiophyceae genera of Syracosphaera and Emiliania. At the same time new diatom species have been encountered along the coast of Crimea, and a new variety has been described as Chaetoceros diversus var. papilionis (Senicheva, 2002) as well as dinophytes and silicoflagellates (Kuzmenko, 1966; Senichkina, 1973).
Western Black Sea shelf: The revision of phytoplankton check-list in 1980-2005 documented 544 species distributed among 8 classes (Fig. 5.1) which indicated more than two-fold increase as compared to 230 species listed in the 1954-1980 period. Although a part of this change was related to improved sampling strategy, microscope quality, frequency and regions of sampling, changing environmental conditions and introduction of exotic species also played a role (Moncheva, Kamburska, 2002). Diatoms (212 species) and dinoflagellates (162 species) constituted bulk of the phytoplankton pool; the Dinophyceae species contribution rose to about 40% of the total number, e.g. an increase of more than 3 times. The same also applies to other classes; for example, species from Cryptophyceae and Choanoflagellates groups have not been reported at all before 1980s. The presence of rare and new Bacillariophyceae (Thallasiotrix longissima, Th. antarctica Lioloma elongatum, L. pacificum,Triblionella acuminate),�� Dinophyceae (Ceratium furca var. bergii, Ceratium furca var. eugramma, Cochlodinium archimedes, C. citron, Kofoidinium lebourae), a number of Gymnodinium species�� (Gymnodinium canus, G. cintum, G. dominans, Gymnodinium fuscum etc.) Gyrodinium (Gyrodinium spirale), and numerous Cryptophyceae (mainly from genus Chroomonas, Cryptomonas, Rhodomonas, Leucocryptos etc), Chlorophyceae (Kirchneriella, Trochiscia, Treubaria), Chrysophyceae (Braarudosphaera bigelowi, Octactis octonaria, Calciosolenia granii v. cylindrotheca, etc.), and different microflagellates add significantly to the diversification of phytoplankton assembly. Most of the species listed above are mixo-heterothrophs, that might have important functional bearings at ecosystem level (Moncheva et al., 2005; 2006; Velikova et al., 1999; 2005). An apparent feature of phytoplankton communities after 2000 was further increase of species diversity and species richness per sample (normally above 40) as detected since the mid-1990�����s (Moncheva, 1999, Moncheva, 2003, 2005, 2006, 2007, Velikova et al., 1999, Velikova, 2004). More than 70% of the Shannon-Weaver biodiversity index was below the critical value of 2 in the 80-ies - the lowest being in summer of 1983-1985. This index dropped below 2 only during the winter-spring phytoplankton blooms in the 1990s, and this trend was maintained after 2000.
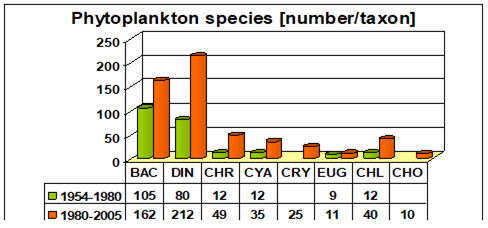
Fig. 5.1. Phytoplankton species diversity by taxonomic classes in the Bulgarian shelf.
BAC ����� Bacillariophyceae; DIN ����� Dinophyceae; CHR ����� Chrysophyceae; CYA ����� Cyanophyceae; CRY ����� Cryptophyceae; EUG ����� Euglenophyceae; CHL ����� Chlorophyceae; CHO ����� Choanoflagellates
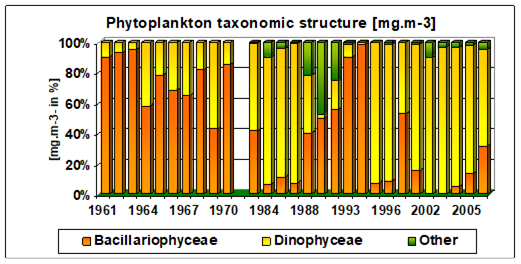 Fig. 5.2. Long-term
changes�� in phytoplankton taxonomic structure by biomass (mg/m3)
in pcentage in spring (3 nm Cape Galata) Fig. 5.2. Long-term
changes�� in phytoplankton taxonomic structure by biomass (mg/m3)
in pcentage in spring (3 nm Cape Galata) |
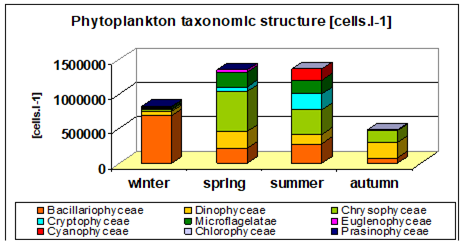
Fig. 5.2.a.�� Seasonal phytoplankton taxonomic structure by numerical abundance (cells/l-1) averaged for the period 2000-2006 for the Bulgarian shelf waters
The long-term taxonomic structure of phytoplankton biomass shows a likely shift from a diatom dominant system (constituting 60-90% of total biomass in the 60-ies) to an apparent dominance of opportunistic dinoflagellates in the 80-ies (mixo/heterothrophs) building between 60-80% of the biomass in spring), a partly regained dominance of diatoms in the late 90-ies- early 2000s to an increased share of chrysophytes and microflagellates (about 20 %) during 2001-2007 (Fig. 5.2). Thus, the Bacillariophyceae to Dinophyceae taxonomic biomass ratio in spring diverged from the reference ratio (Petrova-Karadjova ,1984) of (10:1).��
In winter, albeit the predominance of typical diatoms (Skeletonema costatum, Detonula confervaceae, Pseudonitzschia seriata, Pseudonitzschia delicatissima) by about 80%, species from other taxonomic groups (chrysophytes, microflagellates and mixothrophic dinoflagellates) often contributed to more than 50% of the total density and the large size dinoflagellates in the biomass (Fig. 5.2). In February 2005 the dinoflagellate Alexandrium ostenfeldii dominated the community (90%) in the Bay of Sozopol (Mavrodieva et al., 2007), and, Akashiwo sanguinea proliferated along the entire coastal area in February 2001, while Apedinella spinifera was a co-dominant species during the winter bloom of Skeletonema costatum in March 2003. The contribution of chrysophytes (Emiliania huxlei) in spring-summer 2003 oscillated between 40-80% of the total abundance, microflagellates between 20-50%. Dominance of Cyanophyceae and Chrysophytes marked atypical composition of phytoplankton community in autumn, along with the blooms of dinoflagellates (Gymnodinium sp., Prorocentrum minimum, Alexandrium monilatum) with biomass exceeding 15 g/m3 in Cape Kaliakra and Cape Galata in November 2003 that resembles the eutrophication period, irrespective of the reduction of the total abundance as compared to the 1990s.
The species composition of algal blooms tended to have significant decadal changes in the Romanian shelf as well. The late 1980s were characterized by relatively low (<30%) diatom content but dominated mainly (about 60%) by dinoflagellates (Fig. 5.2b; upper). This structure reversed in favour of diatoms by the early 1990s. Between 2001 and 2005, diatoms covered 48-66% of the total algal density except 2002-2003 in which two Cyanophyceae species Microcystis pulverea and M. aeruginosa dominated the blooms during the warm season. In the biomass, the dinoflagellates were more often dominant due to their large bio-volume, representing up to 65% of the whole biomass (Fig. 5.2b; lower).
Southern Black Sea: Compared to the NWS, 172 taxa were identified until 1995, of which 103 belonged to Bacillariophyceae, 52 to Dinophyceae, 12 to Chlorophyceae, 3 to Cyanophyceae and 2 to Chrysophyceae. The studies conducted between 1995-2000 introduced 115 additional taxa - 1�� from Cyanophyceae, 65 from Dinophyceae, 4 from Dictyochophyceae, 33 from Bacillariophyceae, 10 from Prymnesiophyceae, as well as 1 species of Euglenophyceae and 1 species of Acantharea. Only 6 taxa of Bacillariophyceae have been given as a new record for the Turkish coast after 2000. In total, 294 phytoplankton species consisting of 48.3% diatoms and 39.8 % dinoflagellates were identified in the Southern Black Sea so far (Table 5.3). The most important change observed within the last 10 years was the slight domination of dinoflagellates and other micro-nanoplankton species with respect to diatoms. The increase in the ratio of dinoflagellates could be related to the change in nutrient balance in addition to the temperature regime of the seawater.
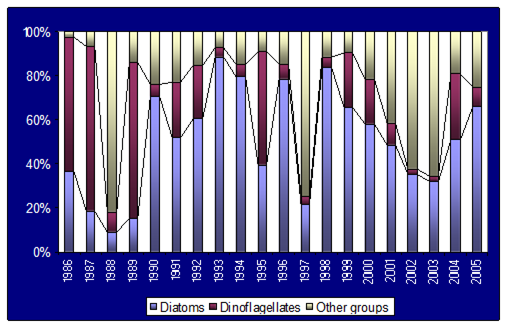
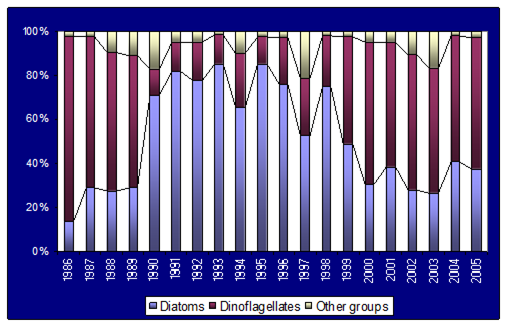
Fig. 5.2b. Percentage of main algal groups in density (upper) and biomass (lower) in front of Constanta waters during 1986-2005.
Table 5.3. Phytoplankton species distributed along the Turkish Coast of Black Sea.
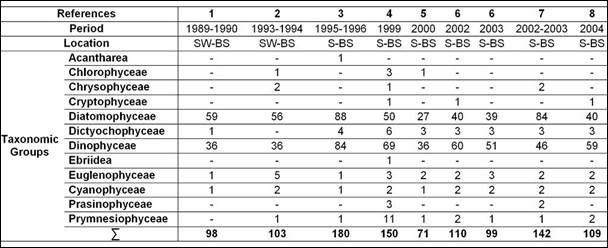
(1: Feyzioğlu, 1990. 2: Feyzioglu, 1996. 3: T��rkoğlu, 1998. 4: B��y��khatipoğlu et al., 2002. 5: Bircan et al., 2005. 6: Şahin, 2005. 7: Baytut, 2005. 8: Bat et al., 2005. SW-BS: South Western Black Sea. S-BS: Southern Black Sea)
Georgia shelf region: According to the data from the 1970s, 99 phytoplankton species were registered in the south-eastern part of the Black Sea: 116 phytoplankton species were identified in 1982-1987, and 155 species in the 1990s. The present species composition included 203 species and subspecies of Bacillariophyceae, Dinophyceae, Chlorophyceae, Cyanophyceae, Chrysophyceae, Euglenophyceae. Species diversity and total biomass was built mainly by�� representatives of 2 large groups: Bacillariophyceae (diatoms) and Dinophyceae ( dinoflagellates). Most dominant diatom species included Skeletonema costatum, Chaetoceros socialis, Ch.curvisetus Ch.affinis Cyclotella caspia, whereas the dominant dinoflagellates were Prorocentrum cordatum, Pr. micans, Prorocentrum compressum, Protoperidinium pellucidum, P.steinii, Hetercocapsa triguetra, P.bipes, Cetarium fusus, C. furca. In some�� years, high abundance of���� blue green, green and euglena algae such as Microcystis acruginosa, Anabaena flos-aquae, Ankistrodesmus falcatus, Scenedesmus acuminatus, Trachaelomonas volvocina var. punctata and Euglena viridis was documented Most of them were recorded in estuaries where water salinity was as low as 8-10psu, in ports and sewage discharge regions.
Northeastern Black Sea: According to 2001-2005 monitoring data, in the Caucasian coast of the Black Sea 100-160 phytoplankton species were listed that included mixotrophic and heterotrophic species and benthic diatoms: about 60 Bacillariophyceae species (including common benthic diatoms like Thalassionema nitzschioides), 78 dinophyceae species (including heterotrophs traditionally accounting within phytoplankton, e.g. Ceratium spp., Dinophysis spp., Diplopsalis spp., Protoperidinium spp., etc.), 4 species of Silicoflagellates, 1 Chrysophyceae�� 5 Prymnesiophyceae, 1 Euglenophyceae, 1 Prasinophyceae, and 1 identified cyanobacterium. This number was close to the earlier data (119 species) from the same region based on one-year monitoring of microphytoplankton in Gelendjik coast (Zernova 1980).
Interior Black Sea: Long-term dynamics of phytoplankton communities in the interior basin has been studied using the phytoplankton data base, for the period from 1968 to 2007 (Mikaelyan, 2008). Stations are located in the Northern part of the Black Sea deeper than 150 m, mainly in its Northeastern area. Because of strong cross-shelf water exchanges, the key phytoplankton species in the shelf and deeper areas are usually the same and thus the data from stations shallower than 150 m were excluded from the analysis. Total number of stations and samples exceded�� 1000 and 2600, respectively
Long-term changes of 5 taxonomic groups were analyzed: Dinoflagellates, Diatoms, Coccolithophorids, Silicoflagellates and Flagellates for the upper mixed layer and lower part of the euphotic zone. Annual changes were studied for 4 time periods: spring (March-April), early summer (May-June), summer (July-September) and autumn (October-November). Due to the lack of data, winter season was not taken into consideration
The most striking feature of the spring season is a decreasing trend of diatoms abundance from 60-80% of the total phytoplankton biomass in 1970-1990 to 15-25% after 1995 (Fig. 5.3).�� They were replaced by dinoflagellates and phytoflagellates. The early summer season (May-June) was characterized by an increase of coccolithophorids abundance from 5-15% before the mid-1980s to 20 in the 1980s and 50% after 1994 until the present. On the contrary, dinoflagellate standing stock decreased from 60-80% to 15-25% during the same period. The role of diatoms increased from 1% to 60% in the upper mixed layer in summer season of the last two decades. The same trend was not so evident for the pycnocline layer where the most noticeable change was the reduction of silicoflagellate abundance. It comprised from 10 to 90% of the total phytoplankton biomass in 1969 and only from 0 to 5% after 1970�����s. For the autumn season, the role of dinoflagellates in phytoplankton biomass decreased from 60-90% to 10-40% in the upper mixed layer. An opposite trend was recorded for flagellates. Their input to the total phytoplankton biomass increased from 0-5% to 20-70%. Thus, phytoplankton species community was dominated by dinoflagellates in spring and early summer and diatoms in summer and autumn after 1994. Phytoflagellates also became a dominant component of the community with contribution more than 20% throughout the year. Coccolithophorids also became a predominant part of the community during May-June as also supported by the ocean color data (Cokacar et al., 2003).
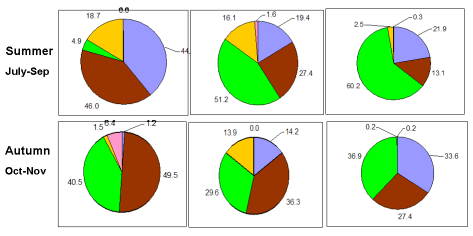
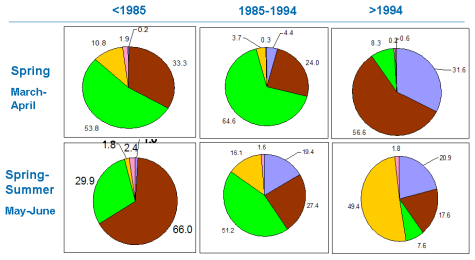

Fig. 5.3. Phytoplankton community structure within the interior basin in different seasons prior to 1985, during 1985-1994 and after 1994.
The most remarkable changes occurred during the seasonal plankton successions in the cold climate period 1985-1994. The predominance of diatoms in spring shifted to the prevalence of dinoflagellates and phytoflagellates. Substantial increase of coccolithophorids was reported in spring-summer instead of dinoflagellates. Dinoflagellates replaced by diatoms in summer and silicoflagellates by phytoflagellates in autumn. Thus, the classical seasonal phytoplankton succession with the spring diatoms bloom followed by proliferation of dinoflagellates and then phytoplagellates was not observed any longer. They all indicated a ���œregime shift���� in phytoplankton community structure during the early 1990�����s. This mode still prevails and the phytoplankton community structure of the deep Black Sea has not yet return to the state observed during the 1960-70s.
5.3. Long-term changes in algal blooms
Northwestern Black Sea shelf: For the 1973 ����� 2005 period, 158 bloom cases were registered by 50 species and varieties of algae (see Table 5.4 in Appendix) including 25 species of diatoms, 7 of dinophytes, 11 of blue-green, 4 of green, 2 of crysophytes algae and 1 of Euglenophyceae. 53 bloom events were registered in 1973 ����� 1980 over more than half of the northwestern Black Sea area (Nesterova, 2001). The most remarkable outbursts were caused by Prorocentrum cordatum, which initiated ���œa red tide���� at the sea surface in September 1973, (Nesterova, 1979) after a similar event that occurred�� in Sevastopol Bay in 1909 (Zernov, 1913). Also ���œblooming���� of Cerataulina pelagica and Emiliania huxleyi was first noted in 1973-1980 (Nesterova, 2001).
From 1980 to 1990, the number of phytoplankton blooms decreased to 33. However, outbursts of rare species such as (Leptocylindrus minimus), and of new species (Microcystis pulverea, Gleocapsa minima, etc.) increased in number. Most frequent ���œblooms���� were caused by Skeletonema costatum, Cerataulina pelagica, Prorocentrum cordatum, Chaetoceros socialis. In 2001, outbursts of dinophytes ����� Gymnodinium simplex, G. sphaeroideum, Scrippsiella trochoidea and Akashiwo sanguinea were also recorded.
Massive algal outbursts were rarely observed along the Crimean coast, and their maximum abundance was always lower than in the NWS (Mashtakova and Roukhiyainen, 1979; Senichkina, 1993). For instance, Skeletonema costatum abundance along the Crimean coast reached 0.9 millon per liter (Senichkina, 1993), while it was 30.6 millon per liter in the NWS (Nesterova, 2001).
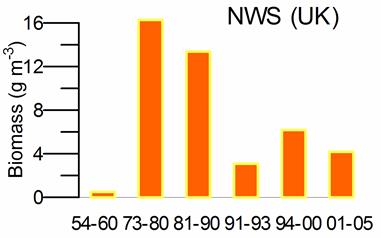
Fig. 5.4. Changes in phytoplankton biomass in 1954-1960s and in 1973 ����� 2005s in the northwestern Black Sea shelf.
The highest values of phytoplankton biomass in the NWS were observed in 1973 ����� 1980 (Fig. 5.4) and attributed to the heavy eutrophication (Nesterova, 1987). The average phytoplankton biomass increased almost 17 times -�� from 0.9 g m -3 to 16.0 g m -3�� as compared to the 1950-1960s (Nesterova, 1987). From 1981 to 1993 the phytoplankton biomass started to decrease gradually with a minimum biomass registered in 1991-1993. In 1994 ����� 2000, the biomass was around 6.0 g m -3 and the contribution of dinophyte algae tended to decrease in contrast to more intense development of diatoms (Derezyuk et al., 2001). The proliferation of Skeletonema costatum was more intensive as an indicator of hypereutrophic waters (Nesterova, 2003). The decrease in phytoplankton biomass to around 4.0 g m-3 in 2001-2005 was accompanied by an increased role of dinophytes. In 2005, a ���œred tide���� dominated by Scrippsiella trochoidea and blue-green algae was documented near the Odessa coast.
Phytoplankton data for the period 1988 ����� 2004 from the estuarine part of the Danube ����� the main source of Black Sea eutrophication (Zaisev at al., 1989) have been analyzed for three different periods (Nesterova, 1998; Nesterova, Ivanov, 2001; Nesterova, 2005). The phytoplankton abundance did not change much during these periods and was on the average 3.6 million cells∙l-1 (Fig. 5.5a). More recent data for 2003-2008, on the other hand, show large interannual variability in the range of 0.5-15 million cells∙l-1 (Fig. 5.5b). The biomass gradually decreased from 38.0 g m -3 in the 1980s to ~5.0 g m -3 in 2000-2004, mostly due to the reduction in dinophytes (Heterocapsa triquetra) in spring and increase in diatoms (small-size species, such as Skeletonema costatum, Chaetoceros socialis). The latter average value included extreme cases such as 14.5 g m -3 in 2003 and 2 g m -3 in 2004. The biomass manifested an increasing trend after 2004 up to 8 g m -3 in 2008.�� A similar decrease in phytoplankton biomass from the 1980s to the 1990s and enhanced growth of Skeletonema costatum was also observed in the Odessa area (Nesterova and Terenko, 2000) where the number of blooming species changed irregularly year-to-year (Fig. 5.5c).
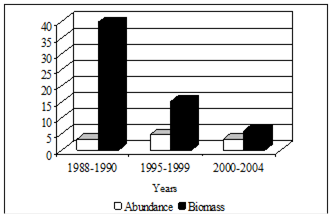
Fig. 5.5a. Change in abundance (million cells·l-1) and phytoplankton biomass (g·m-3) of the Danube estuarine area (1988-2004).


Fig. 5.5b. Change in abundance (blue bars; million cells·l-3) and phytoplankton biomass (red bars; g·m-3) of the Danube estuarine area (2003-2008).
Near southeastern coast of Crimea the abundance and biomass of phytoplankton have also increased in the past 50 years. Small size species of diatoms (Skeletonema costatum) and coccolithophorids (Emiliania huxleyi) dominated phytoplankton blooms (Kuzmenko at al., 2001). Dominance of coccolithophorids in the summer-autumn period was particularly prominent in the coastal zone near Sevastopol in 2001-2003 (Polikarpov at al., 2003).


Fig. 5.5c. Number of blooming species in the coastal area of the Odessa Bay.
To summarize, the phytoplankton structure and dynamics in the NWS have been altered not uniformly in the different areas of the shelf during the past 50 years. The phytoplankton species diversity increased and this increase was accompanied by changes in the ratio of diatoms and dinophyte algae in favour of dinophytes and declining contribution of diatoms during the 1970-1980s. In the Sevastopol area and the southeastern coast of Crimea, the species diversity of coccolithophorids increased. A reverse trend was observed after 2000 characterized by elevated diatom contribution and reduction of dinophyte abundance along with a decrease in the total phytoplankton biomass that imply a decline of�� eutrophication impact and a partial recovery of the northwestern shelf ecosystem (Nesterova, 2003).
Romanian shelf area:
The phytoplankton density and biomass followed the general tendency of decrease in the Romanian Black Sea waters after the 1980�����s as well. Both abundance and biomass in coastal waters near Constanta underwent a significant reduction during 2001-2005 that accounted for 75% and 55% decrease relative to the 1980�����s (Table 5.5 and Fig. 5.6) and approaching to values comparable to the 1960s. Algal bloom frequency and concentration declined: out of 24 blooms, only three exceeded 50 million cells/l whereas this number was 15 in the 1980s and 4 in the 1990s (Table 5.5). Besides, diminished number and intensity of algal blooms, the number of blooming species reaching density higher than 10 million cells/l was reduced from 11 in the 1990s to 9 in 2001-2005 (Fig. 5.7). Cyclotella caspia (maximum 78.6 �·106 cells/l),�� dinoflagellates Prorocentrum cordatum (15.3�·106 cells/l), Scrippsiella trochoidea (25.2�·106 cells/l) and Heterocapsa triquetra (16.0 �·106 cells/l), cyanophytes Microcystis pulverea (16.7 �·106 cells/l), M. aeruginosa (15.0 �·106 cells/l) and M. orae (271.9 �·106 cells/l), diatoms Tabellaria sp. (maximum 17.1 �·106 cells/l) and Navicula sp. (maximum 67.5�·106 cells/l) produced the most significant blooms. The last five species were alochtonous fresh-brackish water species introduced into the sea mainly by the River Danube, the blooms occurring in regions of relatively low salinity and warm water. The relatively large phytoplankton biomass in 2007 (Fig. 5.6) was due to large-size dinoflagellate bloom, but the abundance was low (Fig.5.6).��
Table 5.5. Mean phytoplankton density and biomass in the shallow waters in front of Constanta and number of blooms registered in Romanian marine waters during different periods.
| Period | Density(106 cell/l) | Biomass(g/m3) | Number ofblooms | Number ofBlooms, density > 50�·106 cell/l |
| 1959-1965 | 0.887 | 2.00 | ||
| 1983-1990 | 5.870 | 7.14 | 49 | 15 |
| 1991-2000 | 2.261 | 5.960 | 29 | 4 |
| 2001-2005* | 1.481 | 3.22 | 24 | 3 |
* Mean minus extreme values/atipique from August and September, 2000 and 2001.
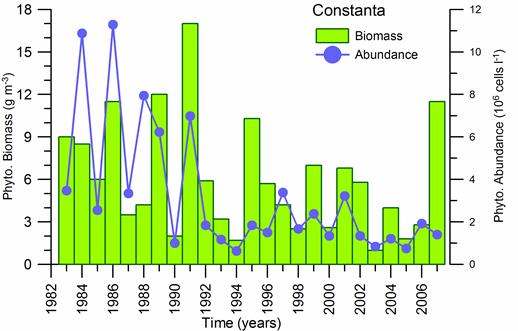
Fig. 5.6. Change in annual-mean density and biomass of phytoplankton in 1983-2006 in Constanta.
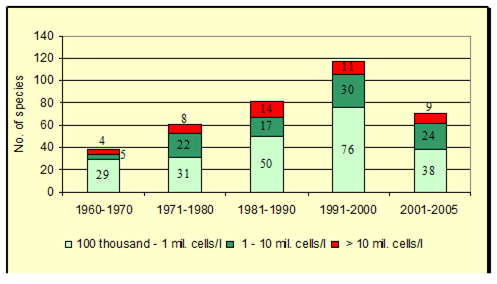
Fig. 5.7. Number of phytoplankton species contributing to blooms in Romanian waters between 1960 and 2005.
Bulgarian shelf area: The 1980�����s and the early 1990s were characterized by most intense blooms and a shift to r-strategy species (Moncheva, Krastev, 1997). A total of 31 monospecific blooms occurred, out of which seven attained densities higher than 50 mil cells.l-1 and the biomass varied between 10 and 20 g m-3. Starting by the mid-1990s, an overall decreasing trend in the density and biomass of all dominant species was observed down�� to a total biomass of about 3 g m-3 after 2000 (Fig. 5.9). Along with the reduction of frequency, duration, and intensity of phytoplankton outbursts (only 3 cases of abundance exceeding 50 mil ��cells.l-1 reported in the late 1990s and���� none in the period after 2000), a decline in the extent and duration of exceptional events, especially in summer was documented. The list of bloom producing species was further diversified and several species contributed to a single bloom event (Moncheva et al., 1995, Velikova et al. 1999, Moncheva et al., 2001) ����� Fig.5.7a.
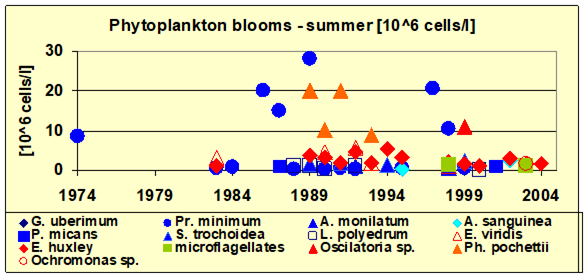
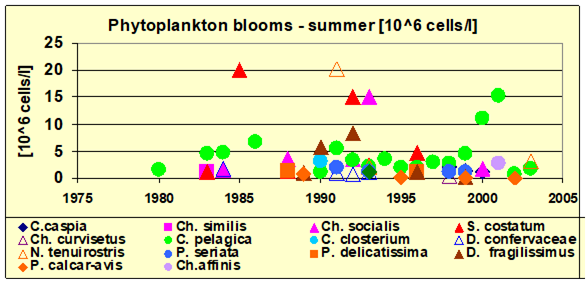
Fig. 5.7a. Phytoplankton species contributing to summer blooms in Bulgarian coastal area between 1975 and 2005
After 2000, a number of controversial trends were evident in summer, such as proliferation of large diatoms (Pseudosolenia calcar avis and Cerataulina pelagica) at the level of red-tide biomass (higher than 20 g/m3 in August 2002), elevated occurrence of small heterothrophic microflagellates and large dinoflagellates (Akashiwo sanguinea and species from genus Ceratium), and almost recurrent blooms of Emiliania huxleyi (Moncheva et al., 2006). The presence of species from genus Dinophysis (D. acuta ����� 4.4 x10³ and D. caudata - 1.7 x10³ ����� Petrova and Velikova, 2003) and Pseudonitzschia cited as toxic for other areas of the world ocean all together signify perturbed phytoplankton succession and ecosystem instability.
The summer frequency distribution of EQ classes during the period 1990-2000 and 2000-2007 based on chlorophyll-a and phytoplankton biomass (Moncheva and Slabakova, 2007) revealed a reduction of ���œpoor/bad���� conditions from more than 70% to less than 40% in the Varna Bay and to none at station 201 near Cape Kaliakra, and to about 40% at station 301, near Cape Galata (Fig. 5.10), indicating an improvement in the environment of the region.�� Nonetheless the ���œgood���� class frequency maintained below 50% in Varna Bay implies a continuation of eutrophic conditions of ecological concern.
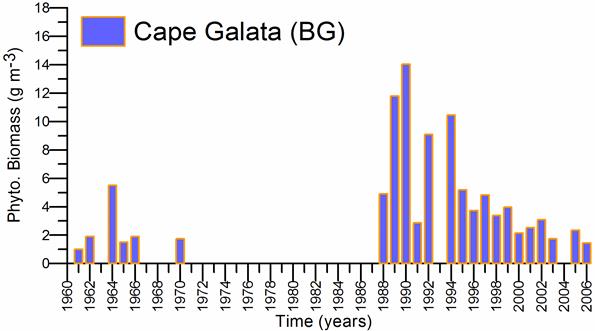
Fig. 5.9. Long term changes of phytoplankton biomass at 3 nm away from the Cape Galata. The data prior to 1970 were taken from Petrova-Karadjova (1984 and 1990).
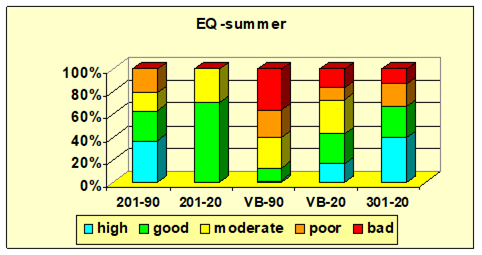
Fig. 5.10. Frequency of EQ classess of summer phytoplankton blooms averaged for 1990-2000 (indicated by ���œ90����) and 2000-2007 (indicated by ���œ20����) for coastal stations (201 near the Cape Kaliakra�� and 301 near the Cape Galata, and VB-Varna Bay).
Southern Black Sea: The analysis of the data collected along the Turkish coast during two different hydrological phases: stagnant period (where significant nutrient injection is possible due to deeper mixed layer in cold seasons) and non-stagnant period (shallower mixed layer; warm seasons) suggested a common trend of lower phytoplankton abundance after 1994 (Fig. 5.11), most likely related to improvement of eutrophic conditions in the southern Black Sea coastal waters. Relatively high abundance in the stagnant periods reflected mainly the contribution of the spring blooms.
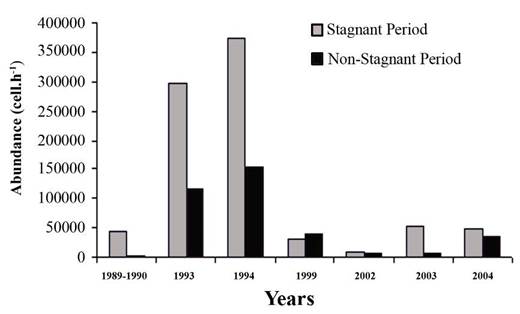
Fig. 5.11. Comparison of phytoplankton abundance during two contrasting periods (i.e. stagnant and non-stagnant) in 1989-2005.
Georgia shelf region: Since 1981, phytoplankton was sampled along 8-12 transects at standard depths (0, 5, 10, 25, 50, 75, 100m) and 68-70 stations along the Georgian coast from Chorokhi River up to Bzibi River. The average annual abundance and biomass during 1992, 1998, 1999 and 2005 (Fig. 5.12) indicated a rather uniform level during the 1990s (around 100-150x103 cell l-1 and 2.5 g m-3) in coastal waters between Poti and Batumi. The exceptionally high density and biomass of phytoplankton (788 x103 cell l-1 and 11.7 g m-3) were recorded in both regions during 2005 that were associated with proliferation of large Bacillariophyceae species Coscinodiscus granii, Hyalodiscus ambiguus, Pseudosolenia calcar avis, Dactyliosolen fragilissimus, Prorocentrum micans.


Fig. 5.12. Average annual abundance and biomass of phytoplankton in Georgian waters in 1992-2005.
Interior Black Sea: Phytoplankton biomass as an average of all measurements conducted within the interior basin at stations deeper than 150 m also indicate distinct decadal changes (Fig. 5. 13). The biomass which was only about 2 g m-2 during the 1960s increased up to 10 g m-2 after the mid-1970s and then to about 20 g m-2 in the 1980s and the early 1990s, exceeding even 50 g m-2 in 1985 and 1992. By the mid-1990s, phytoplankton biomass oscillated annually between 5 g m-2 and 20 g m-2 and therefore is still comparable with the conditions of eutrophication phase.
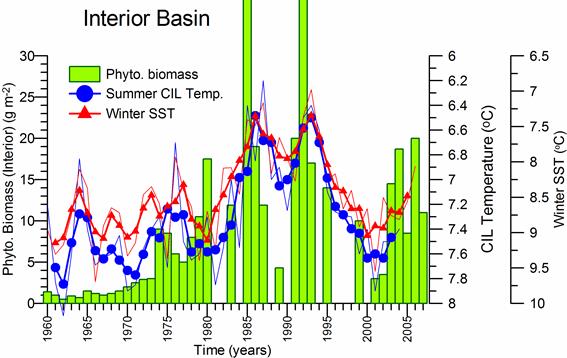
Fig. 5.13. Long-term changes of total phytoplankton biomass within the water column of interior basin (g m-2) compiled from all available measurements at locations deeper than 100 m during May-September, and the December-March mean SST (oC) as an average of various data sets (Hadley, Reynolds-NCEP, Pathfinder), and the mean temperature of CIL during May-October.
As the spring-summer phytoplankton productivity is mainly driven by the amount of nutrients entrained into the euphotic zone by winter convection, it is expected that phytoplankton biomass should be proportional to severity of winters that is indicated in Fig. 5.13 by the winter-average SST and mean temperature of the Cold Intermediate Layer (CIL) during May-October. As shown in Fig. 5.13, phytoplankton biomass follows closely temperature variations with higher (lower) biomass during cold (warm) years. This close relation implies that a part of the biomass increase in the 1980s was imposed by climate impact, in addition to eutrophication. The recent increase in biomass after 2002 may also be attributed to the climate as there is no evidence of increase in eutrophication within the interior basin during the recent years.
5.3. Seasonal dynamics
The averaged data for the NWS during 1975-2005 suggest three particular peaks in the annual dynamics of phytoplankton biomass. The first one occurred in April, usually dominated by diatoms (Skeletonema costatum, species of the genera Thalassiosira), the second- in June-July dominated by dinoflagellates (Prorocentrum cordatum) making up 84.6 % of the total biomass, and the third and highest one in September-October due to diatoms (Cerataulina pelagica, Pseudonitzschia seriata, Ps. delicatissima, Leptocylindrus danicus) and dinophyte (Prorocentrum cordatum, Goniaulax polyedra), which contributed to biomass irregularly (Fig. 5.14). During diatoms outbursts, they build up about 70% of the biomass while dinophyte contribution decreased to 22%. Because of their small cell-size coccolithophorids contributed to only 8% of the biomass.�� The most important feature was an almost one order of magnitude increase of the monthly phytoplankton biomass during 1973-2005 as compared to 1954-1974 - Fig. 5.14
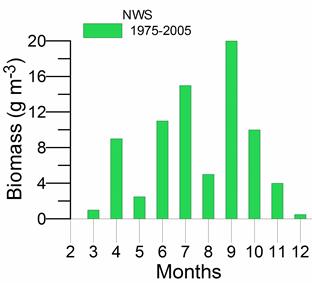
Fig 5.14. Monthly changes of mean phytoplankton biomass in the northwestern coastal waters during 1975-2005.
During the summer outbursts the bulk of phytoplankton biomass was concentrated in the upper 0-10 m, except in shallow waters. The difference in the abundance between the surface and near bottom layers increased from spring to summer, decreasing in the autumn. The highest abundance and biomass were observed in the Danube River runoff impacted zone of the NWS, with frequent and intensive blooms, while the abundance and biomass declined sharply by several orders of magnitude beyond this zone. During spring and autumn intense diatoms outbursts were registered locally near river estuaries. In summer during permanent blooms, large areas of high phytoplankton biomass were covered between the estuaries of the Dnieper�����Bug Liman and the Danube.
In the Bulgarian shelf area, during the cold years of the 1980s as well as in 1994, the annual phytoplankton biomass manifested pronounced late-winter and spring peaks, often exceeding 10 g m-3 - to more than 30 g m-3 as observed in the 1990 spring (Fig. 5.15). The biomass decreased considerably since 1995 down to less than 5 g m-3 after 2000, associated with the onset of a decade-long climatic warming phase along with the reduction of nutrients and the shift in their ratios (Moncheva et al, 2008). Contrary to the cold climate phase, there was no clear seasonal pattern, and the timing of phytoplankton intensive growth varied irregularly.
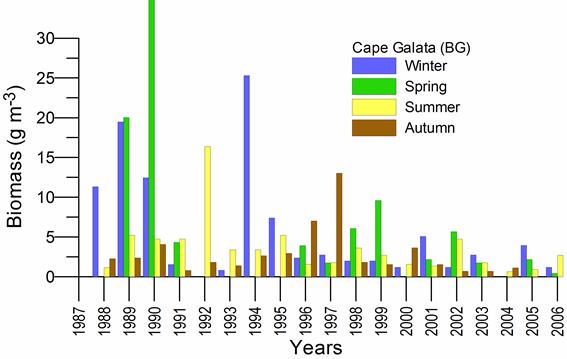
Fig. 5.15. Long term changes of phytoplankton biomass at different seasons 3 nm away from the Cape Galata.
In the northeastern shelf, the phytoplankton growth started in February by proliferation of small diatoms, usually Pseudo-nitzschia pseudodelicatissima most frequently co-dominated by Skeletonema costatum, Dactyliosolen fragilissimus, Cerataulina pelagica, Hemiaulus hauckii, and Chaetoceros spp. and nanoplankton flagellates. In 2004, Thalassiosira spp. alone reached a density of 100 000 cell l-1. The spring peak of phytoplankton diversity and abundance occurred���� in April. At this time, large diatoms (e.g. Pseudosolenia calcar avis, Proboscia alata) and heterotrophic dinoflagellates dominate in the community biomass. The diversity and abundance decreased in May-June, with the exception of cases of massive proliferation of coccolithophores or a re-intensified growth of P.pseudodelicatissima and/or Thalassiosira spp., populations.
The beginning of most intensive and longest period of phytoplankton growth and maximum diversity was in July, culminating in early August, parallel to the annual maximum of surface water temperature. The phytoplankton abundance is dominated by dinoflagelates. Monospecific blooms may also occur like Cochlodinium polykrikoides bloom at Bolshoy Utrish (Krasnodar Krai) in 2001 (Vershinin et al., 2005). September-October was a time of gradual decline of phytoplankton community: total cell density and biomass decreased, and the portion of dinoflagellate species also. The intensity and duration of this annual phytoplankton succession at Caucasian coast varied from year to year, but the general pattern was maintained.
The succession cycle in the northeastern Black Sea coastal waters starts typically with the outburst of a single species of high growth rate, or less frequent, several of several species - small diatoms and/or coccolithophores. Then, they are replaced by heterotrophic dinoflagellates at temperatures higher than ~15oC. The data suggested that biotic factors (life cycle, growth rate and grazing, etc.) drive the start and evolution of each succession cycle, whereas the initiation, intensity and duration are determined mostly by water temperature.
5.4. Conclusions and recommendations
The overall analysis provided rather contrasting trends of phytoplankton assembly during the present decade. On the one hand, the increased species diversity and richness, reduced frequency and magnitude of phytoplankton blooms and thus decrease of total biomass and abundance, reduced frequency of ���œbad/poor���� EQ classes all point to an improvement of the ecological state of the Black Sea. On the other hand, concomitantly with still high nutrient concentrations, the increased dominance of heterotrophic dinoflagellates and elevation of abundance and biomass of ���œother���� species (e.g. coccolithophores and phytoflagellates) reflect features of a perturbed transitional state and an ongoing ecological instability. The seasonal species succession manifested irregular pattern and varied regionally and from year to year. A notable character of the annual phytoplankton structure is the substantial increase of coccolithophorids in May-June all over the basin.
Due to the high sensitivity of phytoplankton communities to external forcing as well as highly dynamic internal structure of the ecosystem, the frequency of sampling is critical for setting an adequate monitoring system for phytoplankton related indicators. Occasional high phytoplankton blooms observed during the present decade in many coastal waters requires a systematic monitoring. Monthly sampling is strongly recommended, while sampling during spring and summer is an imperative. Remote sensing ocean color data with an improved algorithm for coastal waters are crucial especially in spring-summer for capturing the spatial features of bloom events.
Appendix
Table 5.4. Maximum abundance (million cells/l) of species that caused phytoplankton blooms in the northwestern Black Sea in the 1954-1960s and in 1973-2005.
| Species | 1954�����1960s* | 1973-2005 |
| Bacillariophyceae | ||
| Melosira granulata (Her.) Ralfs | 1.8 | 2.9 |
| Skeletonema costatum (Grev.) Cl. | 32.0 | 30.6 |
| Sk. potamos (Weber) Hasle | 8.4*** | |
| Sk. subsalsum (A.Cl.) Bethge | - | 8.5 |
| Thalassiosira parva и Th. subsalina Pr.-Lavr. | 2.7 | 54.0 |
| Cyclotella caspia Grun. | 5.2 | 6.2 |
| C. glomerata Bachm. | 22.5*** | |
| Stephanodiscus hantzschii Grun | - | 20.8 |
| St. socialis Makar. Et Pr.-Lavr | - | 4.9** |
| Leptocylindrus minimus Grun. | - | 16.0 |
| L. danicus Cl. | 72.0 | 28.0 |
| Dactyliosolen ��fragilissimus (Bergon) Hasle. | 0.1 | 12.2** |
| Chaetoceros affinis Laud. | - | 1.9 |
| Ch. Insignis Pr.-Lavr. | - | 1.7 |
| Ch. karianus Grun. | - | 4.0 |
| Ch. socialis Laud. | 5.4 | 16.7 |
| Ch. rigidus Ostf. | - | 14.0** |
| Cerataulina pelagica (Cl.) Perag. | 0.6 | 37.0 |
| Diatoma elongatum (Lyngb.) Ag. | 0.7 | 6.7 |
| Synedra actinastroides Lemm. | - | 1.9 |
| Asterionella formosa Hass. | - | 2.3 |
| Nitzschia tenuirostris Mer. | - | 28.6 |
| Cylindrotheca closterium (Ehr.) W.Sm. | - | 16.0 |
| Pseudo-nitzschia seriata (Cl.) H. Perag. | - | 12.4 |
| Surirella ovata var.salina (W.Sm.) Hust. | - | 10.7 |
| Dinophyceae | ||
| Prorocentrum cordatum (Ostf.) Dodge | 4.3 | 224.0 |
| Pr. micans Her. | - | 15.4** |
| Gymnodinium sphaeroideum Kof.�� | - | 4.0 |
| G.simplex (Lohmann) Kof. et Sw. | - | 251.1 |
| Akashiwo sanguinea (Hirasaka) G. Hans. et Moestr. | - | 140.0 |
| Heterocapsa triquetra (Her.) Stein. | - | 18.0 |
| Scrippsiella trochoidea (Stein) Balech ex Loeblich III | - | 125.4 |
| Cyanophyceae | ||
| Microcystis aeruginosa Kutz. | 4.3 | 15.0 |
| M. pulverea (Wood) Elenk. F. pulverea | - | 94.8 |
| Gleocapsa minor (Kutz.) Hollerb. Ampl. | - | 2.6 |
| G. minima (Keissl.) Hollerb. | - | 4.4 |
| Merismopedia glauca (Her.) Nag. | - | 1.0 |
| M. minima (Keissl.) Hollerb. | - | 22.0 |
| M. punctata Meyer | - | 8.1 |
| M. tenuissima Lemm. | 44.8 | 8.2 |
| Anabaena spiroides Kleb. | 2.5 | 6.3 |
| Aphanizomenon flos-aquae (L.) Ralfs | 0.9 | 34.0 |
| Oscillatoria kisselevi Anissim. | - | 147.0 |
| Chlorophyceae | ||
| Monoraphidium arcuatus Korsch. | - | 1.9 |
| Scenedesmus obliquus (Turp.) Kutz. | - | 8.6 |
| Sc. quadricauda (Turp.) Breb. Var. Quadricauda | 1,4*** | |
| Micractinium pusillum Fr. | - | 6.6 |
| Chrysophyceae | ||
| Emiliania huxleyi (Lohm.) Hay & Mohler | - | 9.0 |
| Dinobryon sp. | - | 4.0 |
| Euglenophyceae | ||
| Eutreptia lanovii Steuer | - | 1.7 |
* ����� Ivanov (1967); ** ����� Теrеnко, Теrеnко (2000); -*** Nesterova, Terenko, 2007
References
Bat, L., Kıdeyş, E.A., Oğuz, T., Beşiktepe, Ş., Yardım, ���., G��ndoğdu, A., �œst��n, F., Satılmış, H.H., Şahin, F., Birinci ���.Z. and Zoral, T. (2005) Monitoring of Basic Pelagic Ecosystem Parameters in the Central Black Sea, (in Turkish). Proje no: DPT 2002 KI20500 (TAP-S013 No�����lu Proje). 488 pp.
Baytut, ���., G��n��lol, A., Koray, T. (2005) New records for marine phytoplankton of Turkish Seas from Southern Black Sea coasts //�� E.U. Journal of Fisheries & Aquatic Sciences, 22(1-2), 229�����231.
Bircan, R., Bat, L., Kıdeyş, A., Satılmış, H.H., �œst��n, F., Şahin, F. ve ���zdemir, Z. B. (2005). Karadeniz�����in Sinop B��lgesinin Alt Besin Tabakalarının Dinamik Ve Zaman Serileri, T��bitak, Proje No: 199Y121, 75s (in Turkish).
Black Sea Biological Diversity (1998) Black Sea Environmental Series, New York, 351pp.��
B��y��khatipoğlu, S., Bat, L., Kıdeyş, A.E., Tuğrul, S., Zagorodnyaya, J., G��ndoğdu, A., Akbulut, M., ���ulha, M., G��nl��g��r, G., Eker, E., and Satılmış, H.H. (2002) Process-Oriented Biochemical Studies of the Central Black Sea off the Cape Sinop, (in Turkish). T�œBITAK Pro. No: YDAB���AG- 619/G 197Y156. 92pp.
Cokacar, T., Oguz, T., and Kubilay, N., 2004. Interannual variability of the early summer coccolithophore blooms in the Black Sea: impacts of anthropogenic and climatic factors. Deep-Sea Res. I., 51, 1017�����1031.
Derezyuk N. V., Gakailo O. V., Nikulina E. G. Tanasyuk E. G. (2001) Main characteristics of Black Sea hydrobionts at the end of the 20th century (1999 ����� 2000). Naukovi. Zapiski. Ternopilskogo. Derzhavnogo. Pedagogicheskogo Universitety. Seria biologiya. Spetsialnyi. Vypusk. Gidroecologiya. 14, 125-126.
Feyzioglu, M. (1994) Seasonal changes at the net phytoplankton living Trabzon coasts of the westhern Black Sea. Turkish Journal of Biology, 18, 161�����171.
Fevzioğlu, A.M., Tuncer. S. (1994) Seasonal changes at the net phytoplankton living Trabzon coast of the eastern Black Sea. Tr. J. Biol., 18: 161-171.
Guslyakov N. E., Terenko G. V. (1999) Seasonal dynamics of phytoplankton of the coastal zone of Odessa Bay of the Black Sea (Ukraine). Algologiya, 9(4), 10-23.
Ivanov A. I. (1963) On the characteristics of the systematic composition of phytoplankton in the northwestern Black Sea. Naukovi. Zapiski. Odeskoi. Biologichnoi stantsii, 5, 51����� 54.
Ivanov A. I. (1965) Characteristics of the qualitative composition of Black Sea phytoplankton. In: The study of plankton of the Black and Azov seas. Kiev: Naukovs. Dumka, 17����� 35.
Ivanov A. I. (1967) Phytoplankton in the northwestern Black Sea. In: Biology of the northwestern Black Sea. ����� Kiev: Naukova. dumka,�� 59 ����� 75.��
Ivanov A. I. (1982) Phytoplankton of the estuarine areas of rivers of the northwestern Black Sea. - Kiev: Naukova. dumka,�� 211 p.
Koshevoy V. V. (1959) Observation on Black Sea phytoplankton near Karadag. Byulleten Okeanographitcheskoy Komisii pri Prezidiume AN SSSR, 3, 40 ����� 45.
Krakhmalniy A. F., Terenko G. V. (2002) A new form of Prorocentrum micans Ehr. var. micans f. duplex Krachmalny et Terenko (Prorocentrales, Dinophyta) found in Black Sea plankton. Algologiya, 12, 476 ����� 480.
Krakhmalny A.F. and Terenko G.V. (2004) Prorocentrum ponticus sp. nov., a new species of Dinophyta from the Black Sea. Int. J. of Algae, 6, 35-42.
Kuzmenko L. V. (1966) Two species of dinoflagellates, new for the Black Sea. News of systematic of lower plants.�� AN SSSR. Botanichskiy. Institute, 51 ����� 54.
Kuzmenko L. V., Senitchkina L. G., Altukhov D. A., Kovaleva T. M. (2001) Quantitative development and distribution of phytoplankton in waters of the southeastern coast of Crimean. Karadag: History, biology, archaeology. Collection of papers dedicated to 85th anniversary of Karadag Scientific Station, Simferopol, sonat, 127 ����� 134.
Lopukhina O. A., Bryantseva Yu. V., Kemp P. B. (1999) Seasonal dynamics of phytoplankton of Sevastopol Bay in 1998. Water area and coasts of Sevastopol: ecosystem processes and service to society. ��Sevastopol: Akvavita, 131 ����� 141.
Mashtakova, G., (1968) Seasonal dynamics of phytoplankton in the Eastern part of Black Sea. Trudy AZNIRKh, 27, 52-59 (in Russian).
Mashtakova G. P., Roukhiyainen M. I. (1979) Seasonal dynamics in phytoplankton. Fundamentals of biological productivity of the Black Sea. - Kiev: Naukova. dumka, 85 ����� 88.
Mavrodieva R., S. Moncheva & G. Hiebaum, 2007. Abnormal outburst of the dinoflagellate Alexandrium ostenfeldii (Paulsen) Balech et Tangen along the Bulgarian Black sea coast (the bay of Sozopol) in winter ����� ecological surprise or ecological concern? Bdua Journal Of Biology, Vol. II, 2007, Plankton Symposium IV & Congresso Brasileiro De Pl��ncton, Abstracts, 84.
Mikaelyan, A. (2008) Long-term changes in taxonomic structure of phytoplankton communities in the Northern part of the Black Sea. In: 2nd Biannual and Black Sea Scene EC project joint conference on climate change in the Black Sea ����� hypothesis, observations, trends, scenarios and mitigation strategy for the ecosystem. 6-9 October 2008, Sofia, Bulgaria.
Minhea M. (1997) Major shifts in the phytoplankton community (1980-1994) in the Romanian Black Sea. Oceanologia Acta, 20 (1), 119-129.
Moncheva S. (2005). Phytoplankton Shifts in the Black Sea- Driving Forces and Possible Implication for Reference Conditions�� Joint Workshop on Streamlining the Process of Producing Regional Assessments on Eutrophication for Pan-European Purposes. EC JRC-BSCOM-HELCOM 26/10/05����� 28.10.05 Istanbul, Turkey (http://ps.blacksea-commission.org/bsc/onlinedocs)
Moncheva S. (2006) Phytoplankton- Technical Report-Control of eutrophication, hazardous substances and related measures for rehabilitating the Black Sea ecosystem: Phase 2: Leg I PIMS 30651, Istanbul, Turkey
Moncheva S., A. Krastev. 1997. Some aspect of phytoplankton long-term alterations off Bulgarian Black Sea shelf. In: E. Oszoy, A. Mikhaelian [ed.] Sensitivity to Change: Black Sea, Baltic Sea and North Sea. NATO ASI Series, 2.Environment - vol.27, Kluwer Academic Publ., 79 - 94
Moncheva S., Kamburska, L. (2002) Plankton stowaways in the Black Sea- impacts on biodiversity and ecosystem health. In: Alien marine organisms introduced by ships in the Mediterranean and Black Seas, CIESM Workshop Monographs, Monaco, 20, 47-53.
Moncheva, S., Slabakova, N. (2007) Selection of relevant metrics per biological quality element phytoplankton and chlorophyll a and identification of initial reference conditions. In: Evaluation of the impact of land-based activities on the marine and coastal environment, ecosystems and biodiversity in Bulgaria Final REPORT, Contract 03/07746/AL Ecolas N. V., Flemish Community.
Moncheva S., Petrova-Karadjova V., Palazov A. (1995) Harmful Algal Blooms along the Bulgarian Black Sea Coast and possible Paterns of Fish and Zoobenthic Mortalities. In:�� Lassus P., et al. (eds.), Harmful marine algal blooms, Lavoisier publ. inc., 193-298.
Moncheva S., Gotsis-Skretas, O. Pagou K.and Krastev A. (2001). Phytoplankton blooms in Black Sea and Mediterranean coastal ecosystems subjected to anthropogenic eutrophication: similarities and differences. Estuarine Coastal and Shelf Science , 53:281-295.
Moncheva S., Doncheva V., Shtereva G., Kamburska L., Malej A., Gorinstein S. (2002) Application of eutrophication indices for assessment of the Bulgarian Black Sea coastal ecosystem ecological quality. Water Sci. Technol., 46(8), 19-28.
Moncheva S., Doncheva, V., Alexandrova, V. (2006) Regime shifts in the North-Western Black Sea phytoplankton communities - implication for ecosystem ecological state assessment. 1st�� Biannual Scientific Conference ���œBlack Sea Ecosystem 2005 and Beyond����, 8-10.05.2006, Istanbul, Turkey.
Nesterova D. A. (1979) The development of the peridinea Exuviaella cordata and ���œthe red tide���� phenomenon in the northwestern Black Sea. Biologiya moray, 5,�� 24 ����� 29.
Nesterova D. A. (1987) Some features of succession of phytoplankton in the northwestern Black Sea. Hydrobiologycheskyi. Zhurnal, 23(1), 16 ����� 21.
Nesterova D. A. (1998) Spatral-temporal change in phytoplankton in Zhebriansky Bay. Ecosystem of the marine part of the Ukrainian Danube Delta.�� Odessa: Astroprint, 159 ����� 180.
Nesterova D. A. (2001) Water ���œblooming���� in the northwestern Black Sea (Overview). Algologiya. 11(4), 502 ����� 513.
Nesterova D. A. (2003) Results and prospects for studies phytoplankton in the northwestern Black Sea. Ecologiya morya, 63, 53 ����� 59.
Nesterova D. A. (2003a) The study of Black Sea phytoplankton (Overview). Hydrobiologycheskyi. Zhurnal, 39( 5), 17 ����� 34.
Nesterova D. A. (2005) The Danube ����� an indicator of the state of coastal phytoplankton. Naukovi zapysky. Seriya biologiya. Spetsialny vypusk: Gidroecologiya 4 (27), Ternopilsky peduniversytet, 160 ����� 162.
Nesterova D. A., Ivanov A. I. (2001) Phytoplankton. Kiliya part of the Danube Delta�� in spring 2000: The state of the ecosystem and consequences of technogenic catastrophes. Odessa, 44 ����� 51.
Nesterova D. A., Terenko L. M. (2000) Phytoplankton of the Odessa area in contemporary conditions. Ecological safety in coastal and shelf zones and integrated use of the shelf resources.�� Sevastopol, 383 ����� 390.
Nesterova D. A., Terenko L. M. (2007) Phytoplankton species diversity of in the zone of direct Danube river impact. Ecological safety in coastal and shelf zones and integrated use of the shelf resources. Sevastopol, 541 ����� 556.
Petrova-Karadjova, V. (1984) Changes in planktonic flora in Bulgarian Black Sea waters under the influence of eutrophication. Proc. Inst. Fish., 21, 105- 112.
Petrova-Karadjova V. (1990) Monitoring the blooms along the Bulgarian Black Sea coast.���� Rapports et Proc�¨s-Veraux des r��unions, Comission internationale pour l�����exploration scientifique de la mer M��diterran��e, 31 (1), 209.
Petrova D., Velikova V. (2003) A report of potentially toxic species Dinophysis in Bulgarian Black Sea waters. In: Proc. 4th IWA Special Conference for Assessment and Control of Hazardous substances in water, ECOHAZARD 2003, 93/1-93/4.
Pitsik G. K. (1950) On quantitative development and horizontal distribution of phytoplankton in the western part of the Black Sea. Tr. AzTCHerNIRO, 14, 215 ����� 245.
Polikarpov I.G., Saburova M.A., Manjos L.S., Pavlovskaya T.V., Gavrilova N.A. (2003) Microplankton diversity of coastal zone in the Sevastopol region, Black Sea (2001-2003). Phytoplankton. In: Modern state of Crimean coastal zone (Black Sea sector). Sevastopol, Institute of Biology of Southern Seas Publication, 18-37 (in Russian).
Pitsyk G.K. (1950) On the abundance, composition, and distribution of phytoplankton in Black Sea. Trudy VNIRO (Proc. All-Union Inst. Fisheries and Oceanogr. Moscow) 14, 215-245 (in Russian).
Şahin, F. (2005). The Composition and Seasonal Distribution of Phytoplankton in the Region of Sinop Cape of the Black Sea, Turkey. (Ms Thesis), OMU, Fen Bilimleri Enstit��s��, Samsun. 149 p. (In Turkish)
Senicheva M. I. (2000) Annual changes in phytoplankton communities near the Sevastopol Oceanarium. Ecologiya moray, 53, 15 ����� 19.
Senichkina L. G. (1973) Phytoplankton clean and polluted waste waters near Yalta. Biologiya moray, 28, 135 ����� 150.
Senichkina L. G. (1993) Changes in the structure of phytoplankton in local marine zones under the impact of anthropogenic factors. Black Sea plankton. ����� Kiev: Naukova. dumka, 32 ����� 55.
Senicheva M. I. (2002) New and rare Black Sea species of diatom and dinophyte algae. Ecologiya moray, 62, 25 ����� 29.
Senichkina L. G., Altukhov D. A., Kuzmenko L. V., Georgieva L. V., Kovaleva T. M., Senicheva M. I. (2001) Species diversity of Black Sea phytoplankton in the southeastern coast of Crimea. Karadag: History, biology, archaeology. Collection of papers dedicated to 85th anniversary of Karadag Scientific Station, Simferopol, sonat, 120 ����� 125.
Sorokin Yu.I. (2002) Black Sea Ecology and Oceanography. Amsterdam: Backhuys Publishers, 621 pp.
Sukhanova I.N., Mikaelyan A.S., Georgieva L.V. (1991) Spatial Distribution and Temporal Variations of the Black Sea Phytoplankton during the Period of the Spring Blooming. In: Phytoplankton Studies in the System of Monitoring of the Baltic Sea and Other Seas of Russia. Gidrometeoizdat, Moscow. 135-151 (In Russian).
Terenko G. V. (2004) Contemporary state of coastal phytoplankton in the northwestern Black Sea and the role of dinophyte algae. ����� Avtoreferat. dissertatzsii kandidata. biologicheskix. nauk. Sevastopol, 20 p.
Terenko L. M. (2005) Dinoflagellates of the northwestern Black Sea: species diversity and ecology. - Avtoreferat. dissertatzsii kandidata. biologicheskix. nauk.�� Sevastopol, 23 p.
Terenko L. M. (2005a) New species of Dinophyta for the Black Sea.�� Algologiya, 12, 236 ����� 244.
Terenko L. M, Terenko G. V. (2000) Species diversity of the plankton phytocenosis in the Odessa Bay of the Black Sea. Ecologiya moray, 52, 56 ����� 59.
Turkoglu M (1999). Some fluctuations in phytoplankton community structures of the Black Sea. EU Journal of Fisheries and Aquatic Science 16(1-2), 201-217.
Velikova V., Moncheva S., D. Petrova, (1999) Phytoplankton dynamics and red tides (1987-1997) in the Bulgarian Black Sea. Water Science and Technology, vol. 39, 8, 27-36.
Velikova V., D. Petrova, V. Mihneva, S. Dineva, S. Uzunova, (2001) Recent state of the Bulgarian Black Sea ����� signs of improvement of the ecosystem. Proc. Fifth International Conference on the�� Mediterranean Coastal Environment, MEDCOAST 01, E. Ozhan (Ed.), Hammamet, Tunisia, 893-901.
Velikova V., Cociasu, A., Popa, L., Boicenco, L., Petrova, D. (2005) Phytoplankton community and hydrochemical characteristics of the Western Black Sea. FP 5 EC Project DANUBES Final Report.
Vershinin, A.O. and Moruchkov A.A. (2003) Toxic Microalgae in the Black Sea Phytoplankton. Ekologiya Moria (Ecology of the Sea), 64, 45-50 (In Russian).
Vershinin A.O., Moruchkov A.A., Sukhanova I.N., Kamnev A.N., Morton S.L., Pankov S.L., Ramsdell J.S. (2004). Seasonal changes in coastal phytoplankton at Bolshoy Utrish (Northeast Black Sea) in 2001-2002. Okeanologia, 44, 419-425 (in Russian).
Vershinin A., Moruchkov A., Leighfield T., Sukhanova I., Morton S., Pankov S., Ramsdell J. (2005) Species composition and potentially toxic algae of northeast Black Sea coastal phytoplankton in 2000-2002. Oceanology, 45, 224-232.
Vershinin A., Moruchkov A., Morton S., Leighfield T., Quilliam M., Ramsdell J. (2006а). Phytoplankton of Kandalaksha Gulf of White Sea and DSP-causative algae. Harmful Algae, 5, 558-564.
Vershinin A.O. and Velikova. V.V. (2008) New Species to the Black Sea Phytoplankton List and Some Commonly Occurring Light Microscopy Misidentifications. Botanica Marina. In press.
Vershinin A.O. and Orlova T.Yu. (2008) Toxic and harmful algae in coastal waters of Russia. Oceanology. In press.
Zaitsev Yu. P., Garkavaya G. P., Nesterova D. A., Polischuk L. N. (1989) The Danube ����� main source of eutrophication of the Black Sea. Gidrobiologycheskyi. Zhurnal, 25(4), 21 ����� 24.
Zernov S.A. (1913) On the problem of studying life in Black Sea. Proc. Emp. Acad. Sci. St.Peterburg, Vol. XXXII (1), 310 pp (in Russian).
Zernova V.V. (1980) Annual changes in phytoplankton in 1979 in Northeastern part of Black Sea (Gelendjik coastal station). In: Ekosistemy pelagiali Chernogo morya (Pelagic Ecosystems of Black Sea). Moscow: Nauka, 96-105 (in Russian).
��
CHAPTER 6 THE STATE OF ZOOPLANKTON (T. Shiganova et al.)
T. Shiganova, E. Musaeva, E. Arashkevich
P.P.Shirshov Institute of oceanology Russian Academy of Sciences
L. Kamburska(1), K. Stefanova(1), V. Mihneva(2)
(1)Institute of Oceanology, Bulgarian Academy of Sciences, Varna, Bulgaria
(2)Institute of Fishing Resources, Varna, Bulgaria
Odessa Branch, Institute of Biology of the Southern Seas, NASU, Odessa, Ukraine
National Institute for Marine Research and Development ���œGrigore Antipa���� (NIMRD), Constanta, Romania
(1) Sinop University, Fisheries Faculty, Sinop, Turkey
(2) Middle East Technical University, Institute of Marine Sciences, Erdemli, Turkey
Georgian Marine Ecology and Fisheries Research Institute, Batumi, Georgia
Mugla University, Faculty of Fisheries Mugla, Turkey
6.1. Introduction
Zooplankton community structure serves as a critical trophic link between the autotrophic and higher trophic levels. On the one hand, zooplankton as consumer of phytoplankton and microzooplankton controls their abundance; on the other hand, it serves as food resource to small pelagic fishes and all pelagic fish larvae and thus controls fish stocks. The Black Sea zooplankton community structure is more productive but has lower species diversity as compared to the adjacent Mediterranean Sea. Many taxonomic groups that are wide-spread in the Mediterranean Sea are absent or rarely present in the Black Sea such as Doliolids, Salps, Pteropods, Siphonophors, and Euphausiids (Mordukhai-Boltovskoi, 1969). It consists of about 150 zooplankton species, of which 70 are mainly Ponto-Caspian brackish-water types and about 50 constitute meroplankton (Koval, 1984). They are euryhaline and thermophilic species of the Mediterranean origin as well as cold-water species of the North Atlantic boreal origin. The wide temperature range in the Black Sea (2-25oC) permits development of psychrophilic, eurythermic and thermophilic species. Therefore, their vertical distribution, seasonal and interannual dynamics are defined by their thermophilic properties.
Mass development of mixotrophic algae and changes in phytoplankton species composition provided a base for the development of zooplankters, both phytophagous and detritophagous (Zaitzev and Aleksandrov, 1997). The most important feature of zooplankton community after the 1970s was the change in species composition between various zooplankton groups. Some species almost disappeared, whereas some other species increased their abundance such as outbursts of gelatinous planktonic species Aurelia aurita and Noctiluca scintillans./ Opportunistic zooplankton species such as Acartia clausi greatly increased their abundance and share of trophic zooplankton. These events were most profound in the northwestern part of the sea, where the regional hydrochemical characteristics are primarily governed by the nutrient enrichment supplied from Danube, Dniester, and Dnieper runoffs.
The zooplankton community has been dramatically affected by the population outburst of alien ctenophore species Mnemiopsis leidyi after 1988 due to their intensive preying on edible zooplankton (Vinogradov et al., 1989; Shiganova, 1998). The ctenophore M.leidyi affected the physical properties by reducing the water transparency, and more significantly the biological properties by causing a cascade effect up on all trophic levels. Their strong grazing on zooplankton populations reduced food resources for planktivorous and predatory fishes, and favored phytoplankton growth. It also supported microplankton growth through mucous excretion, which then led to more abundant bacteria population and thus its predator ciliates and zooflagellates (Shiganova et al., 2004). The introduction of its predator Beroe ovata which came from either the Mediterranean Sea or eastern coast of North Atlantic through ballasts waters during 1997 helped later recovery of the ecosystem (Konsulov and Kamburska, 1998; Shiganova, 2000). B. ovata was first encountered in the western shelf (Konsulov and Kamburska, 1998 a) and the northeastern basin in the summer 1997 (Shiganova et al., 2004). In addition, the entire planktonic system has been affected by the severe climatic cooling regime in the 1980s followed by similarly strong warming regime of the 1990s and the early 2000s (Oguz et al., 2006). The present chapter provides a detailed account of these modifications of the zooplankton community structure in terms diversity, abundance and biomass in different regions of the Black Sea and outlines the present state (after 2000) with respect to the previous decades.
6.2. Ukrainian shelf area
Significant changes in total abundance, biomass, and community structure of zooplankton in the northwestern shelf are depicted in Table 6.1. Most noticeable change in the early phase of eutrophication was the increase of Noctiluca scintillans and medusa Aurelia aurita abundances, the main indicators of eutrophic waters. Aurelia biomass started increasing from negligibly low values (<50 g m-2) in the 1960s to around 500 g m-2 in the early-1980s (Fig. 6.1a). Similarly, Noctiluca share in the total zooplankton abundance changed from 35�����42% prior to the early- 1970s to more than 90% after the mid-1970s and in the 1980s (Fig. 6.1b). Therefore, eutrophication increased total non�����trophic zooplankton share in biomass and abundance, and reduced those of trophic zooplankton from 200-500 mg m-3 range and > 30000 ind.m-3 in the 1960s to < 100 mg m-3 and 10000 ind.m-3 within a decade (Fig. 6.1a, 6.1c). The declining biomass of Aurelia during the mid-1980s coincided with the period of more predominant control of Noctiluca on trophic zooplankton population due to its reproduction, growth, and food competition advantages with respect to Aurelia (Fig. 6.1d).
The edible zooplankton community structure also experienced a significant reduction in species diversity during the 1970s-1980s. Pontellidae, Paracartia latisetosa, Podon intermedius, Bryozoa larvae, Centropages ponticus, Penilia avirostris, Evadne spinifera, Pleopis tergestina, O. minuta, P. tergestina, E. spinifera disappeared due to high predation pressures and food competition by A. aurita and N. scintillans during the intense eutrophication (Table 6.1, Fig. 6.1b). A. clausi abundance was reduced; C. ponticus and Paracalanus parvus abundances were seriously endangered. Population explosion of the comb jelly M. leidyi aggravated the situation in the subsequent years.
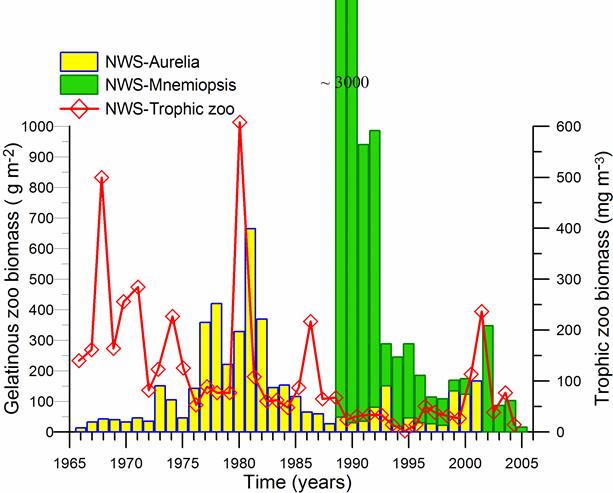
Fig. 6.1a. Long-term biomass changes of Aurelia, Mnemiopsis (left axis) and edible zooplankton (right axis) in the northwestern sector of Ukranian shelf waters. No Aurelia biomass data were reported after 2001. Data source: YugNIRO, Kerch, Ukraine, sorted out by Dr. A. Grishin, see�� Velikova V. and Chipev N. 2005.
Even though the changes in the average multi-year total zooplankton biomass in offshore areas along the southern cost of Crimea was not as high as in the northwestern part from the early 1960s to the mid-1990, edible zooplankton biomass also steadily decreased at the expense of higher share (>75%) of non-edible species Noctiluca scintillans and Pleurobrachia pileus (Table 6.2).
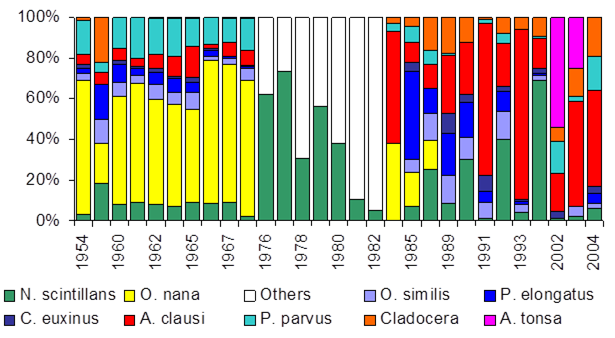
Fig. 6.1b. Long-term changes in abundance (%) of mesozooplankton species in the Northwest part of the Black Sea (after Temnykh et al. 2006).
����


Fig. 6.1c. Long-term changes of mesozooplankton abundance (ind. m-3) in the Northwest part of the Black Sea (after Temnykh et al. 2006).
Table 6.1. Long-term dynamics of biomass (mg∙m-3) of the main species of zooplankton of the northwestern Black Sea (provided by Polischuk and Nastenko (1998) and Polyshchuk (2005) up to 1999, modified by L. Polishchuk afterwards).
| Taxa | 1951-60 | 1959-74 | 1975-80 | 1981-85 | 1986-89 | 1990-95 | 1996-99 | 2000-05 | 2006-007 |
| N. scintillans | 163.00 | 133.20 | 3366.00 | 3331.00 | 5262.00 | 733.10 | 2100.3 | 393.6 | 1736.1 |
| A. clausi | 36.00 | 40.20 | 46.40 | 32.10 | 64.00 | 16.10 | 14.2 | 82.7** | 62.2** |
| P. parvus | 8.00 | 8.20 | 2.40 | 0.90 | 1.70 | 0.08 | 0 | 0.5 | 0.03 |
| P. elongatus | 24.00 | 21.10 | 2.10 | 3.40 | 17.30 | 8.50 | 5.4 | 11.7 | 2.8 |
| C. euxinus | 3.00 | 17.00 | 0.09 | 1.40 | 2.10 | 0.40 | 0.1 | 0 | 0.4 |
| C. ponticus | 5.00 | -- | 0.06 | 0.90 | 0.40 | 0.01 | 0 | 0.02 | 0.1 |
| O. minuta | 8.00 | 4.80 | 10.70 | 13.50 | 6.30 | 0.00 | 0 | 0 | 0 |
| O. similis | -- | 3.30 | 0.40 | 0.20 | 0.70 | 0.06 | 0.05 | 0.1 | 0.03 |
| P. avirostris | 26.00 | -- | 7.80 | 3.30 | 6.00 | 0.07 | 0.55 | 3.3 | 33.6 |
| P.polyphemoides | 6.00 | -- | 20.90 | 18.40 | 21.60 | 9.10 | 6.1 | 6.2 | 3.7 |
| P. tergestina | 4.00 | -- | 0.08 | 0.00 | 1.00 | 0.00 | 0 | 0 | 0.7 |
| E. spinifera | -- | 0.07 | 0.02 | 1.00 | 0.00 | 0.01 | 0.002 | 0 | |
| P. pileus | 49.00 | 87.60 | 43.30 | 30.50 | 25.20 | 36.50 | 0.6 | 140.1 | 84.0 |
| P. setosa | 24.00 | 7.30 | 6.80 | 5.50 | 3.30 | 0.40 | 0.5 | 11.8 | 6.2 |
| Meroplankton | 14.00 | -- | 29.20 | 33.50 | 6.70 | 20.20 | 72.1 | 31.9 | 23.0 |
| Varia | 14.00 | 54.00 | 59.90 | 36.20 | 45.60 | 68.90 | 39.7 | 113.7 | 12.4 |
| M. leidyi | -- | -- | -- | -- | |||||
| B. ovata | 58.7 | 295.8 | 77.8 | ||||||
| Total zooplankton | 384.00 | 376.70 | 3596.20 | 3510.80 | 5464.90 | 893.40 | 2298.3 | 1091.5 | 2043.1 |
| Trophic zooplankton | 148.00 | 148.60 | 180.10 | 143.80 | 174.40 | 123.40 | 138.2 | 250.2 | 138.4 |
| Non-trophic zooplankton | 236.00 | 228.10 | 3416.10 | 3367.00 | 5290.50 | 770.00 | 2160.1 | 841.3 | 1904.8 |
| % N. scintillans | 42.40 | 35.30 | 93.50 | 94.80 | 96.20 | 82.00 | 91.4 | 36.0 | 84.9 |
��-- lack of data;�� ** together with A.tonsa.
Table 6.2. Average multiyear biomass (mg∙m-3) of total zooplankton and its main components in the 0-100 m layer in offshore areas near the southern Crimean coast.
| Group of organisms | Years | ||||
| 1960-70 | 1971-80 | 1981-88 | 1989-94 | 1994-95 | |
| Total zooplankton | 346 | 328 | 287 | -- | 438 |
| Trophic zooplankton | 87 | 78 | 64 | 58 | 45 |
| Noctiluca scintillans | 199 | 150 | 141 | -- | 45 |
| Pleurobrachia pileus | 60 | 100 | 82 | -- | 348 |
| % N. scintillans+P. pileus | 75 | 76 | 78 | -- | 90 |
| Mnemiopsis leidyi | 12545 | 8383 | |||
| Aurelia aurita | 1795 | 2122 | |||
-- lack of data
Following the development of M. leidyi in the Black Sea up to 3000 g m-2 by 1989, N. scintillans and Aurelia biomass decreased abruptly and total abundance and biomass of trophic zooplankton continued to remain at low levels (Fig. 6.1a, 6.1c). This situation persisted until 1998, although Mnemiopsis biomass was reduced by half with respect to its early 1990s outburst period. Following the development of Beroe in 1998, the Mnemiopsis biomass reduced further at the expense of some recovery of Aurelia and Noctiluca. Trophic zooplankton biomass was affected positively by the Mnemiopsis decline. Its biomass increased 3-4 folds for two years (2000, 2001), but then dropped abruptly in 2002 and remained below 10% of total zooplankton biomass due to overwhelming domination of zooplankton community by N. scintillans (Table 6.1, Fig. 6.1a, 6.1d).��
Near the Zmeiny Island located in the Danube delta region and in Zhebriansky Bay (Fig. 6.2), observations in spring-summer 2005-2007 showed exceptionally high abundance of gelatinous zooplankton (comb jellies M. leidyi and B. ovata) contributing to 75% of the total zooplankton in August. In autumn, they were rarely encountered (M. leidyi ����� 11%, B. ovata ����� 8%) and the B. ovata population that was formed by small young specimens and larvae did not have a significant influence on the development of M. leidyi. The zooplankton biomass was lower in the Odessa region than near the Zmeiny Island (Fig. 6.3).
Table 6.3. Biomass (mg∙m -3) of main groups of dominating zooplankton species in the Danube estuary area in May and November 2004�����2005.
| 2004 | 2005 | |||
| May | November | May | November | |
| Protozoa | 29.979 | 10.523 | 359.798 | 1915.077 |
| Noctiluca scintillans | 29.877 | 10.523 | 359.555 | 1915.077 |
| Rotifera | 12.642 | 0.012 | 149.191 | 0.086 |
| Synchaeta | 5.653 | 0 | 128.174 | 0 |
| Cladocera | 4.690 | 0.080 | 30.544 | 76.908 |
| Pleopsis polyphemoides | 1.242 | 0.045 | 29.043 | 5.463 |
| Penilia avirostris | 0 | 0 | 0 | 67.515 |
| Podonevadne trigona | 0 | 0 | 0 | 3.700 |
| Copepoda | 21.502 | 118.658 | 61.575 | 644.237 |
| Acartia clausi+ tonsa* | 9.184 | 105.260* | 41.997* | 641.509* |
| Paracalanus parvus | 0.039 | 2.608 | 0 | 0 |
| Pseudocalanus elongates | 4.740 | 3.459 | 1.887 | 0 |
| Ctenophora | ||||
| Beroe ovata | 0 | 753.279 | 0 | 3316.438 |
| Mnemiopsis leidyi | 0 | + | 0 | 0 |
| Pleurobrachia pileus | 0 | 0 | 214.610 | 0 |
| Chaetognatha | 0 | 3.933 | 0 | 82.863 |
| Appendicularia | 1.872 | 0.258 | 0.024 | 0.018 |
| Meroplankton | 22.317 | 18.780 | 99.810 | 38.128 |
| Total zooplankton | 93.002 | 905.523 | 927.465 | 6074.452 |
| ����� without�� B.ovata | 152.244 | 2758.014 | ||
| Non-trophic zooplankton (%) | 32.100 | 84.800 | 61.900 | 87.500 |
| ����� without�� B.ovata | 9.500 | 72.400 | ||
������
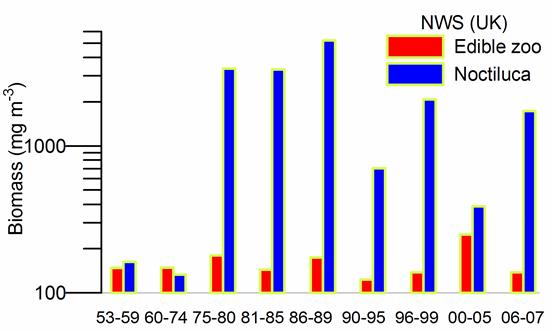
Fig. 6.1d. Biomass (mg�·m-3) of edible zooplankton and Noctiluca scintillans in the Ukrainian (UK) coastal waters of the northwestern Black Sea (NWS) during 1953-2007.��
In the absence of M. leidyi after the B. ovata settlement into the Black Sea, the role of Cladocera and Copepoda in the zooplankton community structure increased (Fig. 6.1b). The Cladocera species P. avirostris and the endemic Ponto-Aral Podonevadne trigona, earlier quoted as rare species, became widespread in recent years whereas the density of Cladocera Pleopsis polyphemoides decreased. Among Copepoda, Acartia clausi and A. tonsa were observed at higher abundances for the first time since their disappearance. Pleurobrachia and Sagitta were also observed abundantly in some years. In the summer 2005, A. tonsa almost replaced A. clausi in terms of abundance and biomass in the Dnieper-Bug area (8456 ind�·m-3 and 85.7 mg�·m-3), the Tendrovsky Bay (10242 ind�·m-3 and 117.5 mg�·m-3) and the Egorlitsky Bay (29075 ind�·m-3 and 488.8 mg�·m-3). N. scintillans still dominated the total zooplankton biomass albeit the declining tendency by 56% in the Dnieper-Bug area, 43% in the Tendrovsky Bay and 15.6% in the Egorlitsky Bay. The frequency and abundance of Bryozoa larvae was also found in large quantities during the summer 2005 with respect to 1980s-1990s in these regions.��


Fig. 6.2. The regions studied most extensively in the NWS coastal waters during 2000-2007: 1 ����� Danube river mouth (Ukrainian part of the Danube Delta), 2 ����� Odessa Bay area, 3 ����� Grygorivsky Liman, 4 ����� Yagorlytska Bay, 5 ����� Tendrivska Bay.
 ������
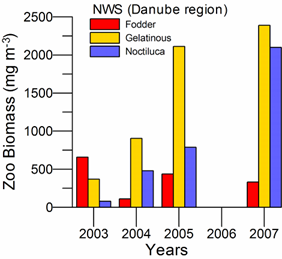 ������
Fig. 6.3. Edible, gelatinous, and Noctiluca biomass changes during 2003-2007 in the Danube discharge and Odessa regions.
Similar changes were also monitored in the qualitative and quantitative characteristics of zooplankton along the Crimean coast as they can be noted by the data collected in the Sevastopol Bay during 1976-2002 (Table 6.4). Abundance of M. leidyi and B. ovata in the Sevastopol Bay during 1999-2005 varied between 500-1000 ind.m-3 and 50-100 ind.m-3, respectively, whereas the corresponding abundances within the adjacent shelf were twice lower (Finenko et al., 2007). The timing of M. leidyi mass appearance changed �� 1 month around August depending on the mixed layer temperature. This period coincided with the initiation of B. ovata bloom that typically lasted for 3 months (September �����November).
Table 6.4. Long-term changes in annual and/or multi-annual average abundance (ind∙m-3) of main zooplankton species in the Sevastopol Bay.
| 1976 | 1976�����80 | 1989�����90 | 2002 | |
| Cladocera | ||||
| Evadne spinifera | <1 | 0 | 0 | <1 |
| Penilia avirostris | 8 | 128 | <1 | 219 |
| Pleopis polyphemoides | 445 | 1206 | 370 | 141 |
| Pseudoevadne tergestina | 0 | 0 | 0 | 4 |
| Copepoda | ||||
| Acartia clausi+ tonsa | 540 | 1121 | 443 | 857 |
| A. margallifi (Acartia clause, small form) | 1225 | 3923 | 0 | 0 |
| A.latisetosa | 2 | 19 | 0 | 0 |
| Anomaloara patersoni | <1 | 0 | 0 | 0 |
| Calanipeda aquae-dulcis | <1 | 0 | 0 | 0 |
| Calanus euxinus | 1 | 2 | 4 | 2 |
| Centropages ponticus | 16 | 315 | 1 | 52 |
| Labidocera brunescens | 0 | <1 | 0 | 0 |
| Oitona minuta (O.nana) | 3464 | 2942 | 0 | <1 |
| O.similis | 197 | 74 | 29 | 15 |
| Paracalanus parvus | 513 | 472 | 4 | 173 |
| Pontella mediterranea | 0 | 0 | 0 | <1 |
| Pseudocalanus elongates | 273 | 63 | 58 | 30 |
| Harpacticoida | 43 | 55 | 19 | 7 |
| Meroplankton | 1759 | 3287 | 828 | 2280 |
| Varia | ||||
| Hydromedusae | <1 | <1 | <1 | 19 |
| Oikopleura dioica | 59 | 124 | 3 | 11 |
| Parasagitta setosa | 12 | 14 | <1 | 34 |
| Noctiluca scintillans | 1065 | 5067 | 1703 | 115 |
| Total zooplankton | 10116 | 19454 | 3545 | 4113 |
From July to September, during the peak Mnemiopsis development, their daily mesoplankton biomass consumption decreased from 30-40% of the mesozooplankton biomass in 1995 (prior to the Beroe settlement) to 2-13% during 2000-2005. The daily ration of of Mnemiopsis larvae on microzooplankton was close or even higher than those on mesoplankton, and found around 23�����25% of microzooplankton biomass in August 2003.
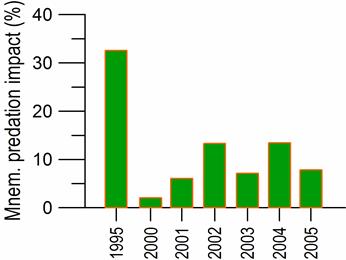
Fig. 6.4a. Mnemiopsis predation impact on mesozooplankton during July in Sevastopol Bay. Data source: Finenko et al. (2007).

Fig. 6.4b. Meroplankton and Crustacean abundances during spring-autumn 1999-2002 in the Sevastopol Bay. Data source: Finenko et al. (2007).
Weaker and shorter predation pressure of M. leidyi on mesozooplankton after the arrival and establishment of Beroe, as shown in Fig. 6.4a by the reduction of its daily predation impact, resulted in higher mesozooplankton biodiversity and abundance. In spring-autumn 2000-2005, species composition in the Sevastopol Bay resembled that of 1990-1996. Evadne spinifera, Pseudoevadne tergestina, Pontella mediterranea and Oithona nana were found for the first time. The trophic zooplankton biomass increased two-folds and the abundance and biomass of N. scintillians significantly reduced, while those of meroplankton (Hydromedusae and Parasagitta setosa) increased from 310 ind.m-3 in 1998 to 2650 ind.m-3 in 2000-2002 (Fig. 6.4b) and decreased in the subsequent three years (Finenko et al. 2007). The mean abundance of Crustaceans increased 8 times during the same period (Fig. 6.4b). In the Cladocera group, as in the NWS, P. avirostris prevailed over the former dominant species Pleopis polyphemoides. These changes were evidently linked to the decrease in M. leidyi abundance due to the B. ovata predation.��
6.3. Romanian shelf area
Long term changes of zooplankton community structure in the Romanian coastal waters possessed large fluctuations not only in terms of biomass and density but also in species diversity. The research conducted at 5-30 nautical miles coastal zone (20-50 m) between 1960 and 1966 showed a well-defined seasonal community structure. Copepods Pseudocalanus elongatus and Calanus euxinus and, in some years, Oithona nana and O. similis were the predominant members of winter zooplankton community representing 98% of the total biomass every year. The summer zooplankton population was dominated by the Cladoceran Penilia avirostris and the Copepod Centropages ponticus. In some years, the non-trophic organism Noctiluca scintillans has been recorded as a part of the community structure although its population density was limited to several thousands species per cubic meter. Very high abundance of minute copepods Paracalanus parvus and Oithona nana dominated the autumnal zooplankton population with the total biomass comparable to the spring (Porumb, 1972). This structure has prevailed until 1975. Meroplankters were a predominant group of the zooplankton community in shallow waters above the sandy, rocky seabed.
After 1977, the total zooplankton abundance decreased and zooplankton population was mainly represented by the pollution-resistant Copepod species Acartia clausi and Oithona similis. The increase in total biomass of the zooplankton was mostly for the case of the biotope inhabited in the surface layer that was most exposed to pollution. The Cladoceran Penilia avirostris was also present in small numbers as compared to 1975 (Porumb, 1980). Species from the family Pontellidae (Anomalocera patersoni, Pontella mediterranea and Labidocera brunescens) diminished their populations. Some species were totally disappeared as in the case of the family Monstrillidae (Monstrilla grandis, M. helgolandica and M. longiremis).
Another eutrophication-induced structural modification in the zooplanktonic biocoenose was the reduction in abundance of some sensitive holoplanktonic species, such as the copepod Centropages ponticus and the cladoceran Penilia avirostris. In summers between 1960 and 1967, these two species attained their highest densities and biomasses and, together with copepod Anomalocera pattersoni, had produced the richest biomass (225.28 mg∙m-3) in 1967. They achieved last high biomass development in summer 1975 and then gradually reduced towards extinction and were substituted by other opportunistic zooplankton species. After 1994, the populations of these two species became more abundant again although they were sporadically appeared.
The copepod species belonging to the family Pontellidae (Anomalocera patersoni, Pontella mediterranea and Labidocera brunescens), which had once formed large concentrations particularly in the contact zone between the marine and fresh waters, suffered a considerable decline. Other zooplanktonic organisms which have been present in large numbers in the plankton of the Romanian littoral in 1960s (Monstrilla grandis, M. helgolandica and M. longiremis) have not been observed any more after the 1980s.
Table 6.5. Mean density (ind∙m-3) and biomass (mg∙m-3) of Noctiluca scintillans along the Romanian continental shelf during the 1970s and 1980s.
| Year | Density | Biomass | Year | Density | Biomass |
| 1970/1971 | 4787 | 381.61 | 1978/1979 | 5937 | 474.94 |
| 1971/1972 | 14694 | 1119.03 | 1979/1980 | 15995 | 1276.38 |
| 1972/1973 | 1084 | 86.78 | 1980/1981 | 62676 | 5045.80 |
| 1973/1974 | 275 | 21.98 | 1982/1983 | 47241 | 3833.07 |
| 1974/1975 | 8097 | 639.89 | 1984/1985 | 17074 | 1365.89 |
| 1975/1976 | 1534 | 122.75 | 1985/1986 | 47999 | 3838.01 |
| 1977/1978 | 3945 | 312.35 | |||
During 1980-1986, Copepods dominated zooplankton population with their annual-mean density exceeding 7100 ind∙m-3. The mean annual zooplankton biomass continuously increased due mainly to high summer abundance of the Copepod Acartia clausi and the Cladoceran Pleopis polyphemoides in response to the increase in primary production and the organic matter content. Copepods formed a peak in warm seasons (spring, summer and early-autumn) and provided a valuable food resource for planktivorous fish such as sprat Sprattus sprattus phalericus and anchovy Engraulis encrasicolus ponticus whose production also increased during this period.
One of the most important ecological modifications produced by the eutrophication in the pelagic ecosystem was the explosive development of the Cystoflagellate Noctiluca scintillans in the 1970s and 1980s, which has a negligible trophic value in the pelagic ecosystem. The biomass share of Noctiluca in the overall biomass of zooplankton increased eight-folds in 1980-1986 as compared to the 1970s with the mean annual density higher than 15900 ind∙m-3 and occasionally reaching up to 62600 ind∙m-3 (Table 6.5). This period was also characterized by population explosion of the scyphozoan jellyfish Aurelia aurita.
After 1988, there has been a significant decline in the quantity of major zooplankters which had a high trophic value for planktivorous fish both in shallow and offshore waters. These changes could be attributed to the pressure exerted by the zooplanktivorous comb jelly M. leidyi which was the most important exotic species introduced into the Black Sea in terms of its impact on the local fauna. The Mnemiopsis invasion had a significant impact upon the Romanian small pelagic fishery, whose stocks have declined dramatically since 1988. M. leidyi typically reached at its maximum abundance and biomass during summer and modified seasonal zooplankton dynamics. Instead of two zooplankton biomass and/or abundance peaks in spring (the lower one) and summer (the higher one), only the spring peak remained to exist (Petran and Moldoveanu, 1994; Petran et al., 1999).
Surveys conducted after 1993 revealed that Mnemiopsis leidyi, together with Aurelia aurita, accounted for 90% of the total zooplankton biomass until the settlement of the ctenophore Beroe ovata. Nevertheless, the first signs of ecosystem rehabilitation appeared at edible zooplankton community after 1994 due to the reduction of pollution and eutrophication as well as the shift of the Black sea hydro-climatic regime into the warm climatic cycle. Centropages ponticus and Penilia avirostris became more abundant after 1994 (Fig. 6.5).
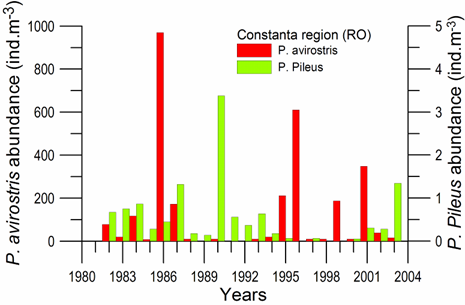
Fig. 6.5. Changes in Penilia avirostris and Pleurobrachia pileus abundances in Constantza region during 1982-2003.
After the invasion of ctenophore Beroe ovata and its active consumption of Mnemiopsis, the mean Mnemiopsis density 123 ind∙m-3 in the summer 1999 reduced to very low values after 2002. In the present decade, as the pollution and eutrophication continued to reduce and Mnemiopsis population was controlled by Beroe, the zooplankton biodiversity started to flourish as evident by growing populations of Anomalocera patersoni, Pontella mediterranea and Labidocera brunescens. The ctenophore Pleurobrachia pileus individuals, that were present in significant densities between 1982 and 1995, but they became almost extinct in the period of Mnemiopsis dominance, started regaining their ecological niche after 2001 once occupied by Mnemiopsis leidyi (Fig. 6.5).
The long-term edible zooplankton biomass changes within the upper 10 m of Romanian coastal and shelf waters during 1994-2007 has a declining trend from 350 mg m-3 to 50 mg m-3 in 1999-2007 irrespective of large interannual variations (Fig. 6.6). The edible zooplankton biomass possessed four distinct peaks at 1995, 1999, 2001 and 2003, of which the first two arise due to high summer abundance and the latter two due to high autumn abundance. The relatively high biomass measured within the uppermost 10 m layer of the water column in 1995 was initiated in February (10.5 mg∙m-3 in Mangalia station), increased gradually in spring and summer and reached its maximum value of 598.1 mg∙m-3 (in Mila station) in July. The spring and summer mean values of the edible zooplankton biomass attained about 120 mg m-3 and 210 mg m-3, respectively. Likewise, the biomass in summer 1999 varied between 23.769 mg∙m-3 at Sf. Gheorghe and 364.776 mg∙m-3 at Portitza.
 ������
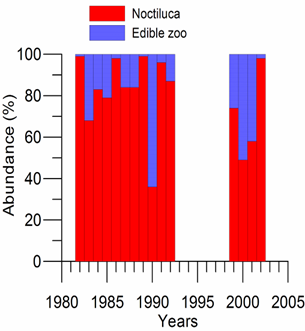
Fig. 6.6. Annual variations of edible zooplankton biomass (left) and relative abundances of edible zooplankton and Noctiluca (right) in the Romanian littoral zone 0-10 m layer.
The maximum edible zooplankton biomass in 2001 and 2003 was 1.2 and 1.3 times higher than in 1995, respectively. They were realized in autumn following very low summer values (Fig. 6.7).�� Although low trophic zooplankton biomass in summer 2001 was comparable to the 1970s and 1980s, it consisted of a more diverse structure comprising 13 and 17 species in near-shore waters of Mangalia and Portitza, respectively, that corresponded to the highest diversity index (3.70) for the summer season. Compared with the earlier years of mono-specific zooplankton populations that were mostly dominated by the opportunist copepod Acartia, the observed situation in the summer 2001 suggested a tendency toward normalization in the fodder zooplankton community structure. Following the unstable status of zooplankton structure during the eutrophication period and outburst of Mnemiopsis population, the cladoceran Penilia avirostris became more abundant in the recent decade and was measured up to a maximum value of 340 ind∙m-3 in 2001 (Fig. 6.5).
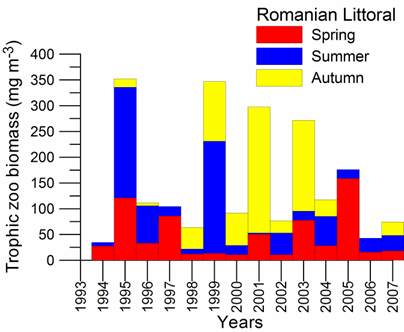
Fig. 6.7. Seasonal changes of trophic zooplankton along the Romanian littoral zone in the upper 10 m layer during 1994-2007.
Low edible zooplankton biomass in 2002 was due to dramatic population outburst of non-trophic species Noctiluca scintillans that constituted 98% of the total zooplankton biomass (Fig. 6.6, right). Its population outburst resembled the 1970s when the eutrophication syndrome first started due to proliferation of planktonic algae. The highest edible zooplankton biomass was only 11.18 mg∙m-3 in Portitza and remained below 1 mg∙m-3 within the rest of the region studied.
In 2003, the highest biomasses of edible zooplankton were registered in autumn (139.9 mg.m-3), that was 12.8 times higher than in the summer and 1.8 than in the spring. As for the spatial distribution, the richest quantities were found off the northern littoral (Sulina - 277.63 mg.m-3, Portita - 185.536 mg.m-3). On the other hand, the mean trophic biomass was very low (16.7 mg∙m-3) due to high Mnemiopsis predation impact but zooplankton community was richer in diversity in the summer 2003. The gelatinous and non-trophic species Noctiluca scintillans (449.29 mg.m-3) and Mnemiopsis leidyi 1939.549 mg.m-3) abundantly developed and suppressed the development of fodder species.
2004 and 2007 were also unproductive years in terms of edible zooplankton. 2005 and 2006 did not include autumn surveys and therefore it is unclear whether the edible zooplankton community experienced high production. But the summer biomass was again low due to dominance of the gelatinous and non-trophic species. In 2007, trophic zooplanktonic biocoenosis was represented by 26 taxa pertaining to 16 taxonomical groups in spring, summer and autumn. Maximum values of total trophic zooplankton density (12211 ind. m-3) and biomass (993.6 mg m-3) were registered along southern littoral off Costinesti in summer. But, on the average, the trophic zooplankton biomass was one of the lowest (50 mg m-3) since the beginning of 1990s. Among the exotic species, dominant forms were the ctenophores Mnemiopsis leidyi and Beroe ovata.
Thus, during 2000-2007, the non-trophic species Noctiluca scintillans and Mnemiopsis leidyi abundantly developed during the summers, even though they were lower than in the eutrophication period. They exerted great deal of interannual variability in the development of fodder species over a marked declining trend.
6.4. Bulgarian shelf area
Investigations on zooplankton community along the Bulgarian Black Sea coast started at the beginning of the 20th century (Chichkoff, 1912, Valkanov, 1935, 1936). The taxonomic structure, diversity, distribution and ecology were the main target of scientific interests, especially after the 1960s. More recent investigations after the intense eutrophication in the 1970s-1980s were focused on trends in the zooplankton fauna. Below, the changes in zooplankton assemblages in the Bulgarian coastal waters is presented using data derived from samples collected in various cruises in the shelf (< 200m depth; 30 sampling stations) and offshore (> 200 m depth; 10 sampling stations) as well as the time-series station located at 3 miles offshore of the Cape Galata (43��10' N , 28��10' E ) and the monitoring network in Varna Bay-Varna-Beloslav Lakes during 1990-2005.
In the pre-eutrophication period, the zooplankton community structure along the Bulgarian coast included phylum Protozoa, Cnidaria, Nemathelminthes, Annelida, Mollusca, Arthropoda, Chaetognatha, Chordata and Ctenophora. Copepods of genus Acartia, Paracalanus, Oithona mostly occurred inshore, while Pseudocalanus and Calanus were regularly observed in offshore waters. Cladocerans, such as Evadne spinifera, E. tergestina, Penilia avirostris, Pleopis polyphemoides, co-dominated the summer and fall community structure. Parasagitta setosa (Chaetognatha) and Oikopleura dioica (Appendicularia) were also co-dominant species. Benthic larvae (mainly Cirripedia, Polychaeta, Decapoda, Mollusca) contributed substantially to the inshore abundance structure. Usually, the estuaries and lagoons were enriched by brackish and fresh water species. Coastal areas (Varna and Beloslav lakes) were regularly abundant in rotifers (Kamburska, Stefanova, 2002).
This taxonomic composition, however, significantly changed during the intense eutrophication period (i.e. the 1990s) and afterwards (Table 6.6). While A. clausi, P. parvus, O. similis became a permanent component of the plankton fauna, other copepods such as Pontella mediterranea and Anomalocera patersoni were almost lost. The former species groups were occasionally recorded during the 2000s (Table 6.6). Similar trend was evident for warm-water copepods O. nana and C. ponticus (=C. kr��yeri pontica). The non-indigenous A. tonsa that was first recorded in the Black Sea during the 1970s (Gubanova et al., 2001) has been reported again in the Bulgarian coastal waters after 2000 (Kamburska, 2004). Regarding cladocerans, small-sized Pl. polyphemoides occurred frequently whereas E. spinifera, E. tergestina, E. nordmani, P. avirostris, Podon leuckarti were scarcely distributed (Table 6.6).
From biodiversity perspective, the indices of species richness and evenness of zooplankton assemblages fluctuated considerably during the last ten years between 17 and 25. The evenness index of summer-autumn community became temporarily as high as 0.78 for a year and then became comparable to the early 1990s in the subsequent years. The Shannon diversity index similarly exhibited large fluctuations (Table 6.7). They all indicated species disproportion in the abundance structure and can be considered as a symptom of community instability, not ignoring also the natural (seasonal, annual) variability of the zooplankton associations.
Table 6.6. Taxonomic composition of dominant groups in spring-summer at 3 miles station at Cape Galata (st. 301) including Varna Bay
��(������ �� recorded; ���������� ����not recorded).
| Species | Years | ||||||||||||||
| 1954-1967 | 1984-1987 | 1991-1995 | 1996-1997 | 1998 | 1999 | 2000 | 2001 | 2002 | 2004 | 2005 | |||||
| Copepoda | |||||||||||||||
| Acartia clausi | |||||||||||||||
| Acartia tonsa | |||||||||||||||
| Paracalanus parvus | |||||||||||||||
| Oithona similis | |||||||||||||||
| Pseudocalanus elongatus | |||||||||||||||
| Calanus euxinus | |||||||||||||||
| Anomalocera patersoni | |||||||||||||||
| Pontella mediterranea | |||||||||||||||
| Oithona nana | |||||||||||||||
| Centropages ponticus | |||||||||||||||
| Calanipeda aquae dulcis | |||||||||||||||
| Cladocera | |||||||||||||||
| Pleopis polyphemoides | |||||||||||||||
| Podon leuckarti | |||||||||||||||
| Penilia avirostris | |||||||||||||||
| Evadne nordmani | |||||||||||||||
| Evadne tergestina | |||||||||||||||
| Evadne spinifera | |||||||||||||||
Table 6.7. Number of zooplankton species (S), the Shannon-Wiener index (H) and the Pielou�����s evenness index (J) by years in summer-autumn in the Varna Bay.
| Sampling area | Years | ||||||
| Varna Bay | 1990-91 | 1996 | 1997 | 1998 | 1999 | 2001-02 | 2004-05 |
| S | 17 | 21 | 23 | 24 | 21 | 25 | 22 |
| J | 0.60 | 0.69 | 0.80 | 0.78 | 0.57 | 0.64 | 0.66 |
| H | 2.44 | 3.02 | 3.30 | 3.01 | 2.50 | 3.14 | 2.93 |
Long-term changes: Varna Bay is one of the hot spots due to its highly disturbed ecosystem from direct and indirect human impacts. High nutrient and particulate and suspended organic matter, pesticides and other pollutant loads together with limited vertical water exchange give rise to frequent oxygen deficiency near the bottom (Stefanova et al., 2006a; 2007). Its total zooplankton abundance increased from 3660 ind. m-3 in 1996 to 38756 ind.m-3 in 2001-2002 followed by a reduction to ~11876 ind.m-3 in 2004-2005 (Fig. 6.8a). Both the percentage share and abundance of N. scintillans decreased continuously after 1990 contrary to increasing role of first Meroplankton and then Copepoda up to 2000-2001 (Fig. 6.8a, 6.8b). This trend however changed during 2004-2005 due to reduction in Meroplankton abundance and increase in Copepoda abundance, although meroplankton still constitutes the highest biomass share in total zooplankton biomass.
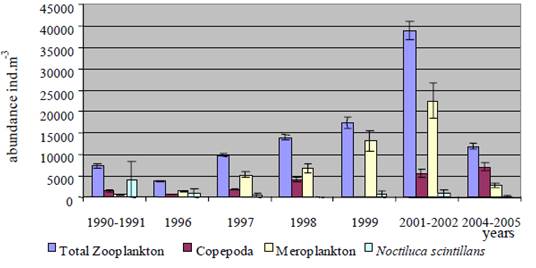
��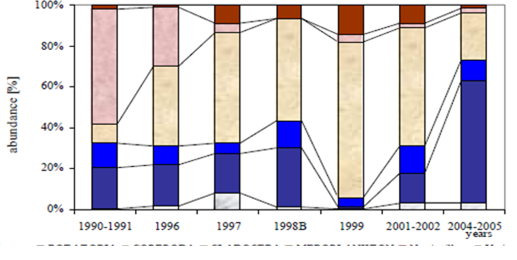
Fig. 6.8. Interannual variations of total zooplankton abundance (ind. m-3) and percent share of key taxonomic groups in Varna Bay.
The community structure shifted over the decades also in front of the Cape Galata especially in summer. Cladocera and Copepod populations which were abundant in the late 1960s-early 1970s decreased during the 1990s and the early 2000s with the exception of summer 2005 (Table 6.9). Four sampling campaigns performed during summer periods in 1998-2001 disclosed that Copepods, Cladocerans and benthic larvae dominated the abundance structure in the surface homogeneous layer (SHL) (Fig. 6.9). Copepods and Cladocerans constituted 80 % of the total biomass in the layer above the thermocline. Besides, the amount of Oicopleura dioica was also high together with benthic larvae which varied from 28 % to 51 % of the total abundance. The contribution of Cladoceran biomass was much higher in 2000-2001 varying in the range of 40 % to 56 %.
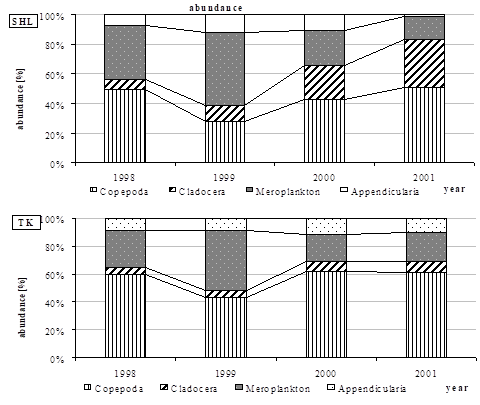
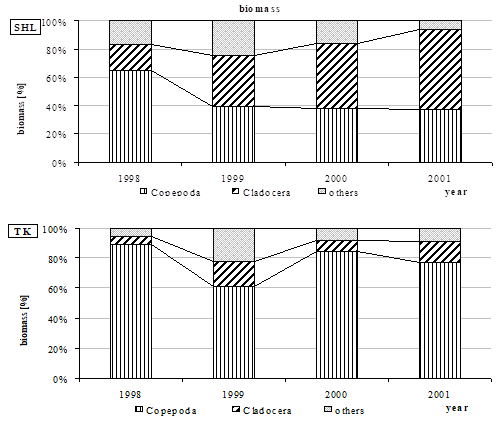
Fig. 6.9. Vertical distribution of total edible zooplankton abundance and biomass by taxonomic groups [in %] in surface homogeneous layer (SHL) and the sub-thermocline layer (TK) off the Bulgarian Black Sea coast during summer period 1998-2001.
In regards to the sub-thermocline layer (TK), the Copepoda group dominated the abundance and biomass structure (Fig. 6.9). The zooplankton biomass was higher at shelf stations along with steady decrease from north to the south and towards the open sea with some exceptions (Table 6.9). For instance, the lowest biomass (5 mg m-3) was recorded in the shelf during summer 1998. The increase afterwards was due to enhanced amount of Cladocerans biomass. In addition, large aggregates of C. euxinus were noted along the coast of Cape Kaliakra and at an offshore station during summer 2000.
Table 6.8. Summer mean abundance of dominant taxonomic groups [ind.m-3] at 3 miles offshore of the Cape Galata.
| Periods/Groups | 1967-69 | 1970-79 | 1980-89 | 1990-99 | 2000-04 | 2005 |
| Copepoda | 9986 | 10368 | 8805 | 3388 | 1319 | 3612 |
| Cladocera | 12865 | 4816 | 2946 | 1222 | 471 | 7673 |
The period 1990-2005 involved significant inter-annual variations such as the decline of M. leidyi in 1991‑1993, the introduction of B. ovata in 1997, and climatic changes. The period 1990-1997 was characterized by large amount of M. leidyi and subsequent strong decrease in mesozooplankton abundance (Fig. 6.10) and biomass (Fig. 6.11). Later, once Mnemiopsis was controlled by its predator Beroe and reduced to moderate concentrations depending on environmental conditions (Kamburska, Stefanova, 2005).
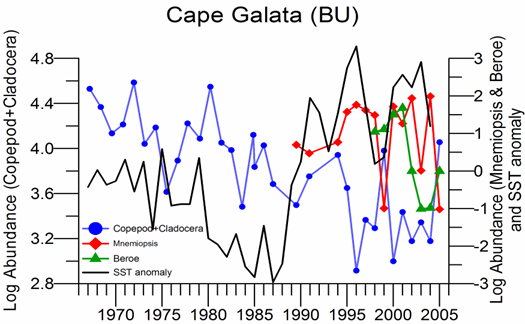
Fig. 6.10. Long-term changes of Copepoda+Cladocera, M. leidyi and B. ovata abundances (log transformed) and SST anomaly at 3 miles off the Cape Galata during summer 1967-2005 ( from Kamburska et al., 2006b).
The distribution of M. leidyi manifested considerable time-space variability after 1997; its abundance was confined into the warm surface mixed layer above the thermocline and much higher in the shelf compared to offshore area (Fig. 6.12). M. leidyi was more abundant in summer 2000-2002 and 2004, but it was rare in 1999, 2003 and 2005. Due to such strong year-to-year fluctuations, individual years may be identified as ���œpoor����, ���œnormal���� or ���œrich���� if 40 ind.m‑3 gelatinous plankton is accepted as the threshold bloom concentration. Accordingly, 1999, 2001, 2003 and 2005 are classified as ���œpoor���� years with rare and/or almost absent populations of trophic zooplankton. The changes in mesozooplankton structure therefore can not be attributed alone to the impact of B. ovata and should likely be affected by anthropogenic and climatic factors (Oguz, 2005). The Black Sea maintained warm SSTs after the mid-1990s similar to those observed prior to 1980 (Oguz, 2005, Oguz and Gilbert, 2007). Winters became gradually warmer, springs colder, and the summers were short and hot during 1995-2000. On the other hand, anthropogenic nutrient and pollutant loads diminished due to the limited use of fertilizers in agriculture after the beginning of 1990s (Moncheva et al., 2002). Furthermore, long-term data revealed a decreasing trend of salinity in front of the Cape Galata to 10 miles offshore (Dineva, 2005). Both the augmented temperature and decreased salinity of surface waters contributed to enrichment of Cladocerans (Kamburska et al., 2006a).
Table 6.9. Mesozooplankton biomass statistics by areas (shelf, open sea) during summer period 1998-2001 (number of observations, n=250).
|
Year, Region |
1998 | 1999 | 2000 | 2001 |
| Mg.m‑3 | mg.m‑3 | mg.m‑3 | mg.m‑3 | |
| Shelf | ||||
| Total | 577.31 | 2503.76 | 1394.8 | 620.9 |
| Mean �� stdev | 30.4 �� 18.4 | 119.2 �� 153.9 | 51.7 �� 28.9 | 62.1 �� 42.2 |
| Minimum | 5.2 | 7.64 | 14.5 | 12.3 |
| Maximum | 71.7 | 636.72 | 121.8 | 168.1 |
| Open sea | ||||
| Total | 479.2 | 106.9 | 408.7 | - |
| Mean �� stdev | 95.9 �� 34.5 | 26.8 �� 11.0 | 58.4 �� 45.9 | - |
| Minimum | 49.8 | 12.4 | 14.9 | - |
| Maximum | 131.3 | 38.4 | 147.8 | - |
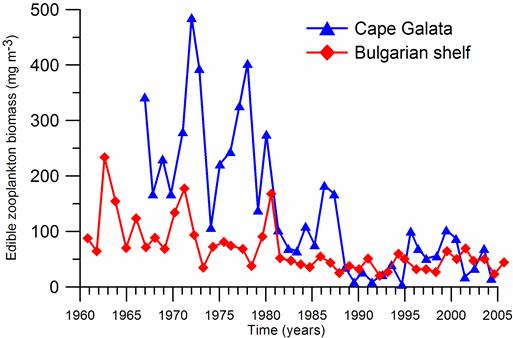
Fig. 6.11. Long-term changes of annual-mean edible zooplankton biomass at 3 miles off the Cape Galata and its average over the Bulgarian coastal waters.
��
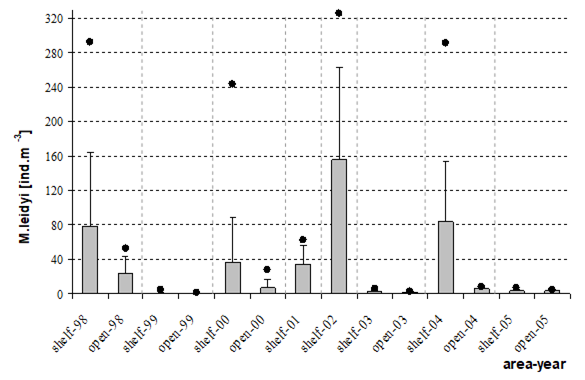
Fig. 6.12. Mean and maximum abundances of Mnemiopsis leidyi [ind.m‑3] in the Bulgarian shelf and open sea areas during summer 1998-2005 (number of observations n=172).
The heterotrophic dinoflagellate N. scintillans was a dominant component of the zooplankton community structure with frequent and massive blooms during the early and intensive eutrophication phases (Fig. 6.13). It was regularly found at inshore waters, but large aggregates also occurred in offshore waters (Konsulov, Kamburska, 1998b). The decreasing trend of its abundance in the post eutrophication phase (Fig. 6.13) was partly due to a reduction in eutrophication as well as its competitive disadvantage of food consumption against Mnemiopsis. Mucus excretions by Mnemiopsis may also likely limit its growth and distribution. The summer-autumn mean Noctiluca abundance displayed some increase during 2003-2005 even though it was lower than the eutrophication period. Their large blooms were still frequent in the early summer and/or autumn seasons, but their duration was relatively short with respect to the eutrophication period. Assuming the biomass abundance ratio as 0.08, their biomass during 2004-2005 is around 1000 mg m-3.
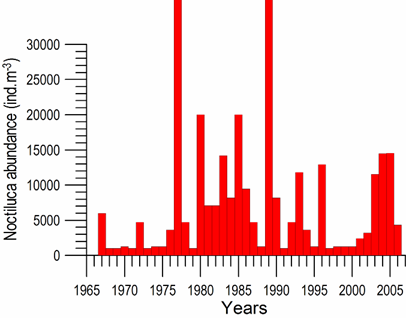
Fig. 6.13. N. scintillans spring-autumn mean abundance (ind.m-3) along the Bulgarian coastal waters.
Seasonal Changes: Trophic zooplankton abundance along the Bulgarian shelf during 2002-2006 revealed a linear trend of increase from low winter abundance (< 5000 ind. m-3) to highest abundance (>18000 ind. m-3) in July (Fig. 6.14a). N. scintillans follows trophic zooplankton and its population started building up in April and reached more than 10000 ind. m-3 in June-July (Fig. 6.14b) and therefore limited to some extent trophic zooplankton abundance. This period (spring-early summer) also involved weak development of A. aurita with a typical biomass of 50 g m-2 possibly due to its competitive disadvantage of consuming zooplankton against Noctiluca (Fig. 6.14c). Its high biomass (~200 g m-2) in September 2004 coincided with the low M. leidyi and Noctiluca biomass. Starting by August, trophic zooplankton abundance decreased abruptly and remained below 5000 ind. m-3 when M. leidyi biomass elevated up to 250 g m-2 in August-September (Fig. 6.14d). This peak biomass season of M. leidyi lasted only 2 months and dropped significantly by October due to the grazing impact of B. ovata.
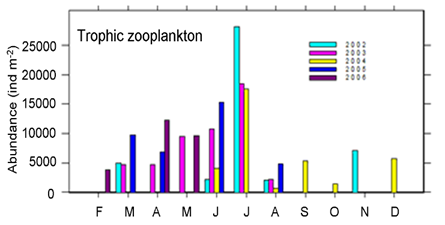
Fig. 6.14a. Seasonal changes of trophic zooplankton abundance along the Bulgarian shelf waters in 2002-2006.
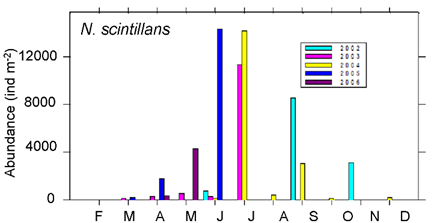
Fig. 6.14b. Seasonal changes of Noctiluca scintillans abundance along the Bulgarian shelf waters in 2002-2006.

|
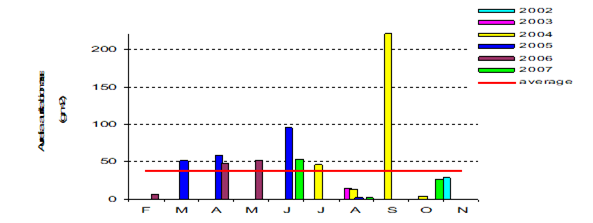
Fig. 6.14c. Monthly changes of Aurelia aurita biomass (g m-2) along the Bulgarian shelf waters in 2002-2007 (with data from the north-western region in 09.2004). The red line depicts the average of all monthly data in Bulgarian waters.
|

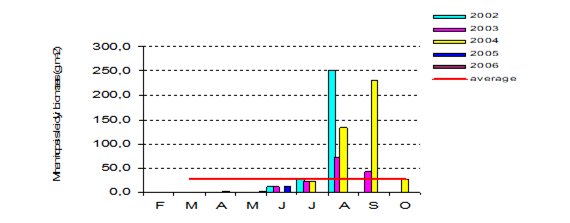
Fig. 6.14d. Monthly changes of Mnemiopsis leidyi biomass (g m-2) along the Bulgarian shelf waters in 2002-2006 (with data from the north-western region in 09.2004). The red line depicts the average of all monthly data in Bulgarian waters.
6.5. Turkish shelf area
The time series measurements performed in front of the Cape Sinop situated at the central sector of the southern coast suggested relatively low annual-mean zooplankton biomass with respect to western coastal waters during 1999-2005 (Fig. 6. 15).�� The sum of edible and non-edible (Noctiluca) biomass was maintained around 100 mg m-3 in 1999, 2004, 2005 whereas it was at least twice lower in relatively cold years 2002-2003. In all cases, more than 70% of the total biomass was formed by the non-edible zooplankton group which was mainly composed by Noctiluca scintillans, the main indicator species of eutrophic waters. Noctiluca biomass was particularly dominant in the winter and early-spring during the cold year 2003 and in the spring and summer (up to a maximum of 20 g m-2) during the subsequent relatively warm year, 2004 (Fig. 6.16). In terms of abundance, both edible zooplankton and Noctiluca varied in the range 0-4000 ind. m-3 during 1999-2005 that was two-to-three times smaller than in the Bulgarian shelf (Fig. 6.17) and therefore can not be considered as the bloom level.
Edible zooplankton was mostly dominated by Copepoda throughout the observation period (Fig. 6.18). Highest edible zooplankton abundance and biomass was recorded in February-March during 1999, 2000, and 2003, but shifted to the late summer-early autumn in 2004, 2005 (Fig. 6.16, 6.17). N. scintillans generally dominated zooplankton community in late-spring and summer months. Edible zooplankton abundance reduced substantially during the months of high N. scintillans abundance (Fig. 6.16, 6.17) as well as of high Mnemiopsis abundance (Fig. 6.19) that was generally lower than 50 ind.m-2 except twice higher abundance during the summer 2003. Copepoda and Noctiluca contributed almost equally to the total zooplankton population during 2004 and 2005, but Copepoda was more dominant in other years (Fig. 6.15).
����������
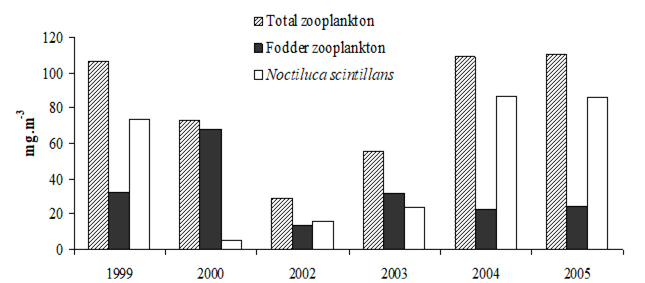
Fig. 6.15. Annual mean biomass (mg.m-3) of the total zooplankton, fodder zooplankton and Noctiluca scintillans off the Cape Sinop (in the central sector of the southern coast) during 1999-2005. Data sources: Unal, (2002), Ustun (2005), Bat et. al. (2007), Ustun et. al. (2007).
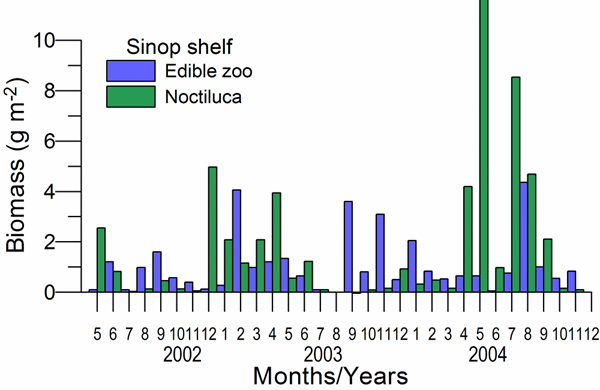
Fig. 6.16. Monthly biomass (g.m-2) changes of edible zooplankton and Noctiluca scintillans off the Cape Sinop (in the central sector of the southern coast) during 2002-2004. Data source: Ustun (2005).
|
|
|
|
|
|
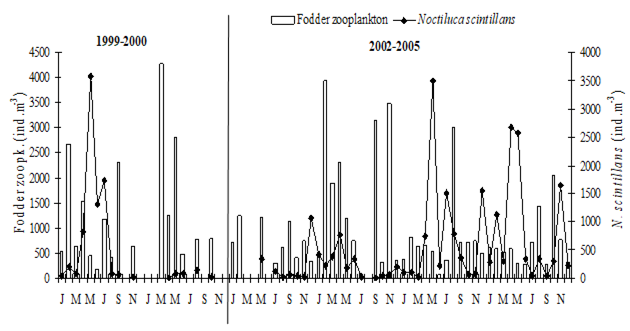
Fig. 6.17. Abundance (ind.m-3) variations of trophic zooplankton and N. scintillans off the Cape Sinop (in the central sector of the southern coast) during 1999-2005.
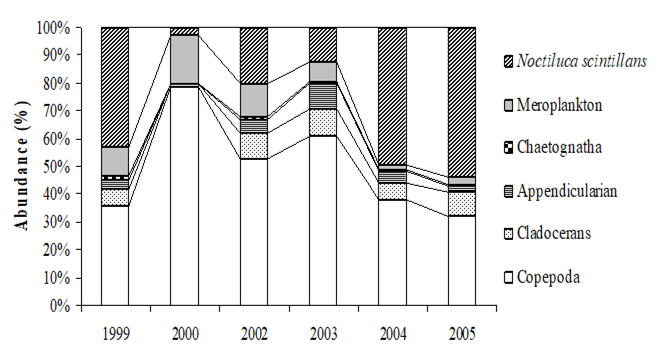
Fig. 6.18.�� Annual variation of zooplankton community structure abundance (%) in in the sea off Sinop.
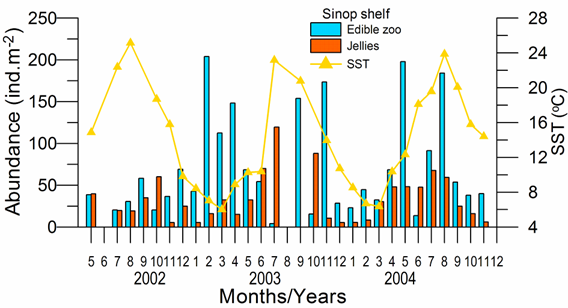
Fig. 6.19. Variations of edible zooplankton and jelly abundance (ind.m-3) and sea surface temperature off the Cape Sinop (in the central sector of the southern coast) during 2002-2004.
6.6. Georgian shelf area
Research on zooplankton biodiversity of the south-eastern Black Sea was limited. The data from pristine phase 1955-1957 (Table 6.10) indicated edible zooplankton biomass around 100��50 mg m-3 within the upper 25 m layer, of which 70-80% was produced during the spring-summer months. Owing to more enhanced production, abundance and biomass of trophic zooplankton formed mainly by Protozoa, Copepoda, and Cladocera increased two-folds during the 1990s but they were subject to high year-to-year variations (Fig. 6.20). The N. scintillans contribution to the total zooplankton biomass reduced from 50% in 1995 to 5% in 2002. The data further showed reappearance of Pontellidae Pontella mediteranea after 2002 that indicated recovery of the regional ecosystem.
��The comparison of annual-mean biomass of the upper 100 m layer from 1950s with the recent data from the 1990s and early 2000s suggested an increase from less than 75 mg m-3 up to a minimum of ~150 mg m-3 during 1996 and 2002 and a maximum of around 500 mg m-3 during 1998-1999 corresponding to the strong Beroe impact on Mnemiopsis population. The edible zooplankton biomass reduced gradually in the following years up to ~130 mg m-3 at 2002. However, even this minimum biomass registered in 2002 was higher than the maximum biomass measured at Galata site of the Bulgarian coastline during the same period.
Table 6.10. Annual changes of the trophic zooplankton biomass (mg∙m-3) in the south-eastern part of the Black Sea.
| Months | 1955 | 1956 | 1957 | |||
| (25-0 m) | (100-0 m) | (25-0 m) | (100-0 m) | (25-0 m) | (100-0 m) | |
| January | 44.5 | 34.7 | 23.4 | 48.5 | - | - |
| March | 76.6 | 66.6 | 11.4 | 18.0 | 95.0 | 65.0 |
| May | 69.7 | 95.1 | - | - | 145.0 | 89.3 |
| Jun | 38.8 | 33.8 | 191.5 | 121.0 | 100.4 | 62.2 |
| July | 41.4 | 22.7 | 56.0 | 43.3 | 99.6 | 53.8 |
| August | - | - | 69.8 | 31.3 | 305.4 | 98.1 |
| Total | 271 | 252.9 | 352.1 | 262.1 | 745.4 | 368.4 |
| Average | 54.2 | 50.6 | 70.4 | 52.4 | 149.1 | 73.7 |
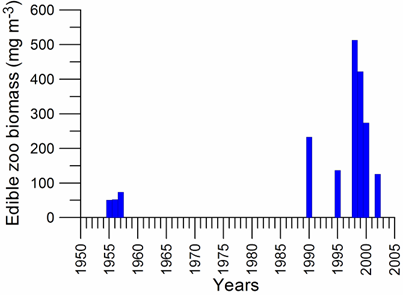
Fig 6.20. Annual-mean trophic zooplankton (Protozoa, Copepoda, Cladocera) biomass (mg m-3) variations in the Georgian waters during 1955-1957 and 1990-2002 within the upper 100 m layer.
6.7. Northeastern shelf area
The north-eastern part of the Black Sea has been monitored regularly by P.P.Shirshov Institute of Oceanology, Russian Academy of Sciences. The most important feature of zooplankton community structure after the early-1970s was the change in species composition and quantitative proportions between various groups of zooplankton species. The species of Copepoda and Pontelidae (e.g. Anomalocera patersoni, Pontella mediterranea, Labidocera brunescens) were the first victims of heavy pollution in the surface layer and their abundance declined to a negligible level in 1983 even though Pontella mediterranea was rather common in the open waters until the end of 1980s. Abundances of Oithona nana and Centropages ponticus were also reduced considerably in the early 1970s. Thus, the degradation of the zooplankton community started well-before the Mnemiopsis invasion. As the proportion of trophic zooplankton decreased, its species composition changed the proportion of non-trophic zooplankton, first Noctiluca scintillans then jellyfish Aurelia aurita increased. The significant increase of non-trophic zooplankton population and its grazing on large and small zooplankton and phyto- and microplankton led to worsening of the zooplankton community structure. The conditions also favored establishment of the new gelatinous warm-water ctenophore species M. leidyi. Within the warm surface layer, it found optimal conditions of temperature, salinity, and productivity, and hence reached extremely high abundances by the end of the 1980s.
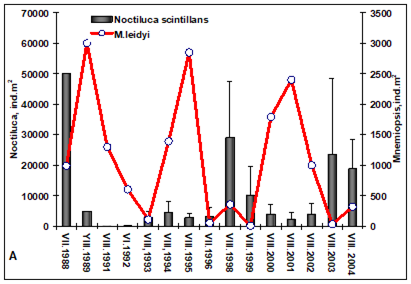
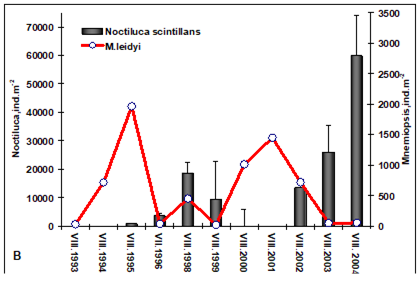
Fig. 6.21. Interannual variations of summer M. leidyi and N. scintillans abundances indicating their negative correlation for (a) inshore waters (r = �����0.3) and (b) offshore waters (r = �����0.4 p < 0.02) of the north-eastern basin.
Heterotrophic dinoflagellates Noctiluca scintillans was the first gelatinous organism that reached at an enormously high biomass in response to intense eutrophication during the 1980s. Later, its abundance decreased by strong food competition pressure exerted by Mnemiopsis (Fig. 6.21). During the first years of intense M. leidyi development (1989�����1991), the Noctiluca scintillans abundance dropped due to food competition advantage of M. leidyi as both of them feed on similar food resources (Greze, 1979). This is supported by the negative correlation between their summer abundances shown in Fig. 6.21. This correlation was partly controlled by the severity of climatic regime.
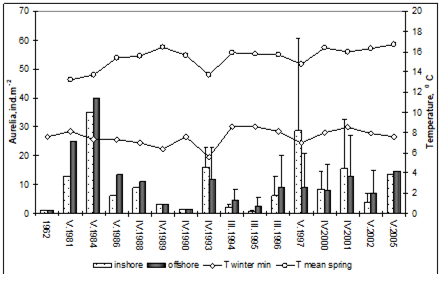
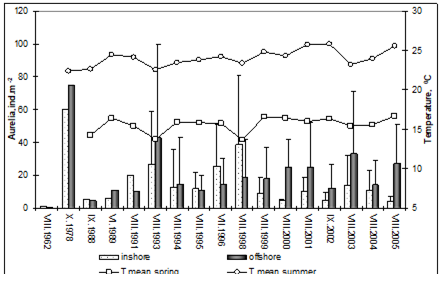
Fig. 6.22. Interannual variations of Aurelia aurita abundance in near-shore and offshore waters during (a) spring and (b) summer months, as well as of the mean spring and summer temperatures. The data are complied from various sources: Shushkina and Musaeva (1983); Shushkina and Arnautov (1987); Flint, Arnautov, and Shushkina (1989); Shiganova et al. (2003, 2006).
As M.leidyi tended to have lower abundance after cold winters, N. scintillans attained higher abundance due to lack of its competitor. Conversely, being a boreal cold-water organism, N. scintillans had more favorable reproduction capability in the years with cooler late-spring (May�����June) temperatures after more severe winters. In contrast, being a thermophilic species M. leidyi lived in the warm surface layer and reproduced better in warm climatic years. In the years with low M. leidyi control, N. scintillans abundance generally exceeded 20000 ind. m-2 and reached occasionally at 50000 ind. m-2, that was much higher than in the Bulgarian shelf and comparable to the NWS.
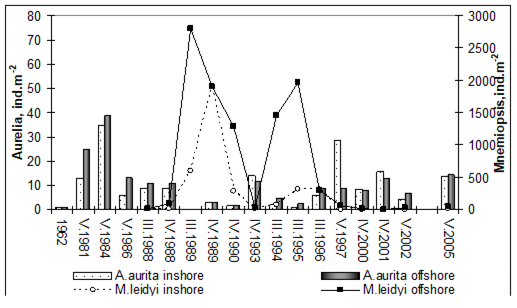
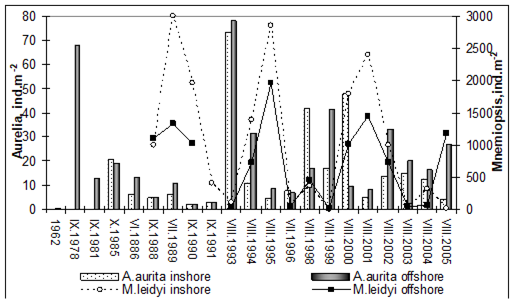
Fig. 6.23. Interannual variations of Aurelia aurita and Mnemiopsis leidyi abundances in coastal and offshore waters of the northestern basin during (a) spring, (b) summer months.
Aurelia aurita is also a cold-water species and more commonly distributed in boreal waters despite its presence in different climatic zones. Therefore, its abundance also likely followed the interannual climatic variations.�� During cooler spring phases, its abundance was higher due to more favorable winter generation at minimal winter temperatures of 7�����8 oC (Fig. 6.22a). Its correlation with spring temperatures is r = �����0.38 for coastal waters and r = 0.7 for cooler offshore waters (p < 0.01). A similar trend was also noted for the case of lower summer temperatures with the correlation of r = �����0.28 and r = �����0.5 (p<0.02) for coastal and offshore regions (Fig. 6.22b). Up to 90% of its individuals were aggregated in the thermocline layer where the temperature is precisely 8�����11oC and the subsequent Cold Intermediate Layer at depths of 30�����50 m (Fig. 6.22b). But their accumulation was observed to extend up to 70�����80 m depths, and small individuals were present in the mixed layer at the temperature range of 19�����20 oC as well (Shushkina and Arnautov, 1987). In the near-shore zones, they settled relatively cold waters near the bottom during warm periods (Gomoiu and Kupriyanov, 1980; Zaitsev, 1998; Shiganova, 2000).
Medusas physiological food demand amounts to 9�����13% of the total primary production which may be realized at a level of 95�����100% throughout the year. This implies that they can consume 34�����67% of the total mesozooplankton production or 47�����90% of the Copepod production. Increasing Aurelia aurita population therefore impose a strong negative influence on trophic zooplankton. Their detritus consumption, on the other hand, is relatively insignificant and roughly corresponds to the non-assimilated part of their ration.
A.aurita is not an obligate zooplanktivorous predator such as M. leidyi, and its ration may contain detritus, alga cells, and aggregates of bacteria. Moreover, their populations were disconnected from M. leidyi population that was largely confined into the surface mixed layer. Nevertheless, its abundance sharply dropped with the appearance of M. leidyi. In the years with high M.leidyi abundances, its both spring and summer populations decreased drastically (Fig. 6.23). Their correlation was respectively r= �����0.38 and r= �����0.7 (p < 0.01) for coastal and offshore waters in the spring and r= �����0.28 and r= �����0.5 (p<0.02) in the summer.
The absence of its predator and being a better competitor with respect to A. aurita and N. scintillans allowed M. leidyi to reach high abundance and biomass and to introduce enormous influence on the ecosystem. Edible zooplankton, meroplankton, and eggs and larvae of fishes were the main food resources for juvenile and adult individuals of M.leidyi. Therefore, it directly and most strongly affected their abundance, biomass, and species composition. The correlation between edible zooplankton and M.leidyi biomass in August prior to the settlement of Beroe is r = �����1 (p < 0.01) (Fig. 6.24).
M. leidyi was capable of consuming unlimited trophic zooplankton without any satiety as long as the zooplankton concentration higher than 3000 ind.m�����3 (Tsikhon-Lukanina et al., 1992). Although it had no food selectivity, it preferred small-sized preys in the range 0.75-1 mm. In the near-shore waters, its food was more diverse than in the open sea and its gastrovascular cavinity most often contained larvae of bivalves (Sergeeva et al., 1990; Tsikhon-Lukanina et al., 1991). Food objects might however change depending on the region, season, and even time of the day, varying also with the changes in species composition of zooplankton available. The most intensive feeding of M. leidyi was noted in the evening and about midnight (Sergeeva et al., 1990, Shiganova, 2000).
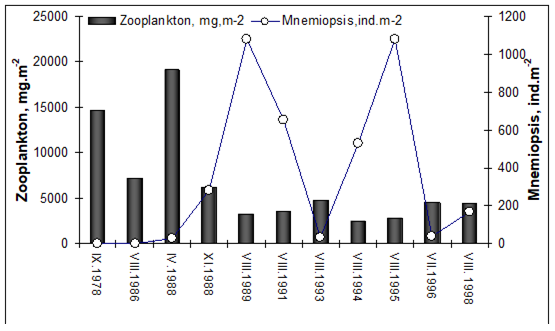
Fig. 6.24. Interannual variations of zooplankton biomass (mg m-2) and M. leidyi abundance (ind. m-2) before the B. ovata appearance.
M.leidyi appeared in selected regions of the Black Sea in spring 1988, but spread over the entire basin in summer 1988. The studies performed as early as in August-November 1988 showed large drop in zooplankton biomass (Fig. 6.24). In summer 1989, when M.leidyi reached its maximal development with respect to its abundance and biomass, the zooplankton community deteriorated even stronger (Fig. 6.24). This first affected small-sized zooplankton species; biomass of nanophages less than 1 mm in size decreased from 3 g m�����2 in spring 1988 to 0.2 g m�����2 in September. The abundance of Acartia clausi, Oithona nana, O. similis, adult Paracalanus parvus, and Parasagitta setosa experienced a decreasing trend (Fig. 6.25, 6.26). While their abundance was as high as 1000 ind. m�����2 during the years prior to the M.leidyi appearance (Pasternak, 1983), only three Parasagitta setosa individuals were sampled at all stations in September 1988 (Vinogradov et al., 1989). In addition, the Copepods Centropages ponticus and Paracalanus parvus were represented by single individuals. Oithona nana and representatives of the Pontellidae family and Parasagitta setosa disappeared by 1990. Starting from 1990, a decrease in the abundance of other planktonic species was observed such as Oithona similis, Acartia clausi, all the Cladocera species, and Oikopleura dioica, as well as Calanus euxinus that dwelled in deeper layers (Fig. 6.25, 6.26). Calanus euxinus executed vertical migration to subsurface layers in the night-time, where it became available for M.leidyi.
In 1991 and 1992, the total abundance and biomass of zooplankton decreased drastically (Fig. 6.24). During the first years of its development, M. leidyi therefore strongly affected the abundance, biomass, and species composition of the Black Sea zooplankton in coastal regions. As M.leidyi dwelled in the upper mixed layer and reached at its highest abundances in the summer, its first victims were the near-surface species of zooplankton that developed in the warm period of the year as well as the species that migrated to the surface layers for feeding.
In the exceptionally cold year 1993, the abundance and biomass of M.leidyi decreased (Fig. 6.24). The species diversity and abundance of selected zooplankton species, such as Pseudocalanus elongates, Calanus euxinus, and Oithona similis, increased in summer in the open waters owing to the low abundance of M.leidyi (Fig. 6.26). An increase in the abundance of the eurithermal Acartia clausi was observed in the near-shore waters (Fig. 6.25). The total abundance of edible zooplankton, however, remained very low (Fig. 6.24). Parasagita setosa was also noticed (Fig. 6.25). Among thermophilic species, significant amounts of Penilia avirostris were recorded. The species diversity and abundance were higher in the near-shore waters (Fig. 6.25) although even Centropages ponticus, which was absent in the previous years, was encountered in open waters (Fig. 6.26). However, the decrease in the abundance of eurithermal species all-year-round by 1993 was very high both in the open and near-shore waters with respect to the previous years.
The edible zooplankton diversity index was changing in the range 1.35�����1.8 in the spring prior to the Mnemiopsis era depending on the region and temperature (Zaika and Andryushchenko, 1996). But, it reduced to 0.5-0.7 range after the introduction of Mnemiopsis and attained its lowest value during its second population outburst at 1995, then it increased to 1.0-1.1 during 1996-1998 when Mnemiopsis abundance became lower (Fig. 6.27).����������
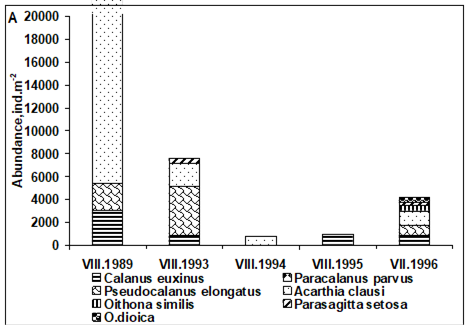
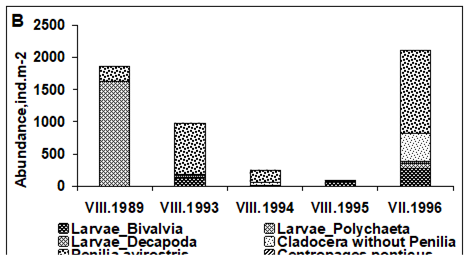
Fig. 6.25. Interannual variations of species composition and abundance of edible zooplankton in the inshore waters in August after the introduction of M.leidyi: (A) coldwater and eurythermal species, and (B) thermophilic species.
More noticeable increase in edible zooplankton abundance and biomass was observed after 1998 following the population outburst of Beroe ovata. During the first B. ovata outburst in August�����September 1999 (Fig. 6.28), the quantitative parameters of the edible zooplankton increased notably as compared to the last 10-year period of the M.leidyi invasion (Fig. 6.29, 6.30). The abundances of Cladocera species and Penilia avirostris were especially high. Pontella mediterranea appeared for the first time after its long-term absence. Among eurithermal species, Acartia clausi significantly increased its abundance, Paracalanus parvus and Centropages ponticus appeared, and Oikopleura dioica became abundant. A great number of nauplii and early copepodite stages (I�����IV) of A. clausi and C. ponticus were encountered, which suggested their high reproduction ability during this period. Among the cold water species, even in the near-shore zone, Pseudocalanus elongates became abundant, and the abundance of Parasagitta setosa reach 6�����15 ind. m�����2.
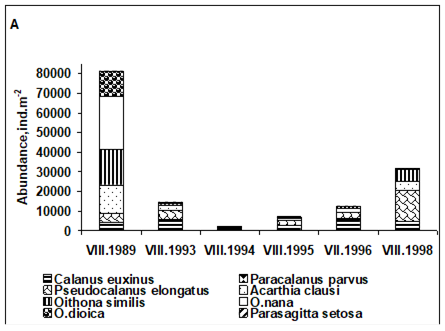
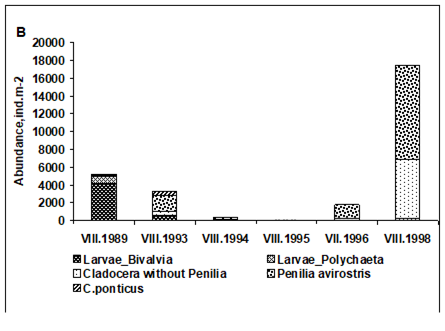
Fig. 6.26. Interannual variations in the species composition and abundance of edible zooplankton in the open sea waters in August after the introduction of M.leidyi: (A) coldwater and eurythermal species and (B) thermophilic species.
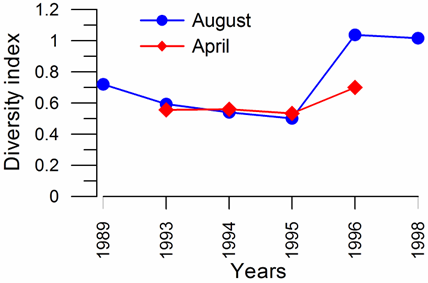
Fig. 6.27. Interannual variations in zooplankton biodiversity index of edible zooplankton (as an average of the inshore and offshore data) in the spring and August after the introduction of M. leidyi. ��

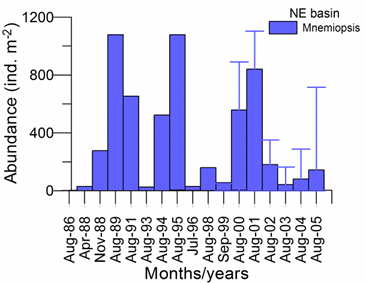
Fig. 6.28. Interannual variations of Mnemiopsis and Beroe abundances (ind.m-2) in August and September, respectively.
The edible zooplankton biomass and abundance underwent to large oscillations in the subsequent years (Fig. 6.31). In the warmest years (2000�����2002), before the seasonal development of B. ovata in August, M.leidyi reached high abundances comparable to pre-B.ovata period (Fig. 6.28) and reduced trophic zooplankton biomass. Nevertheless, it was higher than in the years before the B. ovata appearance. In the cold year of 2003, against the background low M.leidyi abundance in the near-shore zone (Fig. 6.28), a significant increase was observed in abundances of Acartia clausi, Oikopleura dioica, Calanus euxinus, Pseudocalanus elongates, and Parasagitta setosa (Figs. 6.29, 6.30). In the open sea, zooplankton abundance increased even more significantly; this refers both to thermophilic subsurface species and eurythermal and cold water ones. Their interannual variations were not so great (Fig.6.30), though an increasing trend in zooplankton species diversity was evident after the appearance of B. ovata. Despite this increase, their abundance was well below prior to the M. leidyi invasion (Zaika and Andryushchenko, 1969).
By the beginning of spring 2000, a noticeable increase in the abundance and biomass of edible zooplankton was observed as compared to the previous years due to the absence of M.leidyi (Fig. 6.32). The abundance of P. parvus, P. elongatus, and C. euxinus, which were represented in the spring mainly by nauplii and copepodites, increased. Also, the biomass of S. setosa became significantly higher. As a matter of fact, C. euxinus and P. setosa made a significant contribution to the biomass growth of forage zooplankton as early as April 2000, and this contribution reached 25.37 g m�����2 in the open waters where the abundance and biomass of total zooplankton were higher than in the near-shore zone (Fig. 6.32).
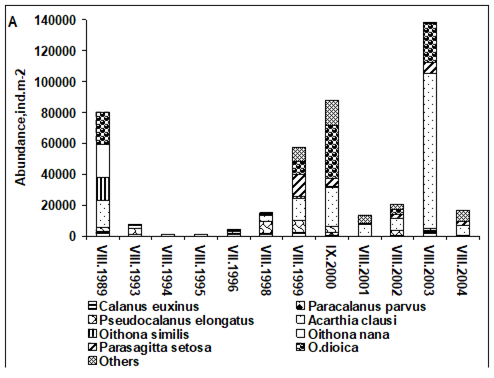
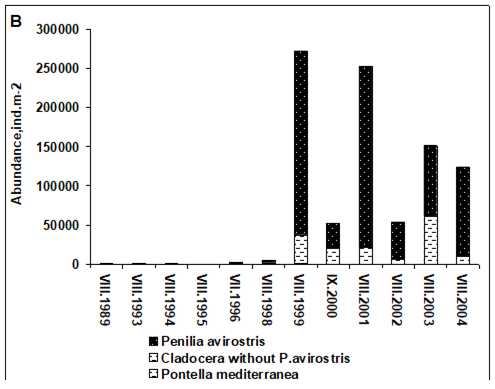
Fig. 6.29. Interannual variations in the species composition and abundance of edible zooplankton in the inshore waters in August: (A) coldwater and eurythermal species and (B) thermophilic species.
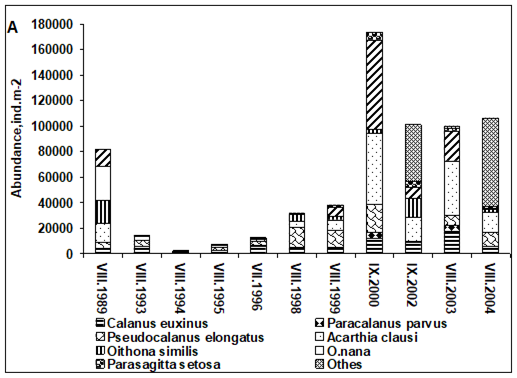
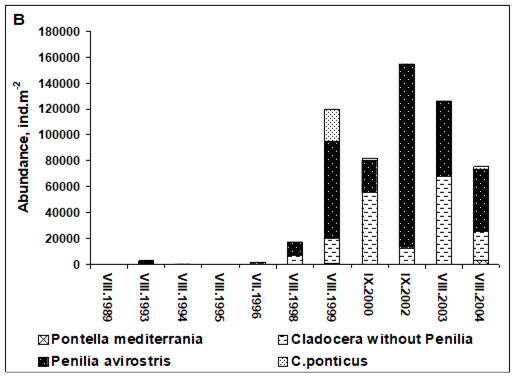
Fig. 6.30. Interannual variations in the species composition and abundance of zooplankton in the open sea waters in August: (A) coldwater and eurithermal species and (B) thermophilic species.
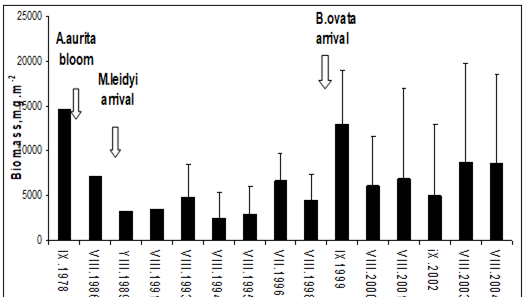
Fig. 6.31. Long-term changes of edible zooplankton biomass in the northeastern Black Sea during August-September, 1978-2004. The data for 1978-1991 were taken by Vinogradov et al. (1992) and for 1993-2004 by Shiganova et al. (2004).
Fig. 6.33 shows the change in edible zooplankton biomass within the deep basin following its lowest values during the early 1990s. In response to the weakening of Mnemiopsis grazing pressure after the introduction of Beroe, it increased from less than 3 g m-2 in the early 1990s to 12 g m-2 in 1999 and then exceeded 20 g m-2 by 2001. The edible zooplankton biomass was strongly dominated by Calanus euxinus in 1993, but its 80-90% abundance comprised Parasagitta setosa, Calanus euxinus and Acartia clausi in 1999-2008 (Fig. 6.34). Calanus euxinus increased steadily whereas Parasagitta setosa and Acartia clausi oscillated within the ranges 4-12 g m-2 and 1-4 g m-2, respectively. Noctiluca scintillans decreased to low quantities (< 1 g m-2) except 2000 and 2005 (Fig. 6.34) when its annual-mean biomass was elevated to about 5 g m-2 implying appreciably strong bloom episodes during either late-spring or autumn.
Fig. 6.35 depicts the influence of local circulation system on the zooplankton biomass distribution. When the Rim Current jet is confined over the narrow continental slope (November 2000 case in Fig. 6.35), relatively high edible zooplankton biomass is confined into the inshore part of the Rim Current zone and decreases offshore. In the presence of an anticyclonic coastal eddy and thus shift of the Rim Current jet axis further offshore, the region of higher zooplankton biomass expands offshore (July 2005 case in Fig. 6.35). Weakening of the Rim Current and its more pronounced offshore meandering homogenize the zooplankton biomass along the offshore transect and result in a patchy distribution (October 2001 case in Fig. 6.35). Alternatively, formation of a recurrent mesoscale eddy in the open sea causes a significant increase in zooplankton biomass within the eddy, as in the case of September 1999 in Fig. 6.35.
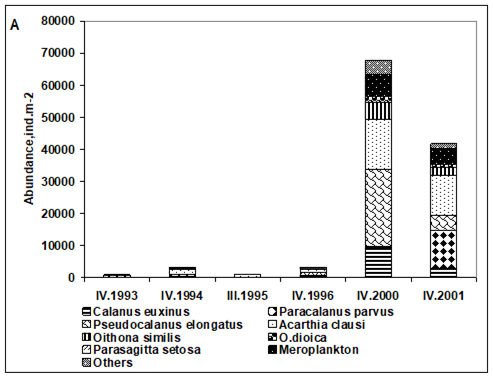
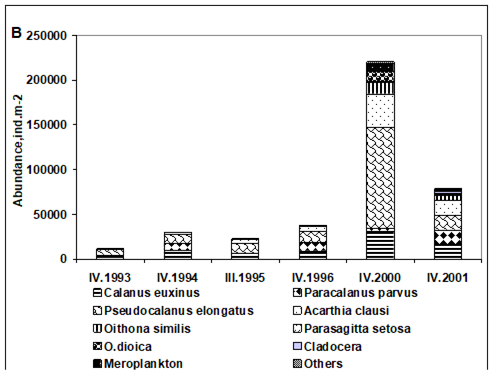
Fig. 6.32. Interannual variations in the species composition and abundance of edible zooplankton in the spring: (A) in the inshore zone and (B) in the open sea waters.
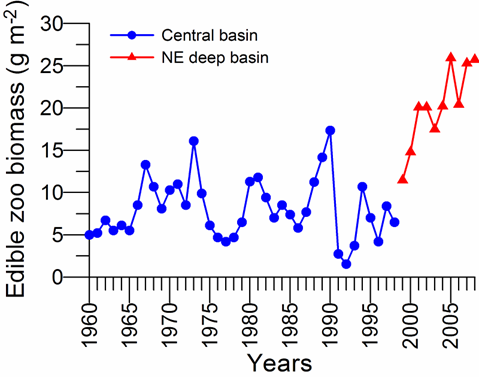
Fig. 6.33. long-term changes of edible zooplankton biomass within the deep interior basin of the Black Sea. The data shown by dots and triangles are provided by Kovalev et al. (1998) and Arashkevich et al. (2008a) for the northeastern basin.��
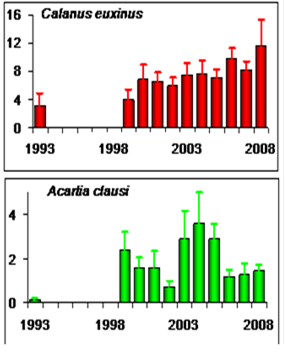
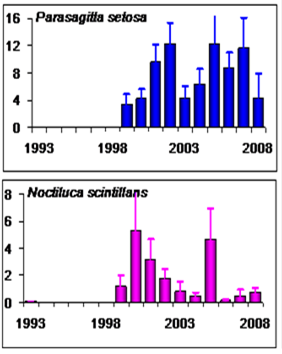
Fig. 6.34. Inter-annual biomass (g m-2) variations of dominant zooplankton groups during 1998-2008 (after Arashkevich et al., 2008a).


Fig. 6.35. The relation between mesoscale variability of the circulation system (left) and zooplankton biomass distribution (right) along an offshore-onshore transect in the NE basin. Zooplankton biomass was expressed by its normalized difference with respect to the mean biomass of each set of measurements (after Arashkevich et al., 2008a).
Most recent monthly measurements conducted along the northeastern coast of the Black Sea (Fig. 6.36) confirmed the negligible role of Mnemiopsis with respect to Aurelia during 2005-2007.�� Aurelia biomass typically constituted 80% of the total gelatinous biomass during all the measurement period except the autumn 2005 and the summer-autumn 2007 in which Pleurobrachia and Mnemiopsis dominated the gelatinous group, respectively. Aurelia attained its highest biomass of 400-600 g m-2 during its spring outburst period and persisted during rest of the year at the level of ~200 g m-2. On the other hand, Mnemiopsis reached at the biomass of ~800 g m-2 during the autumn 2008 that prevailed through the winter 2008, but it was still at least twice lower than its biomass measured during the 1990s.
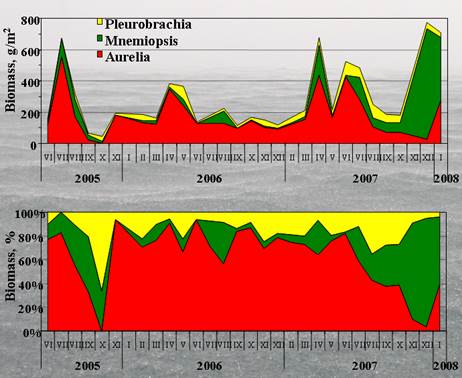
Fig. 6.36. Monthly changes of gelatinous predators Aurelia, Mnemiopsis, and Pleurobrachia as the mean of measurements at three stations within the northeastern coastal waters during 2005-2007 (after Araskevich et al., 2008b).
6.8. Conclusions
The zooplankton fauna experienced strong interannual variability in abundance, biomass and composition over the entire basin starting by the early 1970s. During the 1980s of intense eutrophication phase prior to the Mnemiopsis population outbreak, its species composition changed in favour of non-trophic zooplankton species, first Noctiluca scintillans then jellyfish Aurelia aurita. During 1990-2005, two particular phases were evident; strong M.leidyi domination prior to B. ovata settlement (1990-1997) and weak M.leidyi domination after B. ovata (1998-2005). During the former phase, biomass and abundance of edible zooplankton community decreased and species community was simplified considerably.
With the appearance of ctenophore Beroe ovata after 1997, edible zooplankton community began to recover both in species composition and abundance. The Mnemiopsis leidyi impact on trophic zooplankton structure was reduced to two months of the year instead of 6-8months before B.ovata arrival.�� But indigenous gelatinous species Noctiluca scintillans and Aurelia aurita also increased their population in some parts of the Black Sea due to low Mnemiopsis leidyi and Beroe ovata (the predator) abundances in cold years. Mnemiopsis leidyi was able to attain relatively high abundance and affected more adversely zooplankton community in warm years. Nevertheless, Copepod and Cladoceran biomass and abundance increased in some areas, P. mediterranea, C. ponticus and A. patersoni which were almost absent during 1980s-1990s were recorded during the 2000s at higher abundances. Other three holoplanktonic species (Copepod Centropages ponticus, Cladocer Penilia avirostris and Chetognata Parasagitta setosa) suffered from the eutrophication impact begun to recover their populations; their abundance exceeded opportunistic Copepod species Acartia clausi and Cladoceran species Pleopis polyphemoides. Non-indigenous A. tonsa was also observed in limited numbers after 2000. The almost extinct species P. mediterranea, being an indicator of high quality waters, re-appeared after 2000 as a sign of positive ecosystem changes. The ctenophore Pleurobrachia pileus also started occupying its ecological niche, which was totally replaced by Mnemiopsis after 1989.
From the diversity viewpoint, there are inevitable signs of improvement and rehabilitation of the coastal zooplankton biocoenose and an overall trend of recovery with respect to the 1980s. But the quantitative trophic zooplankton structure is still unstable and undergoes large interannual fluctuations at almost all regions of the Black Sea.�� The entire zooplankton community was particularly sensitive to the year-to-year climatic changes during the present decade. Aurelia aurita, Pleurobrachia pileus controlled trophic zooplankton population in cold years whereas Mnemiopsis leidyi served as the main predator in warm years. The trophic zooplankton biomass has a clear declining trend along the entire western coast whereas inclining trend along the northeastern coast. It has lowest values at the coastal site near the Cape Sinop, a relatively unpolluted and poorly productive region representing background conditions, along the central part of southern coast.
References
Arashkevich, E., Timonin, A., Nikishina, A., Louppova, N. (2008a) Impact of climate variations on zooplankton community in the NE Black Sea. In: 2nd biannual and Black Sea Scene EC project joint conference on climate change in the Black Sea ����� hypothesis, observations, trends, scenarios and mitigation strategy for the ecosystem. 6-9 October 2008, Sofia, Bulgaria.
Arashkevich, E., Chasovnikov, V., Kremenetskiy, V., Louppova, N., Mosharov, S., Nikishina, A., Pautova, L., Romanova, N., Sazhin, A., Soloviov, K., Timonin, A., Zatsepin, A. (2008b) Seasonal dynamics of the NE Black Sea shelf ecosystem. In: Sesame Project 1st Scientific Workshop. 18-20 November 2008, Palma de Mallorca, Spain.
Bat, L., Şahin, F., Satılmış, H.H., �œst��n, F., Birinci ���zdemir, Z., Kıdeys A.E., ve Shulman, G.E. (2007). Karadeniz'in değişen ekosistemi ve hamsi balık��ılığına etkisi. Journal of FisheriesSciences. DOI: 10.3153/jfscom.2007024, 1 (4):191-227.
Chichkoff G., 1912. Contribution �� l�������titude de la faune de la Mer Noire. Animaux ��colt��s sur les c�´tes bulgares. - Arch. Zool. exp. gen., 10 (2): 29-39.
Dineva S., 2005. Long-term evolution and trends of the hydrological and hydrochemical parameters in Bulgarian Black Sea waters during the period 1992-2000. Water Sci Technol., 51(11):19-26.
Finenko, G.A., Romanova, Z.A., I.Abolmasova, G.I., E.Anninsky, B.E., Pavlovskaya, T.V., Bat, L., Kideys, A. (2007) Ctenophores ���������� invaders and their role in the trophic dynamics of the planktonic community in the Crimean coastal regions of the Black Sea (Sevastopol Bay). In: 4th international zooplankton production symposium, May28 - June1, 2007, Hiroshima, Japan.
Flint, M.V., Arnautov, G.N., Shushkina, E.A. (1989) Quantitative distribution of jellyfish Aurita. In: Structure and productional characteristics of plankton communities in the Black Sea. Nauka, Moskow, 315-322.
Gomoiu M.-T. and Kupriyanov, S. S. (1980) Estimation of the Abundance and Distribution of the Medusas Aurelia aurita in the Eastern Part of the Black Sea. In: Ecosystems of the Pelagic Zone of the Black Sea, Ed. by M. E. Vinogradov (Nauka, Moscow,), 191�����198 (in Russian)
Greze,V.N., Boguslavsky, S.G., Belyakov, Yu.M. (1979) Principles of Biological productivity of the Black Sea (eds.Greze V.N.). Kiev, Naukova dumka, 391,1979 (in Russian).
Gubanova A., Yu. Prusova, U. Niermann, N. Shadrin, I. Polikarpov, 2001. Dramatic Change in the Copepod Community in Sevastopol Bay (Black Sea) during two Decades (1976-1996)., Seckenbergiana marit., 31 (1): 17-27.
Kamburska L., 2004. The role of nonindigenous ctenophores Mnemiopsis leidyi and Beroe ovata for the zooplankton alterations along the Bulgarian Black Sea coast, PhD Thesis, IO-BAS, 171 pp. (in Bulgarian).
Kamburska L., Stefanova K., 2002. Ecological state of zooplankton community in the system Beloslav Lake-Varna Lake-Varna Bay. Sixth International Conference on Marine Science and Technology ���œBlack Sea�����2002����, Proceedings vol. 1, 336-341.
Kamburska L., K. Stefanova, 2005. Distribution and size structure of nonindigenous ctenophore Mnemiopsis leidyi (Agassiz, 1874) in the Western Black Sea, 1998-2001. Acta Zool. Bulg., 57 (1), 2005: 83-94.
Kamburska L., Schrimpf W., Djavidnia S., Shiganova T., Stefanova K., 2006a. Addressing the ecological issue of the invasive species, Special focus on the ctenophore Mnemiopsis leidyi (Agassiz, 1865) in the Black Sea. EUR 22310 EN, JRC-EC Publication office, 59 pp.
Kamburska L., Shiganova T., Stefanova K., Moncheva S., Dowell M., 2006b. Interannual variations in the summer distribution of the invasive ctenophore Mnemiopsis leidyi A. Agassiz in the Black Sea. In: A. K. Stips, W. Schrimpf (eds.) Proceedings of the Workshop on ���œUnderstanding and modelling the Black Sea ecosystem in support of marine conventions and environmental policies����, EUR 22176 EN, JRC-EC Publication office, 8-14.
Konsulov A, L. Kamburska, 1998 a. Ecological determination of the new ctenophora‑Beroe ovata invasion in the Black Sea. Океанология, ИО-БАН, Варна, т. 2, 195-198
Konsulov A., L. Kamburska, 1998b. Black Sea zooplankton structural dynamic and variability off the Bulgarian Black Sea coast during 1991‑1995. NATO ASI Series, ���œNATO TU‑BLACK SEA PROJECT Ecosystem Modeling as a Management Tool for the Black Sea, Symposium on Scientific Results����, L. Ivanov & T. Oguz [eds.], Kluwer Academic Publishers, v. 1, 281‑293.
Koval, L.G. (1984) Zoo- and necro-zooplankton of the Black Sea. Kiev, Nauka Dumka, 127pp (in Russian).
Kovalev, A., Besiktepe, S., Zagorodnyaya, Yu.A. and Kideys, A.E., 1998. Mediterranization of the Black Sea zooplankton is continuing. In: NATO TU-Black Sea Project: Ecosystem Modeling as a Management Tool for the Black Sea, Symposium on Scientific Results, L. Ivanov&T. Oguz (eds.), Kluwer Academiz Publishers, pp.221-234.
Moncheva S., Doncheva V., Shtereva G., Kamburska L., Malej A., Gorinstein S., 2002. Application of eutrophication indices for assessment of the Bulgarian Black Sea coastal ecosystem ecological quality, Water Sci. Technol., v. 46, No. 8, 19-28.
Mordukhay-Boltovskoy F.D. (1969) Crustacea. In: Guide of fanua of Black and Azov Seas.V.1. Invertabrates, 8-151 (in Russian).
Oguz, T., 2005. Long-term impacts of anthropogenic forcing on the Black Sea ecosystem. Oceanography, Special issue features: Black Sea Oceanography, vol. 18, 2, 112-121.
Oguz, T. and D. Gilbert. 2007. Abrupt transitions of the top-down controlled Black Sea pelagic ecosystem during 1960�����2000: Evidence for regime-shifts under strong fishery exploitation and nutrient enrichment modulated by climate-induced variations. Deep-Sea Res. I (54), 220�����242.
Pasternak, A. F. (1983) Seasonal Dynamics of the Abundance and Biomass of Zooplankton off the Coast of the Northern Caucasus. In: Seasonal Changes in the Black Sea Plankton, Ed. by Yu. I. Sorokin and V. I. Vedernikov, Nauka, Moscow, 139�����177 (in Russian).
Petran A., Moldoveanu M. (1994) Characteristics of the structure and���� quantitative development of zooplankton�� from the Black Sea shallow water during 1990-1994. Cercetari marine - Recherches�� marines.
Petran A., Apas M., Bodeanu N., Bologa A.S., Dumitrache�� C., Moldoveanu M., Radu, G., Tiganus V. (1999) Status and evolution of the Romanian Black Sea coastal ecosystem. In: Environmnetal degradation of the Black Sea: Challenges and Remedies, 175-195. Kluwer Academic Publishers, Printed in Netherlands.
Polischuk L.N. Nastenko E.V. (1998) Some features of development of zooplankton of the northwestern Black Sea and its composition of the Danube estuarine area. Ecosystem of the marine part of the Danube. Odessa: Astroprint, 188-224 (in Russian).
Polischuk L.N. (2005) The state of zooplankton near Zmeiny Island and Danube estuarine areas in 2003. Visnik Odeskogo natsionalnogo universiteta, 10(4), in Russian.
Porumb F. (1972) Contributions a la coonoissance de la dynamique des�� populations et a la productions des Copepodes dans les eaux roumaines de la mer Noire, Cercetari Marine IRCM Constanta, 4, 57-94.
Porumb F. (1980) Developpement du zooplancton dans les conditions������ d'eutrophisation des eaux du litoral roumain de la mer Noire, V-es Journees Etud. Pollutions, CIESM, Cagliari, 881-886.
Sergeeva, N. G., V. E. Zaika & T. V. Mikhailova, 1990. Nutrition of ctenophore Mnemiopsis mccradyi (Ctenophora, Lobata) in the Black Sea. Zool. J. Ecologia Morya 35: 18-22 (in Russian).
Shiganova, T.A., 1998. Invasion of the Black Sea by the Ctenophore Mnemiopsis leidyi and Recent Changes in Pelagic Community Structure, Fisheries Oceanography-GLOBEC Special Issue, Coombs, S., Ed.: 305-310.
Shiganova, T.A., 2000. Certain Results of Studying Biology of Invader M. leidyi (A.Agassiz) in the Black Sea, Grebnevik Mnemiopsis leidyi (A.Agassiz) v Azovskom i Chernom moryakh i posledstviya ego vseleniya (Comb Jelly Mnemiopsis leidyi (A.Agassiz) in the Sea of Azov and Black Sea and Consequences of Its Settling), Volovik, S.P., Ed., Rostov-na-Donu,: 33-75.
Shiganova, T.A., E. I. Musaeva, Y. V. Bulgakova et. al., 2003. Ctenophores invaders�� Mnemiopsis leidyi (A.Agassiz) and Beroe ovata Mayer 1912, and their effect on the pelagic ecosystem of the northeastern Black Sea.. Biological Bulletin 2: 225-235.
Shiganova T.A., Dumont H. J. D, Mikaelyan A. , Glazov D. M., Y. V. Bulgakova, E. I. Musaeva, P. Y Sorokin, .L A. Pautova, Z. A. Mirzoyan & E I. Studenikina. 2004. Interaction between the Invading Ctenophores Mnemiopsis leidyi (A. Agassiz) and Beroe ovata Mayer 1912, and their Influence on the Pelagic Ecosystem of the Northeastern Black Sea�� Edc. Dumont, H., T. Shiganova & U. Niermann�� ����� The Ctenophore Mnemiopsis leidyi in the�� Black, Caspian and Mediterranean Seas and other aquatic invasions - NATO ASI Series, 2. Environment-. Kluwer Academic Publishers: 33-70.
Shiganova, T.A., E. I. Musaeva, Y. V., Slabakova N., Alexandrova V., 2006. Spatial variability of zooplankton community structure along euthrophication gradient (a case study Varna Bay-Varna lakes costal area). International scientific conference ���œProblems of biological oceanography in the XXI century���� devoted to 135-th anniversary of IBSS, September 19 ����� 21, 2006, Sevastopol, Ukraine.
Shushkina, 1991. The estimation of population characteristics of Aurelia aurita in the Black Sea. Oceanology, 31: 434-441.
Shushkina E. A. and Arnautov, G. N. (1987) Medusas Aurelia in the Plankton of the Black Sea. In: Present-Day Condition of the Black Sea Ecosystem, Ed. by M. E. Vinogradov and M. V. Flint. Nauka, Moscow, 186�����196 (in Russian).
Shushkina E. A. and Musaeva, E. I. (1990) The Amount of the Invader Ctenophore Mnemiopsis in the Black Sea Continues to Grow (Expedition on Aboard R/Vs Akvanavt and Gidrobiolog in April 1990), Okeanologiya 30(4), 702�����703.
Stefanova K., Kamburska L., Gubanova A., Altukhov D., 2006a. State and trends of zooplankton community in the coastal Black Sea ecosystems of Varna and Sevastopol bays. 1st Biannual Scientific Conference Black Sea Ecosystem 2005 and Beyond- Dedicated to the 10th Anniversary of the Strategic Action Plan for Rehabilitation and Protection of the Black Sea. 8-10 May 2006, Istanbul, Turkey.
Stefanova K., Kamburska L., Moncheva S., Doncheva V., Slabakova N., Alexandrova V., 2007. Zooplankton community changes along the eutrophication gradient Varna Lakes- Varna Bay (Western Black Sea), Rapp. Comm. int. Mer M��dit., 38, 605.
Temnykh, A., Melnikov, V., Zagorodnyaya, Y., Moryakova, V. (2006) The variability of the Black Sea zooplankton as a derivative of long term dynamics in the water hydrological structure. In: Black Sea Ecosystem 2005 and Beyond, May 8 2006, Istanbul, Turkey.
Tsikhon-Lukanina, E.A., Reznichenko, O.G., and Lukasheva, T.A., 1991.Quantitative Aspects of Nutrition of Comb Jelly Mnemiopsis leidyi in the Black Sea, Okeanologiya, 31(2), 272-276.
Tsikhon-Lukanina, E.A., Reznichenko, O.G., and Lukasheva, T.A., 1993. Level of Fish Fry Consumption by Mnemiopsis in the Black Sea Shelf, Okeanologiya, , vol. 33(6), 895-899.
Unal, E., (2002). Seasonality of zooplankton in the Southern Black Sea in 1999 and Genetics.
Ustun, F., 2005. The composition and seasonal distribution zooplankton in the region of Sinop Cape of the Black Sea, Turkey. M.S. Thesis, O.M.U. Fen Bilimleri Enstit��s��, Samsun, pp. 172.
Ustun, F., Bat, L., Sahin, F., Satilmis H., Ozdemir, Z.B., Kideys, A.E., (2007). Annual cycle of zooplankton off Sinop, the Southern Black Sea, in 2003-2004. Rapport Du 38e Congr��s De La Commission Internationale Pour L�����Exploration Scientifique De La Mer M��diterran����, CIESM, Monaco, pp.628.
Valkanov A., 1935. Remarks on our brackish water, 1 ����� Annual of Sofia University, Sofia, 31: 1-55 (in Bulgarian).
Velikova V. and Chipev N. (2005).���� Large-scale disturbances (regime shifts) and recovery in aquatic ecosystems: challenges for management towards sustainability, Proceedings UNESCO Workshop, 13-17 June 2005, Varna, Bulgaria, http://www.ecolab.bas.bg/main/events/past-new/unesco-ws/docs/ws-rep/.
Vinogradov, M.E., Shushkina, E.A., Musaeva, E.I., and Sorokin, P. Y., 1989.New Settler in the Black Sea-Comb Jelly Mnemiopsis leidyi (Agassiz), Okeanologiya, vol. 29, no. 2: 293--299.
Vinogradov, M.E., Sapozhnikov, V.V., and Shushkina, E.A., 1992.Ekosistema Chernogo morya (Ecosystem of the Black Sea), Moscow: Nauka: 112 pp. (in Russian).
Zaika V.E., Andruszhenko A.A. 1996. Taxonomic diversity of the Black Sea phyto- and zooplankton. Hydrobiological Journal, 3, 12-19.
Zaitsev Yu.P. (1998) Marine hydrobiological investigations of National Academy of Science of Ukraine during 90s in XX century: Shelf and coastal water bodies of the Black Sea. Gydrobiol. zhurn., 34(6), 3-21 (in Russian).
Zaitsev, Y.P. and Aleksandrov, B.G., 1997 .Recent Man-Made Changes in the Black Sea Ecosystem, Sensivity of North Sea, Baltic Sea and Black Sea to Antropogenic and Climatic Changes, Ozsoy, E. and Mikaelyan, A., Eds. Kluwer Academic, 25-32.
CHAPTER 7 THE STATE OF MACROPHYTOBENTHOS (G. Minicheva et al.)
Odessa Branch, Institute of Biology of the Southern Seas, NASU, Odessa, Ukraine
O. V. Maximova, N. A. Moruchkova, U. V. Simakova
P.P.Shirshov Institute of Oceanology RAS, Moscow, Russian Federation
National Institute for marine research and development ���œGrigore Antipa����, Constanta, Romania,
Institute of Oceanology, Bulgarian Academy of Sciences, Varna, Bulgaria,
��Istanbul University, Faculty of Fisheries, Istanbul, Turkey
Sinop University, Faculty of Fisheries, Sinop, Turkey
7.1. Introduction
The Black Sea bottom algoflora is the impoverished derivative of the Mediterranean one. The species list today comprised 80 Chlorophyta, 76 Phaeophyceae and 169 Rhodophyta (Milchakova, 2002; 2003a,b, 2007). Many of them, however, have either disappeared completely or impoverished, whereas some others flourished during the last decades due to the severe impact of eutrophication on the bottom phytocoenosis. The most well-known sign of the transformations in macrophytobenthos community was the loss of Phyllophora in the region of Zernov�����s Phyllophora Field of the northwestern Black Sea. The drastic decrease of macrophytes diversity and almost total disappearance of perennial algae were among the most important changes that had occurred as a result of natural and man-made factors. Given the importance of macroalgae as food and refuge for animals, as well as source of external metabolites and oxygen, their decline affected the entire benthos life. The present chapter reviews the recent changes took place in the macrophytobethos community and assesses its recent status in different coastal environments of the Black Sea
7.2. Ukrainian shelf area
More than 70% of species diversity of macroalgae as well as six species of higher flowering plants (Zostera marina L., Z. noltii Hornem., Zannichellia major Boenn. Ex Reichenb, Ruppia cirrhosa Grande, R. maritime L., Potamogeton pectinatus L., and highly developed algae from the phylum Charophyta) have been present in the northwestern sector of the Black Sea, including the Crimean coastline. The region extending from the Danube Delta (Zmeiny Island) to Tarkhankut Cape 45��N latitude and the Crimean coastal zone are two particular areas with different floristic composition and structural-functional organization of macrophytobenthos communities. The former is affected by the runoff from large rivers (Danube, Dniester, Bug, and Dnepr) and includes numerous limans and shallow water bays. The second region is characterized by a large amount of hard substrate and embayments suitable for settling of macrophytes. Higher salinity and lower level of eutrophication also support richer species diversity. While ~50% of species composition was made up of representatives of red algae in both areas, lower salinity and higher eutrophication in the northwestern part prevailed the development of green algae and to a lesser extent the brown algae (Table 7. 1 and Fig. 7.1).
Table 7.1. Number of macroalgae species (underlined) and its percentage (bold) in the total floristic composition of the northwestern coastal waters of the Black Sea (Milchakova, 2007; Eremenko, Minicheva, Kosenko, 2006).
| Area | Taxonomic phyla | Total | ||
| Chlorophyta(Green algae) | Phaeophyta (Brown algae) | Rhodophyta(Red algae) | ||
| Northwestern coast | 54 29 | 45 24 | 87�� 47 | 186*�� 57** |
| Crimean coast | 56 24 | 62 27 | 115 49 | 233 71 |
* - number of species
** - percentage of Black Sea floristic composition
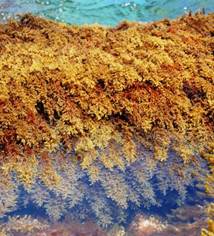
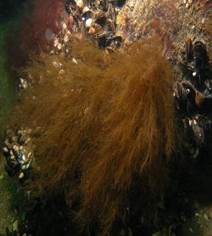
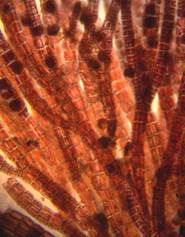
Fig. 7.1. Photos for the brown algae Cystoseira barbata (left), Desmarestia viridis (center) and the red algae Polysiphonia elongata (right).
The long-term changes in the species composition of algae of the Zernov�����s Phyllophora Field are summarized in Table 7.2. During the 1970s of intense eutrophication, the greatest change in the phytobenthos structure of the northwestern shelf was the disappearance of the brown algae Cystoseira barbata (Fig. 7.1) from the coastal phytocenose of the Danube ����� Dnepr interfluves. However, other brown algae of arctic-boreal flora, Desmarestia viridis (Fig. 7.1) was introduced into this area in the 1990s that then spread rapidly and became the dominant species in the cold periods of the year along the Odessa coast within the next 5-6 years. Massive covering of D. viridis thallus with dimensions of 30-50 cm have been often observed along the beaches in March ����� April. Its specific surface of the population index [(S/W)p], that indicates the amount of active thalloma surface per 1 kilogram mass of the macrophyte population,�� reached 70 m2 kg -1. Besides, the early 1990s of the northwestern Black Sea experienced intense developments of red algae Polysiphonia sanguinea and Pylaiella littoralis with high (S/W)p index values of 78.3 �� 1.9 m2 kg -1 and 140.2 �� 5.1 m2 kg -1, respectively.
Table 7.2. Long term changes in the species composition of algae of the Zernov Phyllophora Field.
| Species | 1964* | 1986* | 1989* | 2004 | 2006 | 2008 |
| Chlorophyta | ||||||
| Bryopsis plumosa (Huds.) C.Ag. | + | + | - | - | + | - |
| Chaetomorpha mediterranea (Kutz.) Kutz. | - | - | + | - | - | - |
| Cladophora albida (Nees) K��tz. | + | + | - | + | - | + |
| C. liniformis K��tz. | - | + | - | - | + | - |
| Ulva rigida Ag. | - | - | - | - | - | + |
| Enteromorpha compressa (L.) Nees | + | - | - | - | - | - |
| Rhizoclonium tortuosum (Dillw.) K��tz. | - | - | - | + | - | - |
| Stigeoclonium tenue Kutz. | - | - | - | - | - | + |
| Ulothrix implexa Kutz. | - | - | - | - | - | + |
| Ochrophyta | ||||||
| Cladostephus spongiosus f .verticillatus | + | + | + | - | - | - |
| Cystoseira barbata (Gooden et�� Woodw.)C. Ag. | + | + | - | - | - | - |
| Feldmannia irregularis (K��tz.) Hamel. | + | + | - | - | + | - |
| Ectocarpus fasciculatus Harv. | + | - | - | - | - | + |
| E. siliculosus (Dillw.) Lyngb. | + | - | - | - | - | + |
| Giraudya sphacelarioides Derb.et Sol. | + | - | - | - | - | - |
| Ralfsia verrucosa (Aresch.) J. Ag. | + | - | - | - | - | - |
| Stictyosiphon adriaticus K��tz. | + | - | - | - | - | - |
| Stilophora rhizodes (Ehrh.) J. Ag. | + | - | - | - | - | - |
| Sphacelaria cirrosa (Roth.) Ag. | + | - | - | - | + | + |
| S. saxatilis (Kuck.) Sauv. | + | + | - | - | - | - |
| Striaria attenuata (C. Agardh) Grev. | + | + | - | - | - | - |
| Spermatochnus paradoxus (Roth.) K��tz. | + | - | - | - | - | - |
| Desmarestia viridis (O. Mull. in Hornem.) | - | - | - | - | + | - |
| Rhodophyta | ||||||
| Acrochaetium savianum (Menegh.) | - | - | - | - | - | + |
| Rhodochorton purpureum (Lightf.) Rosevn. | + | - | - | - | - | + |
| Antithanmion cruciatum (Ag.) N��g. | + | + | - | - | - | - |
| Callithamnion corymbosum (Sm.) Lyngb. | - | - | - | - | + | - |
| Ceramium diaphanum (Lightf.) Roth | + | + | + | + | - | + |
| C. deslonchampii Chauv.ex Duby | + | - | - | - | - | - |
| Dasyopsis apiculata (Ag.) A. Zin. | + | - | - | - | - | - |
| Lithothamnion sp. | + | - | - | + | - | + |
| Lomentaria clavellosa (Turn.) Gail. | + | - | - | - | - | + |
| Lophosiphonia obscura (Ag.) Falkenb. | + | + | + | - | - | - |
| Pneophyllum fragile K��tz. | + | - | - | + | + | + |
| Peyssonnelia rubra (Grev.) J. Ag. | + | - | - | + | - | + |
| Phyllophora truncata (Pall.) Zinova | + | + | + | + | + | + |
| Ph. crispa (Huds.)P.S.Dixon | + | + | + | + | + | + |
| Ph. pseudoceranoides (S.G.Gmel.) Newr., Tayl. | + | + | + | - | + | + |
| Polysiphonia denudata (Dillw.) K��tz. | + | + | - | - | - | + |
| P. elongata (Huds.) Harv. | + | + | + | + | + | - |
| P. sanguinea (Ag.) Zanard. | - | - | - | + | + | + |
| Total number of species | 31 | 16 | 8 | 10 | 12 | 19 |
* Kalugina-Gutnik and Evstegneeva (1993) and Milchakova (2003a), Tsarenko, Wasser and Nevo (2006).
Table 7.3. Variability of morphological structure of thallus for some common macroalgae of the Ukrainian coast.
| Structural element | Specific surface�� (S/W)p, m2·kg-1 | ||
| Cystoseira barbata | Polysiphoniaelongata | Desmarestia��viridis | |
| Main axis (stem) | �� 2.78 �� 0.17 | ������ 3.70 �� 0.02 | �� 13.62 �� 0.36 |
| Lateral branches, 1-st order | �� 5.84 �� 0.71 | ������ 4.60 �� 0.11 | �� 23.90 �� 0.49 |
| Lateral branches, 2-nd order | 11.87 �� 0.45 | ������ 6.10 �� 0.10 | �� 37.98 �� 0.80 |
| Lateral branches, 3-rd order | 14.82 �� 0.52 | �� 18.80 �� 0.49 | �� 68.68 �� 2.35 |
| Apical�� branches�� | 18.42 �� 0.82 | �� 88.50 �� 2.18 | 102.75 �� 2.78 |
| Total for thallus | 11.62 �� 0.42 | �� 26.88 �� 3.21 | �� 76.72 �� 3.56 |
| S/W variability for thallus (%) | 135 | 315 | 103 |
In the 1990s, expansion of P. elongata of the Polysiphonia genus was also recorded in the northwestern part of the Black Sea. P. elongata was constantly observed in communities of the Crimean coastal zone in eutrophic and oligotrophic reserve areas (Karadag, Tarkhankut, and Utrish) as well as along the northwestern coast (Milchakova and Kireeva, 2000). Both thick main branches and very thin posterior branches with two-fold greater (S/W)p indices of P. elongata with respect to Cystoseira and Phyllophora (Table 7.3) provided a high intensity metabolic processes and adaptation to diverse conditions in eutrophic and oligotrophic waters at depths up to 50 m, and thus successfully taking over the vacant ecological nich in the mid-1990s.
Severe eutrophication in the northwestern Black Sea has therefore led to a distinct dynamics of structural-functional organization of macrophyte communities. The species with (S/W)p < 15 m�� kg-1 ceased to develop due to the increasing level of eutrophication during the early 1970s and 1980s (Minicheva, 1998), (Fıg. 7.1A). In this period Cystoseira was replaced by algal communities of the genus Ceramium, Cladophora, Enteromorpha and the total phytobenthos biomass declined from 3.0 kg∙m-2 to 1.0-1.5 kg∙m-2.
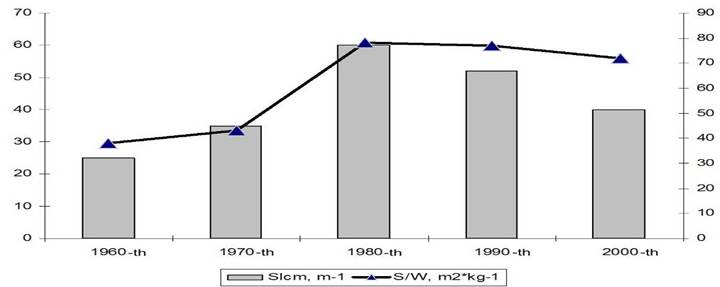
Fig. 7.1A.�� Dynamics of changes in surface index (SIcm) and average value of specific surface (S/W) of species composition of phytobenthos of the Danube-Dnepr interfluves.
The end of the 1980s and the early 1990s may be considered as the period of stabilization. This was followed by a significant reduction in the productivity of opportunistic algae species after the mid-1990s that suggested weakening of the eutrophication process. In the autumn 2004, July 2006 and March 2008 surveys, some of the extinct species of Zernov�����s Phyllophora field have been emerged again. The finely branched, ecologically active P. sanguinea began to develop in communities of Phyllophora crispa = Phyllophora nervosa with (S/W)p = 10.4 m2 kg -1 and Phyllophora truncata = Phyllophora brodiaei with (S/W)p = 11.5 m2 kg -1, forming up to 20-30%�� of the vegetative biomass in the summer period. The expansion of P. elongata at the beginning of the present decade may be considered an intermediate stage in the restoration process, the length of which depends on the rate of decrease of the eutrophication and the climatic conditions. If the present day tendency persists, it is quite possible to expect restoration of the Cystoseira community in the Danube-Dnepr interfluves and more favorable conditions for development of Phyllophora on the northwestern shelf. Table 7.4 summarizes four stages in the transformation of the macrophytobenthos of northwestern Black Sea.
The decreasing trends in average macrophyte biomass and production (Fig. 7.2) also support restoration of the system along the northwestern coast. The sharp peaks in 2002-2003 suggest the impact of anomalous climatic conditions. The winter of 2002-2003 was the coldest one in the last 50 years (Adobovskiy and Bolshakov, 2004) which altered the seasonal dynamics of macrophytes. The Odessa coastal zone was characterized by an intense development of winter species D. viridis, Punctaria latifolia Grev., and Ectocarpus confervoides (Roth.) Le Jolis until the mid-June 2003 but dominated by Enteromorpha intestinalis (L) Link and Cladophora laetevirens (Dillw.) Kutz in June- July 2003. The data therefore suggest that such anomalous future climatic conditions may introduce important biological changes in addition to the effects of eutrophication processes.
The stages shown in Table 7.4 for the changes of the coastal phytobenthos structure coincided with the changes in Cystoseira and Phyllophora phytocoenoses in the less eutrophic offshore waters of the northwestern shelf as well. They comprised the background state from the late 1950s to the early 1970s; degradation state from the mid-1970s to the late 1980s; negative changes from the late 1980s to the early 1990s; partial restoration state towards the 1950s after the mid-1990s (Milchakova, 1999). At present, restoration of Cystoseira phytocoenoses has been limited to the shallow water (1-3 m) coastal zone in open areas (Cape Aya, Cape Sarych, Karadag) and in embayments and bays (Sevastopol Bay, Karkinitsky Bay) as evident by their increasing species diversity and shares of edificatory species (large, perennial species). Cystoseira and Phyllophora occupied 7.42 and 1.62 km�� area with stocks of 9200 and 993 tones, respectively, in the Sevastopol Bay (Milchakova, 2003b). The stocks of Gracillaria verrucosa (Huds.) Papenf., G. dura (Ag.) J. Ag. in Kasachya and Novorossiskay embayments of the Crimean coast also made up 55 and 42 tonnes, respectively (Mironova, 2005).
An improvement of ecological conditions can also be seen in seaweed distributions in deep waters. For instance, congestions of green filamentous algae Cladophora sericea (Huds.) Kutz. were found in the southwest Crimea shelf at the depth range of 40-100 meters in spring 2004 (Boltachev and Milchakova, 2004). The green lamellar algae Ulva rigida Ag. was recorded at 35-60 meter depth range in autumn 2005. Even the coastal ecosystem of the Danube-Dnepr interfluve which has been greatly subject to eutrophication started producing some macrophyte development at depths from 5-7 to 12-14 m in 2005-2007.
Table 7.4. The periods of alteration of community structural-functional organization for the macrophytobenthos of northwestern part of the Black Sea.
| Stage | Period | Main characteristics |
| Pre-eutrophication state | Before the1960s | Dominant of communities ����� a large perennial brown alga Cystoseira barbata with a low specific area (S/W ����� 12 m���·kg-1). Multilayer complex communities with average biomass of 3-5 kg�·m-��. |
| IntensifiedEutrophication | From the early 1970s to the 1980s | Species with S/W lower than 15 m���·kg-1 ceased developing C. barbata succeeded the algal community of the genus Ceramium, Cladophora, Enteromorpha. The phytobenthos biomass fell to 1.0-1.5 kg�·m-��. The S/W index of the floristic algae composition increased more than two-folds. |
| Immobility | Mid-1990s | Mass development of species of aliens and previously rare species (Desmarestia viridis, Polysiphonia sunguinea) with S/W ~ 70 m���·kg-1. |
| DecreasingEutrophication | The present decade | The red algae Polysiphonia elongata (S/W ����� 26.88 m���·kg-1) has intensively widened its range, as a step towards restoration of the macrophytobenthos structure. |
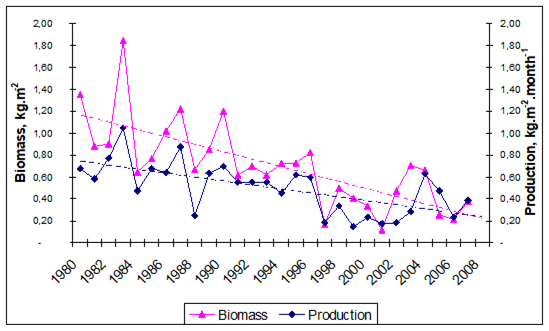
Fig. 7.2. Annually dynamic of biomass and production of macrophytes community of Danube-Dnepr interfluves.
7.3. Romanian shelf area
Long term changes (1950-2005): Macrophytes in the Romanian coast until the 1970s comprised 154 species (47 Chlorophyta species, 2 Xanthophyta, 30 Phaeophyta, and 79 Rhodophyta) that have been identified as early as 1935 by Celan (1935). They decreased gradually to 86 species in 1970s (Bavaru, 1981), 55 in the 1980s and 31 in the 1990s as depicted in Table 7. 5.
Table 7.5. Number of macroalgal species at the Romanian coast, between 1977 and 2005 by different authors
| Phyllum | 1977(1) | 1976-1995(2) | 1996-2005(3) |
| Chlorophyta (green algae) | 31 | 22 | 16 |
| Phaeophyta (brown algae) | 14 | 9 | 5 |
| Rhodophyta (red algae) | 41 | 24 | 10 |
| Total | 86 | 55 | 31 |
Data sources: (1) Bavaru (1981), (2) Vasiliu (1984), (3) Bologa and Sava (2006).��
The cold winter of 1971-1972 represented a special situation in which drifting ice mechanically destroyed benthic vegetation up to 2-3 m of depth. 80% of the loss of the perennial brown algae Cystoseira barbata stocks was the result of this particular phenomenon. Silt and nutrients from coastal human activities aggravated the unsuccessful macrophytes stocks rehabilitation. Cystoseira continued to be present only in the form of small aggregations mostly in the southern part of the Romanian shore because of the weaker influence of the Danube River in this region. Epiphytic flora and associated fauna also decreased, and as a result perennial algae damaged considerably. The almost complete disappearance of extended belts of Cystoseira had important ecological implications in terms of forming as a substratum and shelter for various other epiphytic macrophytes and animals, especially fish. The disappearance of numerous brown and red algae was mainly related to the depletion of those Cystoseira fields. Phyllophora is a perennial algae, dominant in the famous ���œZernov�����s field���� (Skolka, 1956), nowadays being present only as scattered islands in the northern Constanta area.
Considerable diminution of phanerogames Zostera marina and Z. nolti (eelgrass) was also observed in former decades. In the last 30 years the standing stock of eelgrass has decreased tenfold in shallow water. Eelgrass served as a favourable biotope for many species of invertebrates and fish. The main reason for the degradation of Zostera communities was the mobilizing of silt when dredging in the coastal zone. These impoverishments in macrophyte community were noticed in many rocky bottom areas (Celan, 1977; Celan & Bavaru, 1973, 1978; Skolka et al., 1980; Bavaru, 1970, 1981; Bavaru and Vasiliu, 1985; Bologa, 1989; Sava et al., 2003) and led to the present decrease of biodiversity in the north-western Black Sea (Bologa, 2002; Bologa et al., 1995).
Hard substratum, earlier populated by slow developing brown alga Cystoseira, was then covered by short life cycle species with fast growth. Most frequent species are Enteromorpha, Cladophora and Ceramium, followed by Ulva, Bryopsis and Callithamnion but their biomass is not comparable with high biomass of Cystoseira in the last decades (Sava, 1999). Most obvious feature of macrophytes community in 1990s was low number of species at the Romanian shore, but they could produce high biomasses, some genera (Enteromorpha, Cladophora, Ceramium) covered 80% of the bottom (Bologa, 1989). An average of 6 kg/m2 wet biomass has been measured in 2004, proportion of green algae being higher in the north, red algae predominating towards the south of the Romanian coast (Sburlea and Mircea, 2006).
Due to large amount of suspended particles and plankton, the transparency of sea water was significantly decreased in 2005 compared to 1980s. The position of the compensation depth changed as a result, and bottom seaweeds growing deeper than 7 to 8 m became shaded (Bologa and Sava, 2006). The latter accounted for the large decline of macrophytes, in spite of the high nutrients levels. The changes of the ecosystem and community structure led to the replacement of some phytocoenoses by others. The consequence was a shift in the seasonal and multiannual dynamics of the algal communities.
As a result of biological pollution, the exotic and toxic species Desmarestia (Phaeophyta) has been observed along the Romanian shore in 2004 and 2005. First recorded in 1992, this particular species has already populated hard substrates of the Odessa harbour and is considered toxic for the neighbouring algae. At present, the rehabilitation of macrophytes community is delayed by secondary eutrophication and human activities such as harbour constructions, industry, and tourism.
With respect to the categories proposed by the World Conservation Union (IUCN) and considering national concerns regarding endangered species, a comprehensive red list of extinct and endangered, rare and insufficiently known benthic macrophytes from the Romanian Black Sea sector has been compiled (Bologa and Bavaru, 1998/99). The list comprised 24 extinct and endangered species (6 Chlorophyta, 6 Phaeophyta, and 12 Rhodophyta), 42 rare species (13 Chlorophyta, 2 Xanthophyta, 9 Phaeophyta, 18 Rhodophyta) and 4 insufficiently known species (1 Phaeophyta, 3 Rhodophyta).
Peculiarity of macrophytobenthos during 1990-2005: Along the Romanian Black Sea shore, the compact, discontinuous and variable rocky bottom characterizes the supra-, medio-, and infralittoral between Cape Midia (440 20����� N) and Vama Veche (430 45����� N). This substratum constitutes the most varied environment of the benthic domain. During the decades, this benthic zone has shrunk to a narrow inshore strip at the depth of 5-7 m that comprised the only region with sufficient light penetrating within the water column for photosyntesis (Sava, 1999).
The inventory of benthic macrophytes along the Romanian shore in the last decade presents 33 species (Bologa and Sava, 2006): 16 Chlorophyta, 10 Rhodophyta, 5 Phaeophyta and 2 Phanerogama. Usually, Enteromorpha species are mixed with species of Cladophora. Occasionally Bryopsis plumosa (in the warm season) and Entocladia viridis (endophyte in the cellular membranes of Ceramium species) have been observed. After the green algae belt, starting with low depths up to 8 to 9 m were covered by the species of Ceramium. They occupy almost all substrata, contributing with Enteromorpha, to the physiognomy of the present vegetation. Polysiphonia, Callithamnion and Porphyra constituted other common species at lower quantities during various seasons of the year.
There is, however, a clear quantitative and qualitative difference between the macrophyte community of the northern and southern littoral zones of the Romanian coastline (Fig. 7.3). Reduced hard substratum suitable for macrophytes development and more intense pollution caused much lower macrophyte community along the northern Romanian littoral zone. Suspensions in large quantities negatively affected light penetration in the water body and seed germination.
Half of macrophytes species encountered on the Romanian shore at 2 to 4 m depth exist also as epiphytes on Cystoseira developing interstitial spaces suitable for zoobenthos settlement and creating a complex trophic chain (Sburlea and Bologa, 2006). Considering this influence on benthic communities, Cystoseira is ranked as key species.
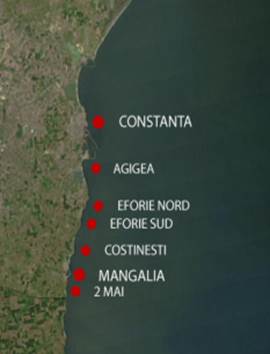
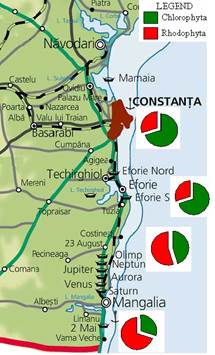
Fig. 7.3. Location of sampling stations along the Romanian Black Sea coast during 2000-2005 observations (left) and quantitative proportion of red and green algae along the Romanian Black Sea shore (right).
Some species that were considered as disappeared until recently such as Lomentaria clavellosa (Rhodophyta), were found recently in ���œ2 Mai�����Vama Veche���� Marine Reservation area, thus making this species easier to monitor and protect. A few thalli of exotic brown alga Desmarestia was observed as stranded to shore but it is not known if they were carried by coastal currents from the north or it was growing on Romanian shelf (Environmental State Report - NIMRD).
Nowadays biomass values are much lower compared with previous published data. High values of macrophyte biomass were found at depths of 2-3 m where there was still enough light and the physico-chemical conditions were relatively good (Sava, 1999). Hard substratum, earlier populated by community of brown alga Cystoseira, is now covered by Enteromorpha, Cladophora and Ceramium, seasonal macrophytes with short life cycle. Their mass development led to a homogenization of benthic communities on extended areas but their biomass is not comparable with high biomass of Cystoseira (Sava, 1999). Starting with 1990, in spite of diminished number of species, a trend of quantitative recovery of Chlorophyta (green algae) and Rhodophyta (red algae) that are more tolerant to eutrophication has been registered on several beaches between Mamaia (in spite of sandy bottom) and Vama Veche.
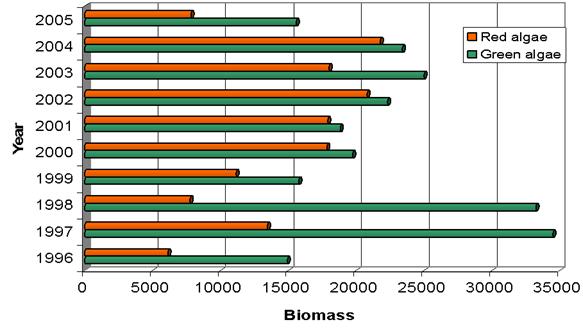
Fig. 7.4. Annual evolution of biomass (g∙m-2) of green and red algae along the Romanian littoral between 1996 and 2005 (Bologa and Sava, 2006).
The research carried out during 2000-2005 at seven sites between Constanta and 2 Mai both in warm and cold seasons suggested that the new algal communities consisted of very small number of species of mostly green, red algae and brown algae. The perennial associations of the past have declined and the substratum previously populated by Cystoseira is now covered by opportunistic species with a short life cycle and rapid growth. The evolution of biomass since 2000 (Fig. 7.4) showed that green algae were dominant and comprised by the species belonging to the genera Ulva, Enteromorpha and Cladophora that develop all year round, together with Ulothrix and Urospora that develop only during the cold season (spring and autumn). Its maximum development took place in 2003 (25,000 g/m2), but similar values were also registered in 2002 (22,310 g/m2) and 2004 (23,410 g/m2). In 2005, a significant decrease of Chlorophyta biomass was evident; its total value (15,581 g/m2) was almost half of the 2003 value. The red algae acquired the maximum biomass (21,722 g/m2) in 2004 with slight differences to previous years, whereas its biomass reduced more than half of its value in 2000. They were dominated by the species of Ceramium, found on rocky bottom during the entire year due to its high capacity of both asexual and sexual reproduction. During spring, Porphyra and sometimes Polysiphonia and Callithamnion contributed to the total red algae biomass. The latter two species were found in appreciable quantities in samples only in the warm season. The reduction in biomass of both green and red algae in 2005 could be related to the improvement of the state of the ecosystem along the Romanian shore and could have beneficial consequences on the whole algal vegetation.
7.4. Bulgarian shelf area
The long-term observations in the Varna Bay region indicated a decreasing trend of macrophyte species in general and of oligosaprobic species in particular in response to increased level of eutrophication (Dimitrova, 1978; 1996) as summarized in Tables 7.6 and 7.7. The total loss of macrophyte species accounted for more than half as compared to the first half the last century, particularly in the Rhodophyta and Phaeophyta species (Table 7.6), whereas Chlorophyta species increased by 50% during the same period. For example, the average biomass of the Phaeophyta species Cystoseia barbata was estimated as 7 kg.m-2 in 1966-1969 with respect to 1.1kg.m-2 in 1997 up to 2 m depth. It was mostly substituted by Enteromorpha intestinalis, Cladophora vagabunda, Ceramium rubrum.
Table 7.6. Changes in species structure of different types of macrophytes in Varna Bay.
| Type | 1904-1939 | 1962-1972 | 1994 | 1999 | 2001 | 2002 |
| Chlorophyta | 10 | 9 | 13 | 13 | 13 | 15 |
| Phaeophyta | 11 | 6 | 4 | 3 | 4 | 4 |
| Rhodophyta | 37 | 23 | 14 | 8 | 11 | 8 |
| Total | 58 | 38 | 31 | 24 | 28 | 27 |
Table 7.7. Changes in saprobic structure of macrophytes in Varna Bay in the years of investigation.
| Period | 1904 ����� 39 | 1969-72 | 1994 | 1999 | 2001 | 2002 |
| Oligosaprobic | 37 | 23 | 3 | 3 | 3 | 3 |
| Mesosaprobic | 16 | 11 | 21 | 13 | 18 | 17 |
| Polysaprobic | 5 | 4 | 7 | 8 | 7 | 7 |
In terms of saprobic structure of macrophytes in Varna Bay, major loss occurred in oligosaprobic species which became almost extinct since the 1990s (Table 7.7). Typical oligosaprobic species such as Ralfsia verrucosa, Stilophora tuberculosa, Nereia filliformis, Dictiota dichotoma, Cladostephus verticillatus were not registered during the last two decades in this region. The most dominant species, in terms of their biomass, are the polysaprobic and mesosaprobic species such as Ceramium rubrum, Callithamnion corrymbosum, Enteromorpha�� intestinalis, Ulva rigida, Bryopsis plumosa. This floristic structure was similar to the Odessa Bay further north (Minicheva, 1998).
In 1994, the macrophytobenthos along the Bulgarian Black Sea coast was found to contain 157 species, which constituted 53% of the total Black Sea macroflora. They belonged to 82 genera, 43 families and 25 classes of Rhodophyta, Phaeophyta and Chlorophyta. The first group was the richest with about 55% of all species, followed by the rest with approximately even number of species (Table 7.8). In comparison with the Russian (75%), Romanian (40.7%) and Turkish coast (24%), the Bulgarian Black Sea coast ranked second regarding to macroflora species diversity (Kalugina-Gutnik, 1975).
The comparison of the floristic indices of macrophytobenthic coenoses for 1904-1972 and 1994-2002 periods may be used to assess the level of eutrophication along the Bulgarian coast (Table 7.9). The floristic index increases with enhancement of the level of eutrophication.�� For example, in Varna Bay being the most eutrophic part of the Bulgarian coastline, it was increased from 4.3 during 1904-1939 to 5.3 in 1969- 1972 and to more than 6.0 in the 1990s and the present decade. In 1994, the lowest floristic index was in the Cape Maslen and the highest in Kavarna (P=7.5), followed by Varna Bay (P=6.5) (Table 7.9). It acquired intermediate values for Irakly and Zelenka (P= 5.0) and for Bjala and Balchik transects (P= 6.0).
��Table 7.8. Bulgarian and Black Sea macroalgae taxonomic composition.
| Regions | Group | Order | Family | Genus | Species |
| Bulgarian coast | Rhodophyta | 8 | 18 | 39 | 86 |
| Phaeophyta | 10 | 16 | 26 | 37 | |
| Chlorophyta | 7 | 9 | 17 | 34 | |
| Total | 25 | 43 | 82 | 157 | |
| Black Sea | Rhodophyta | 8 | 23 | 61 | 142 |
| Phaeophyta | 11 | 25 | 46 | 77 | |
| Chlorophyta | 7 | 14 | 36 | 74 | |
| Total | 26 | 62 | 143 | 293 | |
Table 7.9. Comparison of floristic indices along the Bulgarian coastline.
| Transect | Floristicindex (P) | SaprobicIndex (X) |
| Cape Maslen | 3.6 | 1.170 |
| Zelenka | 5.0 | 0.330 |
| Irakly | 5.0 | 0.350 |
| Bjala | 6.0 | 0.285 |
| Balchik | 6.0 | 0.280 |
| Varna Bay | 6.5 | 0.220 |
| Kavarna | 7.5 | 0.176 |
The values of saprobic index that decreased with enhancement of the level of eutrophication also indicated high eutrophication tendency along the Bulgarian coast in 1994. The highest saprobic index value was estimated for Cape Maslen (X=1.17) and the lowest one for Kavarna (X=0.176), followed by Varna Bay (Table 7.9).�� They are consistent with the highest values total macrophytes biomass in the Cape Maslen (4184.18 g∙m-2) and the lowest level in Kavarna (1367.15 g∙m-2) and Varna Bay (1413.65 g∙m-2) at 5 m depth (Fig. 7.5). Irakly and Zelenka (X=0.35, X=0.33), Bjala and Balchik (X=0.285, X=0.28) have been identified by intermediate saprobic index values and hence intermediate level total macrophytes biomass. The biomass distribution from different types of algae was characterized by the following peculiarities. The highest biomass of brown algae was registered in the Cape Maslen�� (2320.07 g.m-2 ), it was 1.1 lower at Zelenka, 2.3 fold lower in Bjala, 22 times lower in Varna Bay, and it was of significant value in Kavarna. The highest biomass of Chlorophyta (1785.16 g.m-2) and Rhodophyta (616.28 g.m-2) representatives was estimated in the Bjala transect (Fig. 7.5). Phaeophyta prevailed�� in the Cape Maslen and Zelenka, and Chlorophyta in Varna Bay, Bjala and Kavarna (Fig. 7.5).
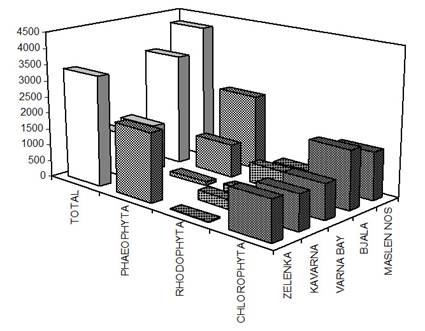
Fig. 7.5. Biomass distribution of macrophytes along the investigated transects in 1994.
The low biomass of Phaeophyta (Brown algae) species Cystoseira is considered as a reliable indicator for the estimation of the level of eutrophication. It was registered in greater values in the Cape Maslen area (2320.07 g∙m-2) where it constituted 55.4% of the total biomass whereas only 7.5% in more eutrophic Varna Bay region. On the contrary, the mass development in biomass of the Chlorophyta species Ulva rigida, Enteromorpha intestinalis and the Rhodophyta species Ceramium rubrum and Callithamnion corimbosum is an indication of increased content of organic matter and nutrients, and hence eutrophication (Kalugina-Gutnik, 1975; Bologa, 1989; Minitcheva, 1990). They were dominant in Varna Bay as identified by Ulva rigida (max. biomass 1913.7 g∙m-2), Enteromorpha intestinalis (2287 g∙m-2), Ceramium rubrum (312.5 g∙m-2), Callithamnion corimbosum (624.8 g∙m‑2).
The highest percentage of oligosaprobic algae and the values of saprobic and floristic indices therefore indicated a lower eutrophication level in the Cape Maslen in comparison with the other investigated areas along the Bulgarian coast. The highest level of eutrophication was detected in Varna Bay and Kavarna as further confirmed by low biomass of macrophytobenthos. Zelenka, Balchik, Bjala, Irakly characterized moderately eutrophic regions.
A direct relation exists among the nutrient loading, increasing phytoplankton growth, restricted light penetration and reduction of macroalgae biomass (Hough et al., 1989). In support to this, our results showed that the bulk of biomass in the Cape Maslen area spread at 5m depth. It was 6 times higher than that in Varna Bay due to permanent blooms of phytoplankton and high level of eutrophy. Besides, the highest biomass of Cystoseira (2320.07 g∙m-2), preferring waters with low nutrient loading, was registered in the Cape Maslen area, compared with the other regions, especially Varna Bay and Kavarna.
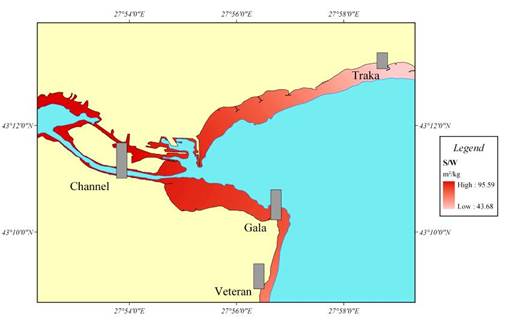
Fig. 7.6. Average multi-annual specific surface values ( m2.kg-1 ) along the Bulgarian coastline during 1999-2002.
The floristic composition of plant communities along the Bulgarian coast in 1999-2002 can be divided into three categories according to their specific surface values: under 10 m2∙kg-1 (indicating lower eutrophication), from 10 to 30 m2∙kg-1 (indicating intermediate level eutrophication), and over 30 m2∙kg-1 (indicating higher eutrophication). It should be noted that a high specific surface value corresponds to a macrophyte biomass and indicates a higher eutrophication level. According to this classification, in Trakata, 33% belong to macrophytes with specific surface from 10 to 30 m2.kg-1 and 67% belong to macrophytes with specific surface value over 30 m2∙kg-1 (species with specific surface value under 10 m2∙kg-1 are not registered). Traka therefore represented the least eutrophic zone with respect to the other regions. Its average specific surface value for 1999-2002 is 43.68 m2∙kg-1 (Fig. 7.6). The most eutrophicated zone turns out to be the channel between the Varna Bay and its lake in which 92% belong to species with specific surface value over 30 m2∙kg-1 (the mean value = 95.79 m2∙kg-1). It is followed by Galata (83%), Veteran and (72%). Accordingly, the 1999-2002 average value of macrophyte biomass along the coast decrease from Trakata (911.8 g∙m-2) to Veteran (613.83 g∙m-2), Cape Galata (512.7 g∙m-2) and the channel (484.6 g∙m-2) (Fig. 7.7).
The major change during the recent years was biomass decrease of Cystoseira (species indicator of high quality waters) in the Varna Bay. This olygosaprobic macrophyte with low specific surface and big size is replaced by other polysaprobic species such as Cladophora, Enteromorpha, Ceramium with higher specific surface, especially in more eutrophic areas (Dencheva, 1994).
The calculated macroalgal production is highest in Trakata and the Channel regions. The high values in the channel are due to presence of species with high specific surface and intensity of functioning and short life cycle and biomass. The high production in Traka is because of the presence of Cystoseira (high biomass, low specific surface).
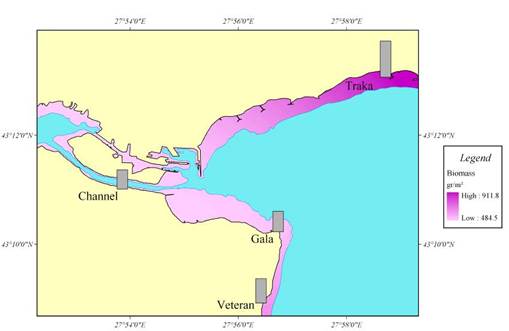
Fig. 7.7. Average multi-annual biomass values (g.m-2) along the Bulgarian coastline during 1999-2002.
7.5. Turkish shelf area
���������� A detailed account of the early algal records along the Turkish coast of the Black Sea (Fig. 7.8) is given by Aysel et al. (1996; 2000, 2004; 2005), Erdugan et al. (1996). 25 macroalgal taxa were reported in Trabzon coastal waters and 21 macroalgal taxa at Sinop and its vicinity (central zone), 55 taxa along the coast of Trabzon and 88 taxa between Rize and Sarp in the southeastern part of the Black Sea, 210 taxa at Bartin and 205 taxa at Zonguldak (western zone) belonging to four algal classes (Cyanophyceae, Rhodophyceae, Phaeophyceae and Chlorophyceae).�� In total, 258 taxa were identified in the Turkish Black Sea region, from five classes: Cyanophyceae with 13 species, Rhodophyceae with 140 species, Phaeophyceae with 53 species, Chlorophyceae with 50 species and Charophyceae with 2 species. With new additions of algal taxa, this number increased later to 297 by Aysel et al (2004). The list of algal taxa and macrophytes along the Turkish coast of the Black Sea is given in Table 7.10, and their relative dominancy is given in Table 7.11.
Conservation biology and threats: There have been dramatic changes in the southern Black Sea ecosystem as a result of eutrophication caused by increased nutrient input via major northwestern rivers and industrial and harbour activities in recent years.�� Abnormal changes due to altered nutrient balance were reflected in the qualitative and quantitative composition of phytoplankton, zooplankton and ichthyofauna (Bat et al., 2007). These changes also included the loss of extensive areas of seagrass meadows, a virtual collapse of the benthos over the shelf area and mass mortalities due to hypoxia. The dredging of sand from the sea has also been destroying the habitats along the Turkish Black Sea coast (���zt��rk, 1998). In addition, the highway construction along the coastline harmed the macroalgae and macrophyte communities (Aysel et al., 2005).
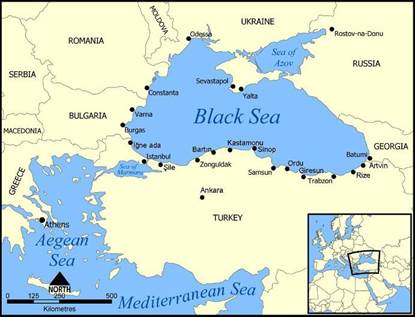
Fig. 7.8. Map for the coastal regions along the Turkish coast of the Black Sea.
Table 7.10. Benthic algae and macrophytes diversity from different areas in the Black Sea coast of Turkey (Aysel et al., 2005).
| Regions | Seaweeds | Macrophytes | ||||
| Cyano-phyta( CY) | Rhodophyta (R) | Phaeophyta (O) | Chlorophyta (C) | Magnoliophyta | ∑ | |
| Kirklareli | 23 | 71 | 24 | 30 | 3 | 151 |
| Kocaeli, Sakarya, D��zce | 30 | 126 | 50 | 46 | 3 | 255 |
| Zonguldak | 20 | 100 | 42 | 43 | 3 | 208 |
| Bartin | 12 | 116 | 43 | 39 | 3 | 213 |
| Kastamonu | 22 | 133 | 56 | 48 | 3 | 262 |
| Sinop | 22 | 136 | 52 | 55 | 3 | 268 |
| Samsun | 20 | 106 | 27 | 22 | 3 | 178 |
| Ordu | 14 | 93 | 27 | 26 | 4 | 164 |
| Giresun | 18 | 109 | 33 | 30 | 3 | 193 |
| Trabzon | 1 | 23 | 8 | 23 | 3 | 58 |
| Rize, Artvin | 3 | 43 | 15 | 27 | 3 | 91 |
| Total | 30 | 142 | 57 | 58 | 4 | 297 |
Table 7. 11. Dominancy in division level among of Black Sea coast of Turkey (Aysel et al., 2005).
| Regions | Division | |||||
| R/O | R/C | R/CY | O/C | O/CY | C/CY | |
| Kirklareli | 3.00 | 3.70 | 3.10 | 0.80 | 1.00 | 1.30 |
| Kocaeli,Sakarya, D��zce | 2.52 | 2.73 | 4.20 | 1.08 | 1.66 | 1.53 |
| Zonguldak | 2.40 | 2.30 | 5.00 | 1.00 | 2.10 | 2.20 |
| Bartin | 2.70 | 3.00 | 9.70 | 1.10 | 3.60 | 3.30 |
| Kastamonu | 2.37 | 2.77 | 6.04 | 1.16 | 2.54 | 2.18 |
| Sinop | 2.60 | 2.50 | 6.50 | 0.96 | 2.50 | 2.59 |
| Samsun | 3.92 | 4.81 | 4.30 | 1.22 | 1.35 | 1.10 |
| Ordu | 3.44 | 3.58 | 6.64 | 1.04 | 1.93 | 1.86 |
| Giresun | 3.30 | 3.63 | 6.05 | 1.10 | 1.83 | 1.66 |
| Trabzon | 2.90 | 1.00 | 23.00 | 0.30 | 8.00 | 23.00 |
| Rize, Artvin | 2.90 | 1.60 | 14.3 | 0.60 | 5.00 | 9.00 |
Seagrasses (Magnoliphyta)
The seagrasses (Magnoliphyta) patchy distributed sandy and muddy substratums of the coast of Turkish coastal zone. According to Milchakova (1999), six species have been occured in the Black Sea. These are Zostera marina (eelgrass), Z. noltii, Potamogeton pectinatus, Ruppia maritima, R. spiralis and Zannichellia major. Among these, Z. marina (eelgrass), Z. noltii, Potamogeton pectinatus and as differently Cymodocea nodosa reported from Turkish Black Sea coast (G��nl��g��r-Demirci & Karakan, 2006). Generally the vertical distribution of Zostera beds in the Turkish self area is mainly between 0.7 m and 6 m but low-density patches can grow down to 17 m. Zostera meadows are an important source of food and shelter for the juvenile stages of many fish and crustacean species The network of roots and leaves in a Zostera bed provides ecological nichs for a wide range of associated with fauna and flora, so that the biotopes are important in maintaning coastal biodiversity. These beds exhibit high rates of primary productivity and are an important source of organic matter, fuelling detritusbased food chains within the biotope (Bostr��m and Bonsdorff, 1997). The distribution of Zostera spp. meadows at the Turkish coastal zone was patchy, forming mosaic patterns with other phytobenthic and zoobenthic species (Ceramium spp., Cladophora spp., Ulva spp., Polysiphonia sp., Potomageton pectinatus, Botryllus schlosseri, and serpulid polychaets). (unpublished data). Seagrass constitute of an important part of the Black Sea coastal zone. They have still received much less attention than the other systems in terms of research and management. In Turkey, as in other Black Sea countries, the negative impact on the seagrass ecosystems is increasing due to a growing coastal population, pollution, and overexploitation of resources. Sinop region is an example of an area strongly influenced by overfishing, illegal bottom trawling, verified by local fisherman complaining on diminishing catch rates.
Consequently, to increase the present scientific knowledge on ecological interactions such as between fish and invertebrate assemblages, and seagrass environments of the region is important.
7.6. Northeastern (Russian) shelf area��
Floristic composition: In the 1970s, the floristic richness of marine algoflora along the northeastern Black Sea coast comprised 146 macroalgae species: 33 Chlorophyta, 35 Phaeophyceae, 78 Rhodophyta (Kalugina-Gutnik, 1975). The studies performed during 1999-2007 identified 143 macroalgae species: 41 Chlorophyta, 29 Phaeophyceae, 73 Rhodophyta (Fig. 7.9). Only 39 of them (10 Chlorophyta, 7 Phaeophyceae, 22 Rhodophyta) had 100% frequency of occurrence, the others were registered only 1-3 times.
The important difference between the 1970s and the 2000s is the increase of Chlorophyta and simultaneous decrease of Phaeophyceae species, such as Grateloupia dichotoma, Dasya baillouviana, Gracilaria verrucosa, Eupogodon apiculatus (=Dasyopsis apiculata). It is noteworthy to point out that none of the widely spread species of Phaeophyceae has disappeared from the regional flora, though the majority of them belongs to oligosaprobic forms. Two brown algae, Arthrocladia villosa and Halopteris scoparia, were noted to be absent in 1999-2000. However, Halopteris was later found in the vicinity of Gelendzhik in 2001, and Arthrocladia at the Maria Magdalena Bank in 2002 (Maximova and Mitjaseva, 2003; Mitjaseva et al., 2003). In June 2003 Gracilaria appeared near Gelendzhik and in Inal Bay, and the real outbreak of this alga took place near Golubaja Bay at the depth of 7-9 m in July 2003. There were approximately 10 large thalli (up to 30 cm high) per square meter (A.A. Georgiev, M.I. Georgieva, pers.com).
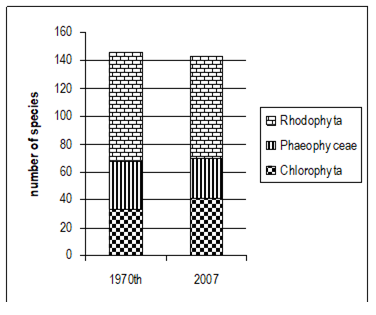
Fig. 7.9. Taxonomic composition of North Caucasian bottom algoflora in the 1970s (Kalugina-Gutnik, 1975) and the present decade.
In parallel to floristic depletion, a lot of new species have penetrated to the North Caucasian marine flora from the other regions of the basin: two Ulothrix species, Ulvella lens, Pringsheimiella scutata, Entocladia (= Ectochaete) leptochaete, Cladophora siwaschensis (Chlorophyta); Pylaiella littoralis, Cladostephus spongiosus f. spongiosus, Myriotrichia clavaeformis (= M. repens) (Phaeophyceae); Goniotrichum elegans, Kylinia microscopica, Acrochaetium daviesii, A.savianum, Compsotamnion gracillimum, Polysiphonia fucoides (= P. nigrescens) (Rhodophyta) and some others. Most of them are the endophytes, micro-epiphytes and filamentous forms.
Some species that have been considered to be rare in 1950-70s nowadays are widely spread along the North Caucasian coast. Among them are Chaetomorpha gracilis, Cladophora vadorum, Cladophoropsis membranacea (Chlorophyta), Callithamnion granulatum, Rhodochorton purpureum, Ceramium siliquosum var. elegans (Rhodophyta) and others. Thus, the changes took place not only in the floristic composition but also in the regional status of many species.
Bathymetric distribution and community structure of bottom vegetation: In the middle of 20th century, the most abundant member of bottom flora was Cystoseireta that stretched from 0.5 m to 20 m, in some places even to 35 m (the Bolshoi Utrish cape). The Cystoseireta formation survived under unfavorable conditions in the 1980s-1990s (Fig. 7.10). At present, its biomass at the upper phytal zone (0.25-1 m) reached 13-15 kg/m2 in some places, and its average was about 3.5-5.0 kg/m2. But, lower boundary of Cystoseireta still stay at the depth of 10-12 m (Fig. 7.10); only isolated oppressed thalli of Cystoseira barbata can be noticed as deep as 12-15 m. Its biomass at the localities deeper than 5-6 m usually is not higher than 150-300 g/m2. Overall standing stock of both Cystoseira species was about 2 million tones and their annual primary production was up to 4.4 million tones. The Cystoseira communities included more than 120 species of other macroalgae. At the lower horizon of the phytal zone (18-28 m) the formation Phyllophoreta has been replacing the Cystoseira community, and formations Polysiphonieta (25-50 m) and Antithamnieta (45-70 m) have been usual and widespread along the northern shore of the Black Sea (Kalugina-Gutnik, 1975).
The northeastern Black Sea region produced nearly a half of the Black Sea Cystoseira stock in 1960-70s that was about 980 thousand tons (Kalugina-Gutnik, 1975). The contemporary Cystoseira stock in the region was, however, estimated to reduce to 100 thousand tons (Maximova and Moruchkova, 2005; Vilkova, 2005), but this value may be an overestimate due to very low biomass in deep phytal zone. The biomass of the leading species usually formed about 60% (from 30% up to 95%) of the total community biomass; hence the total stock of the regional macrophytobenthos would be no more than 160-170 thousand tons. Thus, it may be postulated that nearly ten-fold drop of the macrophyte biomass occurred along the North Caucasian coast during last 30 years. Needless to say, its commercial exploitation is not economically feasible any more.
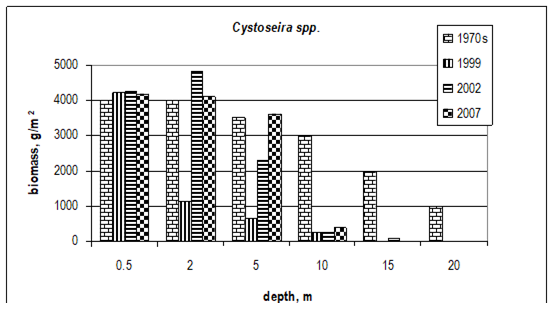
Fig. 7.10.�� Cystoseira biomass dynamics (1970s: Kalugina-Gutnik, 1975)
In the 1960s, the Cystoseira belt off the North Caucasian coast was as wide as 1.5 ����� 3 km (Kalugina-Gutnik, 1975). Now it is not wider than 300 m, usually about 100 m due to the structural (age, size, biodiversity, etc.) and functional (productivity, oxygen metabolism, bioconcentration) changes due to heavy eutrophication (Kalugina-Gutnik, 1975; Khailov et al., 1992; Maximova and Kucheruk, 1999; Gromov et al., 2001b; Gromov, 2004; and others). Their early life stages were very sensitive to the nutrient enrichment and its subsequent effects of low transparency, high sedimentation, epiphytes etc. (Berger et al., 2003; Is���us et al., 2004; Bergstr��m, 2005). Nitrate enrichment showed a significant negative effect on the attachment rate and germination of Fucus vesiculosus zygotes. Germling survival was reduced by over 20% in moderate nitrate enrichment, and by over 50% in high nitrate and phosphate enrichment during the first 10 days of experiment (Bergstr��m et al., 2003). The intensive sedimentation reduced the survivorship for Fucus serratus embryos: under the 1 mm layer it dropped from 90% to 50%, and under 3 mm layer ����� to less than 10%. And what is especially significant: the ruinous effect of organically rich biodeposits was much higher than that of mineral sediment (Chapman and Fletcher, 2002); and the drop of water transparency after Mnemiopsis invasion was due to organic contamination, first of all.
Cystoseira germlings have not been observed deeper than 5 m from the late-1980s and to 2002. But, the annual appearance of numerous juvenile Cystoseira thalli was observed in intensively washed upper phytal zone during all these years. In 2000, the recruitment of juvenile Cystoseira was observed in some places. Maybe it was just the coincidence, but the year 2000 was the first year of suppressed Mnemiopsis activity and beginning of improvement of light and sedimentation conditions indicating an additional role of ��Mnemiopsis on Cystoseira beds.
The situation at lower phytal zone is even more dramatic. In the region between Gelendzhik and Novorossijsk, bottom vegetation was absent at depths greater than 20-25 m. Deep-sea formations of Polysiphonieta and Antithamnieta completely disappeared. As for Phyllophoreta, Phyllophora nervosa abundance dropped significantly at all levels of its bathymetric range. In the 1970s, the attached Phyllophora had formed a wide belt with the coverage up to 50-80% with the mean biomass about 1.5 kg/m2 and up to 4 kg/m2 in the thick beds along the coastline from Anapa to Novorossijsk (Kalugina-Gutnik, 1975). In the 1980s ����� early 1990s the coverage was as high as 30-40% and mean biomass was 1.5 kg/m2 (and up to 6 kg/m2 at some locations) at depths from 12 to 28-30 m in the vicinity of Gelendzhik (Maximova and Rybnikov, 1993).
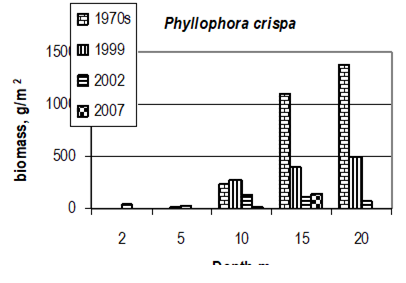
Fig. 7.11.�� Phyllophora biomass dynamics. Data source for 1970s: Kalugina-Gutnik (1975).
The investigations carried out in 1999-2007 in various points of the North Caucasian coast (Novorossijsk, Gelendzhik, Divnomorskoje, Inal Bay, Djubga, Arhipo-Osipovka, Tuapse) showed that the lower boundary of Phyllophora belt has shrunk by at least 10 m ����� to the depth of 15-20 m. One can now observe only rare small beds and single plants, the coverage is not higher than 15-20% and biomass rarely exceeds 0.3-0.5 kg/m2, being usually about some tens of grams. In 2006-2007 we noticed only single thalli of Phyllophora at the depth of 20 m in Gelendzhik region (Fig. 7.11). Thus, not only the community of Zernov�����s Phyllophora Meadow showed the catastrophic changes (Milchakova, 2001; Zaitsev, 2006), but also the near-shore populations off the North Caucasian coast. The lower phytal zone associations suffered most from the reduced transparency of coastal waters. Even sciophile Phyllophora crispa could not adapt itself to the narrowing of the photic zone. The similar situation was also observed along the Crimean coast. The Crimean bottom vegetation degraded deeper than 3 m, while there is a marked signs of macrophytobenthic rehabilitation in the upper phytal zone (Milchakova, 2001; Zaika et al., 2004).
As the result of Phyllophora degradation, the dominant structure of deep-sea communities also changed. The biomass of green noncellular algae Codium vermilara ��reached 4 kg/m2 with a density of 1500 sp/m2 at the depths of 10-15 m in 2001-2002. A similar situation took place for the brown crust-forming algae Zanardinia prototypus in 2002-2007. Its coverage increased by 60-80% at depths between 4 and 10 m. These events are called as the macroalgal ���œblooms���� as observed earlier for filamentous algae in intensively polluted areas, like Cladophora ���œblooms���� in Anapa Bay (Vershinin and Kamnev, 2001). These blooms were highly dynamic events with significant year-to-year variations. For example, although a lot of juvenile thalli were observed at the depth of 15 m no Codium ���œbloom���� was observed in 2003-2004 and the production of this alga returned its standard state and became one of the common but not a dominant species. The brown algae Halopteris scoparia has been rather abundant in 2001 in Gelendzhik region, but it has not been observed in following years, except a regular appearance in the vicinity of Tuapse. It may be quite likely that the periodic outbreaks of different species signify a gradual improvement of environmental conditions (e.g., illumination) after the invasion of Beroe ovata. Evidently, the temporarily deserted niches during the Mnemiopsis era started to be filled again but not necessarily by the same species.
In addition to the outbreaks of secondary species, the role of previous dominant species decreased simultaneously up to their disappearance. For example, the floristic composition belonged to the Cystoseira-Phyllophora association in the vicinity of Novorossijsk (Southern Ozereevka, depth 20 m) (Kalugina-Gutnik, 1975), but Cystoseira barbata was entirely absent indicating that the dominant algae group was removed from the association. The same association usually found in the depth range from 10-12 m to 15-18 m (e.g. Phyllophora crispa, Apoglossum ruscifolium and Cladophora dalmatica) also formed underwater bench at the depths of 2-5 m in sheltered regions in close proximity of deeper associations.
Maria Magdalena Bank: situation in clean waters: Macrophytobenthos transformation was also observed in Maria Magdalena Bank that was practically undisturbed and unpolluted region located in 5 km off Anapa coast. During the previous macroalgal investigations at the end of the 1950s, the bottom vegetation of the Bank was studied in the depth range from 2.8 m to 14.4 m, and 26 species of macroalgae were identified including 1 Chlorophyta, 13 Phaeophyceae, 12 Rhodophyta (Petrov, 1960, 1961a, b). After 45 years the algal samples collected at depths from 2 m to 30 m showed 41 species (11 Chlorophyta, 11 Phaeophyceae, 19 Rhodophyta) (Mitjaseva et al., 2003). The main difference in floristic lists was the pronounced increase in the number of Chlorophyta species. The high abundance of green algae was the evidence of brackish and/or eutrophicated waters. The equal quantity of green and brown species was the indication of mesosaprobiont community (Kalugina-Gutnik, 1975).
The next difference was the change of dominants: Cystoseira barbata has been the main alga in the 1950s but it was replaced by Cladostephus spongiosus f. verticillatus, distributed from 2 to 15 m in 2003. C. barbata was registered only twice with small quantities at the very top of the Bank (2 m depth). On the other hand, Cladostephus was not mentioned at all in the 1950s. Likewise, two new associations observed recently C.spongiosus f. verticillatus - Ceramium rubrum at the depth 2-5 m, and Arthrocladia villosa - Antithamnion plumula - Cladophoropsis membranacea - Bryopsis hypnoides at the depth 25-30 m have not been described earlier (Maximova and Moruchkova, 2005). Instead, the attached form of Phyllophora crispa that mainly inhabited the depth range from 8.4 to 14.4 m was found only at 2 m, and only with a few thalli at 15 m in 2003. Thus, these long-term macrophytobenthos transformations observed even at undisturbed localities imply that anthropogenic changes affected the Black Sea macrophytobenthos as a whole even at the opposite end of the sea to the western coast.
Algae of living animal substrata: Recent observations also showed the macroalgae populations attached to the shells of live mollusks Rapana venosa (Gastropoda), Chamelea gallina and Anadara inaequivalvis (Bivalvia) on the soft bottom of the Anapa region and the Gelendzhik Bay at depths from 5 to 20 m. The dead shells were often inhabited by macroalgae, even though mollusks did not demonstrate any sign of illness or damage. The total density of Chamelea reached 300 sp./m2, 10-30 of them bearing algae. The aspect of the association reminded the coloured clouds covering the bottom. The area of this association was wide enough to consider its primary production to be rather significant on the soft bottom.
Epiphytic sinusia and opportunistic species: The Cladophora vagabunda ���œbloom���� mentioned above is a striking example of r-species development in the Black Sea with its standing crop of 7500 tons in the area of 15 km2 in the Anapa Bay (Vershinin and Kamnev, 2000, 2001). Here the situation with the epiphytic sinusia will be discussed because of its noticeable changes during the last years. Its ecological role is high: about 80% of Black Sea benthic macroalgae are obligate or facultative epiphytes. At the beginning of the 1990s, epiphytic sinusia dominated in Cystoseira communities. In recent years, rich epiphytic flora, especially of red algae (Laurencia obtusa, L. coronopus, Chondria capillaries, Ceramium rubrum, C. secundatum, C. diaphanum, C. siliquosum var. elegans, Polysiphonia subulifera, Antithamnion cruciatum, Seirospora interrupta, Compsothamnion gracillimum etc) were observed but the quantitative characteristics of sinusia became much more spare. Even during their mass development at the end of summer the share of epiphytes in total community biomass did not exceed more than 30-35%. The epiphytic sinusia is more abundant (mainly owing to Ceramium species) at the upper phytal zone (1-2 m).�� The peak of its floristic diversity is marked at the depth of 2 m, but its contribution to the total community biomass is not high (3.5-5%). The species richness of epiphytes is lower (mainly Laurencia obtusa and Polysiphonia subulifera) at 5 m depth, but its biomass contribution rises up to 20-25%. At 10 m and deeper levels, the epiphytic sinusia is poor in both qualitative and quantitative aspects. For example, we have noticed 11 epiphytic species at the depths 0.5 m and 5 m, 17 ����� at the depth 2 m, and only 5 species at 10 m near Arhipo-Osipovka in 2001. In 2002 (the end of May ����� beginning of June), the real ���œbloom���� of epiphytic Chondrophycus paniculatus (= Laurencia paniculata) was observed in the vicinity of Golubaja Bay. This species was the seasonal dominant of epiphytic sinusia; its brightly yellow thalli masked basiphytic Cystoseira plants. Such high abundance of this species was never reported before. In 2003 (the end of June) the unusually high brown epiphytic Stilophora rhizodes (which had been rather rare in 2002 and earlier) and red Chondria capillaries were observed. They were so abundant (especially S. rhizodes) that nearly replaced the common dominants of epiphytic sinusia in Cystoseira associations - Polysiphonia subulifera and Laurencia obtusa. In 2003 P.subulifera was almost the rare component of sinusia, while L. obtusa was a slightly more abundant. These observations were held in Inal Bay, Golubaja Bay near Gelendzhik, in the vicinity of Divnomorskoje.
The changes in ecological and morphological properties of species: Under prolonged influence of eutrophication some algae have changed their properties. In particular, noticeable shifts occur in saprobic status of some algae populations. For example, oligosaprobic Padina pavonia and polysaprobic Enteromorpha intestinalis started growing in the mesosaprobic conditions; Gracilaria verrucosa and Chara aculeolata, inhabited the Gelendzhik Bay, one of the most polluted places along the shore (Maximova and Luchina, 2002). Apparently, high eutrophication became an environmental background which made the species to change their ecologic preferences. In the eutrophied environment, the morphology of the algae changed. Cystoseira, for example, lost the youngest branches (Khailov et al., 1992), and on the contrary Gracilaria verrucosa, Gelidiella acerosa intensified their branching (Rygalov et al., 1988; Mairh et al., 1990). Furthermore, two shallow-water ecological forms of Phyllophora nervosa appeared in the period of maximal eutrophication of coastal waters in early 1990s (Maximova and Rybnikov, 1993). During the present decade, the plants of the crispa morphotype were not noticed while the pennata form kept its abundance.
7.7. Conclusions
The major features of macrophytobenthos during the last several decades were decreasing species number, domination of small-size species with fast growth rate, decrease of community biomass, and reduction of Cystoseireta phytal zone to a narrow inshore strip shallower than 10 m which could only provide enough light for photosynthesis. As Cystoseira biomass decreased markedly, macroalgae blooms were dominated by opportunistic species (mainly epiphytic filamentous algae) in basiphytic and epiphytic sinusia.
Observations performed during the last 10 years indicated a restoration success of Cystoseira phytocoenoses in the coastal zone, weaker predominance of opportunistic species - mainly their epiphytic filamentous forms, with respect to 1980-90s, re-establishment of the Phyllophora-based community in the centre of the north-west shelf that has been formerly known to be Zernov�����s Phyllophora field. The main signature of restoration of Cystoseira and Phyllophora phytocoenoses was raising their species diversity with increasing moiety of large, perennial species and approximately two-fold decrease of the moiety of finely branched epiphyte species. However, no apparent recovery is yet evident at inshore locations close to the mouths of the Danube and Dniester. On the basis of 2004 observations, trophic status of the macrophytobethos along the western coast is classified as eutrophic, whereas the rest (the southern, Caucasian and Crimean) is mesotrophic. The Georgian coastal waters also fall into the eutrophic class.
Ongoing secondary eutrophication and human activities such as harbour constructions, industry, and tourism as well as anomalous climatic conditions led to establishment of different algal-dominated assemblages that adapted to the new conditions along coastal regions after the intense eutrophication state. At present, the macrophytes community structure is sensitive to the climatic changes and is dominated by either winter or summer species depending on the climatic conditions. The data tend to show a positive sign of recovery, but it is still difficult to mention a basin scale restoration of the macrophytobenthos community structure. Monitoring studies on the macroalgal flora should continue to follow likely ecological modifications of the macroalgal flora during its present transitional state.
References
Milchakova, N.A. 1999. On the status of seagrass communities in the Black Sea. Aquat. Bot. 65: 21-32.
G��nl��g��r-Demirci, G. and Karakan, I. 2006. Sinop kıyılarında (Orta Karadeniz) deniz ��ayırlarının Dağılımı. Fırat �œniv. Fen ve M��h. Bil. Dergisi, 18 (3):331-337.
Bostr��m, C. and Bonsdorff, E. 1997. Community structure and spatial variation of benthic invertebrates associated with Zostera marina (L.) beds in the northern Baltic Sea. J. Sea Res. 37: 153-166.
Adobovskiy V.V. and Bolshakov V.N. (2003) Influence of abnormal con��ditions of winter 2002�����2003 on a hydrological mode of the closed estuaries of northwest Black Sea Coast.�� Ecological safety of coastal and shelf zones and complex use of resources of a shelf: Proceedings of Works of Millennium, NAS of Ukraine MGI, OB IBSS, Sevastopol. 54-58.
Aysel, V., Erdugan, H., Sukatar, A., G��ner, H., ���zt��rk, M., (1996) Marine algae of Bartin. Tr. J. of Botany, 20, 251�����258 (in Turkish).
Aysel, V., Senkardesler, A., Aysel, F. (2000) Marine flora of Ordu (Black Sea, Turkey). SBT 2000-Reports, 61-69 (in Turkish).
Aysel, V., Erdugan H., Dural-Tarakci B., Okudan E. S., Senkardesler, A., Aysel F. (2004) Marine flora of Sinop (Black Sea, Turkey). E�œ Su �œr��nleri Derg. 21, 1-2, 59-68.
Aysel V., H. Erdugan, A, Dural-Tarakci, B., Okudan, E., S. (2005) Marine algae and seagrasses of Gresun Shores (Black Sea, Turkey). J. Black Sea/ Mediterranean Environment, 11(3),�� 271-285.����
Bat, L. Şahin, F., Satılmışş H.H., �œst��n, F., ���zdemir,Z. B., Kıdeys, A. E., Shulman, G.E. (2007) Karadeniz'in değişen ekosistemi ve hamsi balik��iliğina etkisi. Journal of Fisheries Sciences, 1(4), 191-227.
Bavaru A. (1970) Consideratii generale asupra gruparilor vegetale algale din partea de N-V a Marii Negre. Com. Hidrobiol. SSA, 27-35.
Bavaru A. (1981) Consideratii privind situatia actuala a vegetatiei algale macrofite de la litoralul romanesc al Marii Negre. Lucr. st. Inst. sup. Constanta, Biol., 97-101.
Bavaru A., Vasiliu F. (1985) La situation actuelle de la vegetation de macrophytes du littoral roumain de la mer Noire. Rapp. Comm. Int. Mer Medit, CIESM, Monaco, 29, 5, 205-206.
Berger R., Henriksson E., Kautsky L., Malm T. (2003) Effects of filamentous algae and deposited matter on the survival of Fucus vesiculosus L. germlings in the Baltic Sea. Aquatic Ecology. 37, 1-11.
Bergstr��m L. (2005) Macroalgae in the Baltic Sea ����� responses of low salinity and nutrient enrichment in Ceramium and Fucus. PhD Thesis. Ume�� University, Sweden. 38 pp.
Bergstr��m L., Berger R., Kautsky L. (2003) Negative direct effects of nutrient enrichment on the establishment of Fucus vesiculosus in the Baltic Sea, Europ. J. Phycol. 38(1), 41�����46.
Bologa A.S. (1989) Present state of seaweed production along the Romanian Black Sea shore. Vie et milieu Banyuls-sur-mer, 39, 2,105-109.
Bologa A.S. (2002) Recent changes in the Black Sea ecosystem. IOI Ocean Yearbook, 15,�� 463-474.
Bologa A.S., Bodeanu N., Petran A., Tiganus V., Zaitsev YU.P. (1995) Modificari in ecosistemele Marii Negre produse sub presiunea intensificarii eutrofizarii si poluarii. Analele Dobrogei, s.n., an 1, 1, 258-276.
Bologa A.S, Bavaru A. (1998-1999) Lista rosie a algelor macrofite bentale disparute si pe cale de extinctie, rare si insuficient cunoscute din sectorul romanesc al Marii Negre. Ocrot. nat. med. inconj., Bucuresti, 42/43, 23-32.
Bologa A.S., Sava D. (2006) Progressive decline and present trend of Romanian Black Sea macroalgal flora. Cercetari marine ����� Recherches marines, Constanta, (in press).
Boltachev A.R. and Milchakova N.A. (2004) About the reasons and possible consequences of flash abundances green seaweed�� (Cladophora sericea) on a shelf southwest Crimea in the spring 2004, Rybne gospodarstvo Ukraine, 5(34), 4-7.
Celan M. (1935) Notes sur la flore algologique du littoral roumain de la mer Noire. I. Sur les Cystoseira. Bull. Sect. Sci. Acad. Roumaine, 17, 81-94.
Celan M. (1977) Sur l�����appauvrissement de la flore algae des c�´tes roumaines de la mer Noire, Hidrobiologia, 15, 61-64.
Celan M. and Bavaru A. (1973) Aper��u g��n��ral sur les groupements algaux des c�´tes roumaines de la mer Noire. Rapp. Comm. Int. Mer M��dit., 21, 655-656.
Celan M., and Bavaru A. (1978) Sur l�������tat actual de la v��g��tation algale du littoral Roumain de la mer Noire. Cercetari marine-Recherches Marines, 11, 85-90.
Chapman A.S. and Fletcher R.L. (2002) Differential effects of sedimentation on survival and growth of Fucus serratus embryos (Fucales, Phaeophyceae). J.Phycol., 38, 894-903.
Dencheva K. (1994) Macrophytes- bioindicators of the water state in Varna���� bay. Marine sciences, 3, 235-239.
Dimitrova S. (1978) Geographical analysis of marine algae of Black sea in Acchtopol region. Phytology, BAS, 18, 22-35.
Dimitrova, D., Ebert, I., Greilhuber, J., Kozhuharov, S. (1999) Karyotype constancy and genome size variation in Bulgarian Crepis foetida s. l. (Asteraceae). Plant Syst. Evol. 217, 245-257.
Erdugan, H., Aysel, V., G��ner, H. (1996) Marine algae between Rize and Sarp. Black Sea Turkey. Tr. J. of Bot., 20, 103-108 (in Turkish).
Eremenko T.I., Minicheva G.G., Kosenko M.N. (2006) A list of species of macrophytobentos of the north-western part of the Black Sea and limans of Northern Prichernomorie In: The north-western part of the Black Sea: Biology and Ecology, Kiev, Naukova Dumka.
Gromov V.V. (2004) Comparative ecological characteristics of flora and vegetation of the re-freshened Azov Sea areas. In: Complex monitoring of the Azov Sea basin environment and biota. V.6, Apatity, 141-164 (in Russian).
Gromov V.V., Milyutina N.P., Afanas�����ev D.F. (2001) Impact of different types of contamination on the morphobiochemical parameters of macrophytobenthos. In: Environment, biota, modeling of ecological processes in the Sea of Azov. Apatity, 195-135 (in Russian).
Hough A. R., Mark D., Fornwall, Brian J.N., Robert L. T., David A.P. (1989) Plant community dynamics in a chain of lakes: principal factors in the d��cline of rooted macrophytes with eutrophication. Hydrobiologia, 173(3), 199-217.
Is���us M., Malm T., Persson S., Svensson A. (2004) Effects of filamentous algae and sediment on recruitment and survival of Fucus serratus (Phaeophyceae) juveniles in the eutrophic Baltic Sea. Europ. J. of Phycology, 39(3), 301�����307.
Khailov K.M., Prazukin F.D., Kovardakov S.A., Rygalov V.E. (1992) Functional morphology of marine macroalgae. Kiev, Naukova Dumka, 280 pp (in Russian).
Kalugina-Gutnik A.A. (1975) Phytobenthos of the Black Sea. Kiev, Naukova Dumka, 248 pp.
Mairh O.P., Ramanat B.K., Sreenivasa R.P. (1990) Nutrition, growth and tetraspore induction of Gelidiella acerosa (Forssk.) Feld. et Hamel (Gelidiellaceae, Rhodophyta) in culture. Botanica Marina, 33(2), 133-141.
Maximova O.V. and Kucheruk N.V. (1999) Anthropogenic eutrophication of near-shore waters and macroalgal biodiversity in the Levantine Sea. In: The Eastern Mediterranean as a Laboratory Basin for the Assessment of Contrasting Ecosystems (Eds. P.Malanotte-Rizzoli and V.N.Eremeev). NATO Science Series. Ser. 2 ����� Environmental Security, 51, Kluwer Academic Publishers, Dordrecht/Boston/London, 431-436.
Maximova O.V. and Luchina N.P. (2002) Modern state of macrophytobenthos off the North Caucasian coast: a response to eutrophication of the Black Sea basin. In: Multidisciplinary investigations of the northeast part of the Black Sea. Moscow, Nauka, 297-308 (in Russian).
Maximova O.V. and Mitjaseva N.A. (2003) Contemporary state and long-term transformation of the North Caucasian macrophytobenthos (Black Sea). Abstracts of Int. Conference ���œScientific and Policy Challenges towards the Effective Management of the Marine Environment. Emphasis on the Black Sea and the Mediterranean Region����, Bulgaria, Varna, 194-196.
Maximova O.V., Moruchkova (Mitjaseva) N.A. (2005) Long-term anthropogenic transformation and contemporary state of the North Caucasian macrophytobenthos (Black Sea). Oceanology, 45, suppl. 1, S168-S175.
Maximova O.V. and Rybnikov P.V. (1993) Morphological diversity of attached Phyllophora nervosa (D.C.) Grev. from the north-eastern Black Sea: problems of classification. Biology of the Black Sea agarophytes: Phyllophora nervosa (D.C.) Grev. Moscow, IO RAS, 25-38 (in Russian).
Milchakova N.A. (1999) Long term changes in seaweeds of the largest bays of the Black Sea. 2nd European Phycological Congress, Montecantini Terme, Italy: Book of Abstracts, 35-36.
Milchakova N.A. (2002) New species of macro algae in the Black Sea flora. Ekologiya Moriya, 63, 19-24.
Milchakova N.A. (2003a) Systematic composition and distribution of green macrophyte algae (Chlorophyceae Wille S.L.) of the Black Sea. Algologiya, 13(1), 70�����82.
Milchakova N.A. (2003b) The macrophytobenthos. In: Modern condi��tion of a biodiversity of coastal waters of Crimea (the Black Sea sector). Sevastopol, 152-208.
Milchakova N.A. 2007. The regional aspects of the phytodiversity of Black Sea macrophyte flora. Morskoy ecologicheskiy zhurnal, 1(1), 44-54 (in Russian).
Milchakova N.A. and Kireeva E.V.�� (2000) Comparative anatomical characteristic of red algae Polysiphonia elongata (Huds.) Harv. from the Black Sea. Ecologya moriya, 53, 44-48.
Milchakova N.A., Aysel, V., Erdugan, H. (2005) Red algae (Rhodophyta, Phodophyceae) of the Black Sea. Taxonomic composition and distribution. Intern. Journ. on Algae. 7(4), 334-354.
Minicheva G.G. (1998) Morphofunctional of a basis of formation of marine bottom vegetation: Thesis of dissertation. Doctor of Sciences: 03.00.17, Sevastopol, 37pp.
Mitjaseva N.A., Maximova O.V., Georgiev A.A. (2003) Macroalgal flora of the northern part of the Black Sea Russian coast, Ekologija morja, 64, 24-29 (in Russian).
���zt��rk, B. (1998) Black Sea Biological Diversity: Turkey.- GEF Black Sea Environmental Programme, ISBN 92-1-129504-1, United Nations Publications Sales No. E.99.III.R.1, Black Sea Environmental Series, Vol. 9. 144 pp.
Petrov K.M. (1960) Underwater vegetation of the Black Sea coastal zone at the North Caucasus and Taman Peninsula. Vestnik Leningradskogo Universiteta, 18(3), Ser. Geology and Geography, 124-143 (in Russian).
Petrov K.M. (1961a) The macrophytes of the Black Sea coastal zone at the Taman Peninsula and North Caucasus. Ann. Novorossijsk Biol. Station, 41-67 (in Russian).
Petrov K.M. (1961b) Underwater vegetation off the Black Sea coast of Taman Peninsula and North Caucasus, Using of aero-methods for natural resources investigations. Moscow-Leningrad, AS USSR. 190-256 (in Russian).
Rygalov V.E., Ivanova T.P., Kulepanov V.N., Orlova S.V. (1988) Environmental factors as growth and morphological regulator of marine algae. Proc. III All-Union conference on marine biology. Part 2, Kiev, 217-218 (in Russian).
Sava D. (1999) Observatii preliminare asupra biomasei algelor macrofite marine de la litoralul romanesc al Marii Negre. Acta Botanici Bucurestiensis, 28, 199-206.
Sburlea A. and Bologa S.A. (2006) Associated macroalgae of the perennial alga Cystoseira barbata, a key species at the Romanian Black Sea shore. In: National Conference on ����Biodiversity and human impact on Black Sea and it�����s littoral ecosistems����, Scientific Annals of Al. I. Cuza University, Iasi, 41-46.
Sburlea A., Mircea D.M. (2006) Potential utilization of stranded macroalgae on the Romanian Black Sea coast in ecological agriculture. Cercetari marine ����� Recherches marines�� (in press).
Skolka H.V. (1956) Speciile de Phyllophora din apele romaneşti ale Marii Negre ����� raspandirea si importanta lor.�� Bul. Inst. Cercet. Piscicole, 15(4), 84-88.
Skolka H.V., Vasiliu F., Bologa A.S. (1980) Les development des algue macrophytes le long du littoral roumain pendant les annees 1977-1978. Cercetari marine-Recherches marines, 13, 135-142.
Vershinin A.O. and Kamnev A.N. (2000) Macroalgal Cladophora Blooms at Anapa Beaches as a Result of Anthropogenic Eutrophication. Proc. 8th International Congress on Harmful Algal Blooms, Hobart, Australia.
Vershinin A. and Kamnev A. (2001) Harmful algae in Russian European coastal waters. Intergovernment Oceanographic Commission of UNESCO. Harmful Algal Blooms-2000, 112-114.
Vilkova O.Yu. (2005) Contemporary state of brown seaweed Cystoseira spp. stock in the Russian part of the Black Sea. In: Marine coastal ecosystems: seaweeds, invertebrates and products of their recycling. Materials of the Second international scientific-practical conference. Moscow, VNIRO, 20-23 (in Russian).
Zaika V.E., Boltachev A.R., Zuev G.V., Kovalev A.V., Milchakova N.A., Sergeeva N.G. (2004) Floristic and faunistic changes in the Crimean Black Sea shelf after 1995-1998. Marine Ecological Journal (Ukraine), 2, 37-44 (in Russian).
Zaitsev Yu.P. (2006) An Introduction on the Black Sea Ecology. Odessa: Even, 224 pp (in Russian).
CHAPTER 8 THE STATE OF ZOOBENTHOS (N. Revkov et al.)
��Institute of Biology of the Southern Seas, NASU, Sevastopol, Ukraine
National Institute for Marine Research and Development ���œGrigore Antipa���� (NIMRD), Constanta, Romania
Institute of Oceanology, BAS, Varna, Bulgaria
E. Mickashavidze and M. Varshanidze
Georgian Marine Ecology and Fisheries Research Institute (MEFRI), Batumi, Georgia
Sinop University, Fisheries Faculty, Sinop, Turkey
Turkish Marine Research Foundation (TUDAV), Istanbul, Turkey
M.V. Chikina and N.V. Kucheruk
P.P.Shirshov Institute of Oceanology, RAS, Moscow, Russia
8.1. Introduction
The state of zoobenthos community structure and functioning may be considered as one of the most conservative indicators for assessing the structural and functional changes and thus its ecological health. In the 1960s, the northwestern shelf was used to be represented by very rich fauna and nourishing place for economically valuable fish species. The anthropogenic disturbances made this biocoenosis less vulnerable to the environmental changes in the 1970-1980s, and diminished its benthic populations particularly in the discharge regions of Danube, Dnieper, and Dniester Rivers. As a result, the zoobenthos community structure shifted to the dominance of smaller size hypoxia tolerant groups and opportunistic species that resulted in an increase in total zoobenthos abundance but decrease in total biomass. Degradation of benthic communities has further been intensified by other forms of pollution, impacts of exotic invaders and their unsustainable exploitation. Regarding to exotic invasions, wide diversity of biotopes and low species diversity of the Black Sea has provided favourable conditions for exotic invaders, which find unoccupied ecological niches without competitors and/or predators. The rate of alien species introductions has been constantly increasing and degrading benthic community structures.
The main characteristic features of the northwestern benthic ecosystem during the intense eutrophication phase may be summarized as follows (Gomoiu, 1992; Zaitsev and Mamaev, 1997): drastic decrease of the specific diversity; simplified zoobenthic community structures; decreasing abundance and biomass of benthic populations; reduction of biofilter strength of the system due to the loss of filter�����feeder populations; qualitative and quantitative worsening of benthic biological resources, especially mollusks; flourishing of some opportunistic forms (especially worms causing sediment bioturbation);�� invasion by some exotic species (Mya, Scapharca, Rapana etc.); severe disturbances in all benthic populations. The present chapter evaluates the status and trends of the Black Sea zoobenthos macrofauna after the 1980s and assesses its present state by focusing mainly on the western and northwestern littoral zones.
8.2. Ukrainian shelf area
During 1973 ����� 2005,
nearly 4500 benthic stations have been executed in the NWS and along the coast
of Crimea mostly in the shallow coastal zone, with less frequent sampling at
depths deeper than 40 m in the 2000s. The quantitative development and
long-term changes of macrozoobenthos were studied using the database of the
Benthos Ecology Department of IBSS (Sevastopol) and referenced published
materials. The taxa role and species importance were evaluated by the ���˜Index of
functional abundance����� (IFA) and ���˜Density indices����� (DI):
 ;
;
 , where
Bi , Ni�� and pi
are wet biomass (g m-2), abundance (ind. m-2)
and occurrence (0 ����� 1) of i taxon respectively. The approach to classification
of bottom communities was based on the biomass determination of separate species
dominating at stations (Vorobyov, 1949).
, where
Bi , Ni�� and pi
are wet biomass (g m-2), abundance (ind. m-2)
and occurrence (0 ����� 1) of i taxon respectively. The approach to classification
of bottom communities was based on the biomass determination of separate species
dominating at stations (Vorobyov, 1949).
8.2.1. Taxonomic composition of macrozoobenthos and its long-term changes: Bottom macrozoobenthos community of the Black Sea northwestern shelf (NWS) and of the Crimean Peninsula coastal zone have experienced major population changes and morphological anomalies in the 1970s and 1980s. Most notable changes were encountered in the north-northwestern coastal area including the Karkinitskiy Bay (Povchun, 1992; Black Sea biological ����, 1998; Shurova, 2003; Sinegub, 2006) and to a lesser extent along the western and southern coasts of the Crimean Peninsula (Zaika, 1990; Zaika et al., 1992; Petrov, Zaika, 1993; Kisseleva et al., 1997; Revkov et al., 1999; Zaika, Sergeeva, 2001; Makarov, Kostylev, 2002).
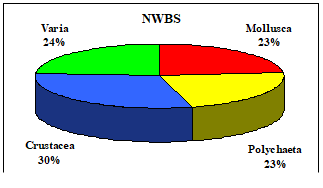
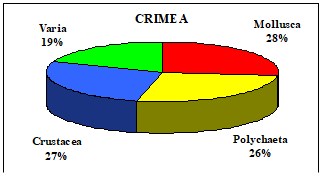
Fig. 8.1. Relative contribution of basic zoobenthos groups in the NWBS and at the Crimea coast during 1967 ����� 2005 (without taking into account Oligohaeta and Turbellaria).
Bottom zoobenthos fauna of the northern and northwestern coastal zone of the Black Sea has the Mediterranean-Atlantic origin (Mordukhay-Boltovskoy, 1972). It includes 419 species in the NWS (Sinegub, 2006) and nearly 600 species along the coast of Crimea (Revkov, 2003a). However, the recent studies did not focus in sufficient detail on the taxonomy of Porifera, Coelenterata, Nemertini, Turbellaria, and Oligochaeta groups. They have only shown an increase of Oligohaeta species number from 4 before 1967 up to 29 species (Shurova, 2006). For convenience, the Turbellaria, Oligohaeta and Insecta (larvae) groups are excluded from the taxonomical structure of the macrobenthos fauna listed in Table 8.1. The list comprised 363 species in the NWS for 1967 ����� 2005 as compared to 299 species before 1967 and 271 species during 1973 ����� 2003. The most numerous group in the NWS was Crustacea (30 %) followed by Mollusca (23 %), Polychaeta (23 %) and ���˜Varia����� (24 %) (Fig. 8.1). The Crimean coastal zone has richer bottom fauna including 574 macrozoobenthos species (Table 8.1) that was formed by 28% Molluscа, 26% Polychaeta, 27% Crustacea and 19% Varia (Fig. 8.1).
Table 8.1. Basic taxa of macrozoobenthos along the NW and Crimean coastlines.
| Taxon | The Black Sea, before 1975* | NWBS** | Crimean coastal zone*** | ||||
| before 1967 | 1973�����2003 | wholeobservationperiod | before1975 | 1980�����2005 | wholeobservationperiod | ||
| PORIFERA | 29 (29) | 20 | 6 | 20 | 14 | 17 | 19 |
| COELENTERATA | 36 (32) | 27 | 9 | 29 | 24 | 32 | 35 |
| Hydrozoa | 27 (24) | 24 | 5 | 25 | 16 | 25 | 27 |
| Scyphozoa | 3 (3) | ����� | 1 | 1 | 3 | 3 | 3 |
| Anthozoa | 6 (5) | 3 | 3 | 3 | 5 | 4 | 5 |
| NEMERTINI | 31 (31) | 11 | 3 | 11 | 20 | 3 | 20 |
| POLYCHAETA | 182 (149) | 63 | 66 | 82 | 137 | 151 | 151 |
| SIPUNCULIDA | 1 (1) | 1 | ����� | 1 | ����� | ����� | ����� |
| PHORONIDEA | 1 (1) | 1 | 1 | 1 | 1 | 2 | 2 |
| BRYOZOA | 16 (16) | 9 | 6 | 10 | 12 | 13 | 15 |
| CRUSTACEA | 230 (150) | 83 | 102 | 111 | 134 | 151 | 157 |
| Cirripedia | 5 (5) | 3 | 3 | 3 | 4 | 6 | 6 |
| Decapoda | 37 (35) | 18 | 18 | 19 | 33 | 34 | 35 |
| Mysidacea | 19 (11) | 8 | 8 | 9 | 5 | 8 | 8 |
| Cumacea | 23 (12) | 9 | 10 | 11 | 9 | 15 | 15 |
| Anisopoda | 6 (4) | 2 | 3 | 3 | 4 | 4 | 4 |
| Isopoda | 29 (22) | 11 | 17 | 18 | 20 | 18 | 22 |
| Amphipoda | 111 (61) | 32 | 43 | 48 | 59 | 66 | 67 |
| PANTOPODA | 7 (4) | 2 | 1 | 2 | 4 | 4 | 5 |
| MOLLUSCA | 192 (132) | 72 | 68 | 84 | 124 | 144 | 156 |
| Loricata | 3 (3) | 1 | 1 | 1 | 2 | 2 | 2 |
| Gastropoda | 100 (76) | 34 | 34 | 43 | 77 | 94 | 105 |
| Bivalvia | 89 (53) | 37 | 33 | 40 | 45 | 48 | 49 |
| ECHINODERMATA | 14 (5) | 2 | 3 | 4 | 5 | 5 | 5 |
| CHORDATA | 9 (9) | 8 | 6 | 8 | 9 | 9 | 9 |
| Tunicata | 8 | 7 | 6 | 7 | 8 | 8 | 8 |
| Acrania | 1 | 1 | ����� | 1 | 1 | 1 | 1 |
| TOTAL | 748 (559) | 299 | 271 | 363 | 484 | 531 | 574 |
| The number of species usual for waters with normal Black Sea salinity is specified in parentheses. * from Revkov 2003a, ** from Sinegub, 2006, *** from Revkov 2003a with additions. | |||||||
These regionally-averaged values, however, differ considerably in the different parts of the NWS and Crimean Peninsula (Fig. 8.2). For example, 209 species were identified in the Dnepr-Bug estuary at 2061 stations, 161 on the shelf between Danube and Dnestr at 674 stations, 166 in Karkinitskiy Bay at 115 stations, and 107 in the Central part of the NWS at 46 stations (Sinegub, 2006). The southern Crimean coastal zone near Karadag comprised 367 macrozoobenthos species comparable to 358 species in the Sevastopol Bay (Revkov, 2005). In Dnepr-Bug and Danube-Dnestr estuary areas, Crustacea were the dominant group and constituted 39 ����� 40 % of the total species number (Fig.8.2). The ���œVaria���� group had the largest share (24 %) in the Sevastopol Bay.
When the marine forms of main taxa (Porifera, Coelenterata, Bryozoa, Polychaeta, Molluscа, Crustacea, Echinodermata, Tunicata) are only considered in waters with average salinity of 18 ����, the Crimean fauna is represented by 484 macrozoobenthos species before 1975 versus 531 species during 1980 ����� 2005 (Table 8.1). Therefore, the number of benthic species in the Crimean coastal zone has not decreased during the last decades. Instead, it was enriched due to 1) expansion of some species, 2) introduction of new forms, previously observed only in the pre-Bosporus region, 3) introduction and population outbreaks of alien species, 4) more detailed analyses of some systematic groups.
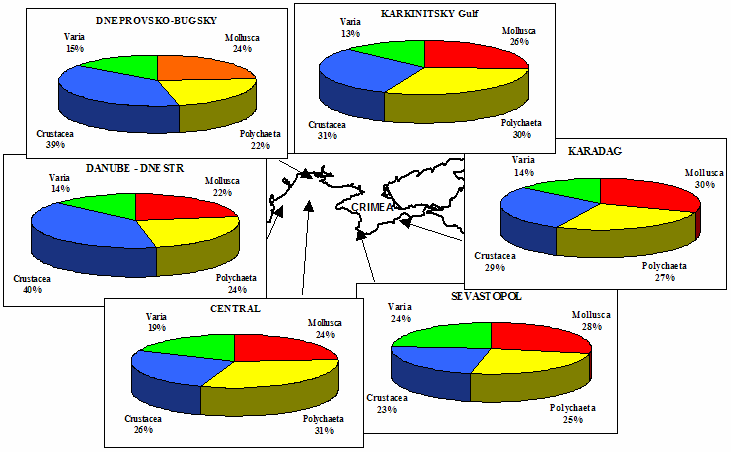
Fig. 8.2. Species numbers (in %) of basic zoobenthos groups in different regions of the Ukrainian sector of the Black Sea. The data used for the NWBS correspond to 1973 ����� 2003. For Sevastopol and Karadag, the measurement period covered observations prior to 1973.
So far, the group of Hydroids of Crimea was replenished by the species Coryne pusilla (Gaertner, 1774), Eudendrium annulatum Norman, 1864, E. capillare Alder, 1857, Opercularella nana Hartlaub, 1897 and Stauridia producta Wright, 1858; in the group of polychaetes new for the Crimean fauna in 1980 ����� 2005 became Caulleriella caput�����esocis Saint�����Joseph, 1894, Euclymene palermitana Grube, 1840, Glycera gigantea Quatrefages, 1865, Hypania invalida (Grube, 1860), Nereis rava Ehlers, 1868, Notomastus latericeus Sars, 1851, Pectinaria belgica (Pallas, 1766); new for the science species were described, such as ����� Nerilla taurica Skulyari, 1997 and Vigtorniella zaikai (Kisseleva, 1992); crustaceans group was replenished by Chthamalus montagui Southward, 1976, Colomastix pusilla Grube, 1861, Cumopsis goodsiri (Van Beneden, 1868), Pseudocuma graciloides G.O. Sars, 1894, P. tenuicauda (G.O. Sars, 1893), Schizorhynchus scabriusculus (G.O. Sars, 1894), Orchestia platensis (Kroyer, 1845), Parhyale sp., Micropythia carinata (Bate, 1862). Of Pantopoda this is Anoplodactylus petiolatus (Kroyer, 1844); of Bryozoa these are Electra crustulenta (Borg, 1931), Schizoporella linearis (Hassall, 1841) and Victorella pavida Kent, 1870. The most numerous additions appeared among mollusks: Anadara inaequivalvis (Bruguiere, 1789), Clausinella fasciata (Costa, 1778), Mya arenaria Linnaeus, 1758, Doridella obscura Verrill, 1870, Hydrobia aciculina (Bourguignat, 1876), H. procerula Paladilhe, 1869, Melaraphe induta (Westerlund, 1898), Mutiturboella cornea (Loven, 1846), Pontiturboella rufostrigata (Hesse, 1916), Pseudopaludinella cygnea Anistratenco, 1992, P. leneumicra (Bourguignat, 1876), Pusillina obscura (Philippi, 1844), Thalassobia rausiana (Radoman, 1974), Th. coutagnei (Bourguignat in Coutagne, 1881), Tricolia pulchella (Recluz, 1843), T. tricolor (Bucquoy, Dautzenberg et Dollfus, 1884), Steromphala crimeana Anistratenco et Starobogatov, 1991, Bittium jadertinum (Brusina, 1865), B. scabrum (Olivi, 1792), Cerithium spinosum Philippi, 1836, C. gracilis Philippi, 1836, Truncatella desnoyersii (Payraudeau, 1826) and T. truncatula (Draparnaud, 1805). The ���˜enrichment����� of the gastropods took place mostly due to their taxonomical revision.
In parallel with the enrichment of the Crimean macrozoobenthos fauna, some traditionally rare species have not been observed since 1980s. This may be due to their small populations and inadequate sampling, as well as due to difficulties in identification of some specific groups (for example, Nemertini, Porifera, Turbellaria, Oligohaeta), and insufficient analysis of various biotopes. The species which were not observed along the coast of Crimea in 1980 ����� 2005 included for Anthozoa: Synhalcampella ostroumowi Wyragevitch, 1905; for Crustacea: Palaemon serratus (Pennant, 1777), Chelura terebrans Philippi, 1839, Eurydice pontica (Czerniavsky, 1868), Jaera hopeana Costa, 1853 and Limnoria tuberculata Sowinsky, 1884; for Pantopoda Ammothea echinata (Hodge, 1864); for Mollusca: Cuthona amoena (Alder et Hancock, 1842), Doris ocelligera (Bergh, 1881), Embletonia pulchra (Alder et Hancock, 1844), Eulimella scillae (Scachi, 1835), Limapontia capitata (Muller, 1773), Parhedyle tyrtowii (Kowalewski, 1900), Pontohedyle milaschewitschi (Kowalewski, 1901), Pseudovermis paradoxus Perejaslawtzeva, 1890, Tergipes tergipes (Forskal, 1775) and Trinchesia foliata (Forbes et Goodsir, 1839); for Bryozoa: Aetea recta Hincks, 1880 and Bowerbankia caudata (Hincks, 1877). Most of these species were marked earlier as rare.
During 1980 ����� 1990s along the coast of Crimea, the highest species diversity (242 species) was found at the coastal and relatively shallow depths of 11 ����� 20 m where mollusks were the most diverse group (81 species). Crustaceans and annelids (74 and 80 species, respectively) had the highest diversity at the depths of 0 ����� 10 m, and the fauna of miscellaneous species (35) - at the 21 ����� 30 m depth range. The presence of more various bottom fauna under the conditions of the rather shallow coastal zone was accompanied by a greater variety of habitats. For the whole observation period, in Crimean waters 55 macrozoobenthos species were found at depths of 100 m and deeper. These were 19 species of the group Annelida, 18 Mollusca, 7 Arthropoda, 4 Coelenterata, 3 Echinodermata, 2 Ascidiacea and by one species from Nemertini и Porifera. More than half of them are ���œoccasional����, and only 26 species can be attributed to ���œusual���� for these depths (Revkov, 2003c). According to M.I. Kisseleva (2004) singular specimens of polychaetes Aricidea claudiae, Nephtys sp., Melinna palmata, Heteromastus filiformis, Terebellides stroemi, Oriopsis armandi were registered at the depth of 200 m off the southern coast of Crimea.
In deep waters (40 m and deeper) 3 ����� 5 fold ���˜visual����� reduction in macrozoobenthos species diversity was found in the 1980s as compared to the 1960s (compare the curves 1 and 2 in Fig. 8.3, Zaika 1990). However, in 2003 new data for the period 1980 ����� 1990s were digested, essentially modifying the understanding of benthos communities development at depths 50 ����� 120 m. Undoubtedly, the new data showed no real reduction in the total number of benthic species in deep waters, but decrease in their occurrence on the Crimean shelf. In other words, the detection of missing rare species became possible only after analyses of considerably greater number of stations (Fig. 8.3, line 3). At approximately equal number of stations executed at the coast of Crimea both in 1960s and 1980s (nearly 100 stations) the decrease in species population density in 1980s lead to the effect of seeming reduction in diversity.
In a similar way, 3 ����� 4 fold seeming reduction of bottom fauna diversity was found on the northern Black Sea shelf during 1980 ����� 1990s (Black Sea biological ����, 1998). In reality, decrease in population density of some species (rare chance to find them in the samples) occurred, but they had not disappeared from the local fauna completely.
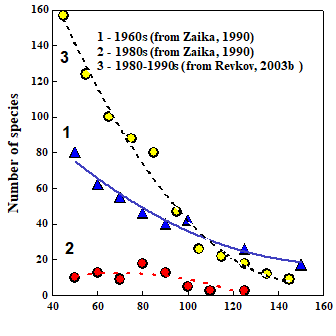
Fig. 8.3. Changes in macrozoobenthos species diversity on the soft bottoms along the coast of Crimea during different periods.
In 2005 ����� 2007, the total number of species in shallow NWS waters varied in the range of 30 ����� 60, the lowest values found in the Danube Delta and Odessa Bay regions, and twice higher diversity in Yagorlytskiy and Tendrovskiy Bays (Fig. 8.4). Crustacea and Polychaeta had almost equal and highest contributions, Bivalvia came the second, and the Gastropoda group was represented by lowest number of species at all sites of observations. However, in terms of biomass, the Bivalvia group dominated entirely with: ���� 500 g m-2 in the Danube Delta and Odessa Bay and around 1000 g m-2 in Yagorlytskiy and Tendrovskiy Bays, reaching 2000 g m-2 in the Yagorlytskiy Bay during 2007 (Fig. 8.5).
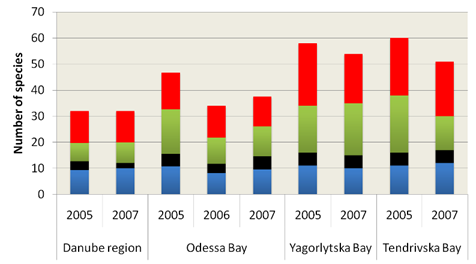
Fig. 8.4. Total
number of
macrozoobenthos species in
different areas of the NW Black Sea:
��blue ����� Bivalvia, black ����� Gastropoda, green ����� Crustacea, red ����� Polychaeta (from
Ukrainian National Report, 2007).
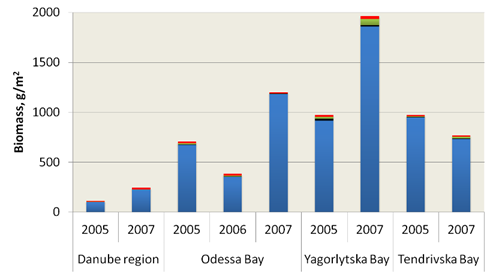
��Fig. 8.5.
Macrozoobenthos biomass (g m-2) in
different areas of the NW Black Sea:
blue ����� Bivalvia, black ����� Gastropoda, green ����� Crustacea, red ����� Polychaeta (from
Ukrainian National Report, 2007).
8.2.2. Biocenoses and quantitative development of bottom fauna: During 1983 ����� 2003, nearly 19 types of bottom biocenoses were described in the NWS (Table 8.2), most of which were autochthonous (Sinegub, 2006). Heteromastus filiformis, Pontogammarus maeoticus, Paphia aurea, Orchestia cavimana, Anadara inaequivalvis, Irus irus and Donacilla cornea were rather new biocenoses. The biocenoses of Mya arenaria and Anadara inaequivalvis were formed by introduced species, and the biocenoses of Neanthes succinea and Heteromastus filiformis were formed temporarily as a result of near-bottom suffocation (Sinegub, 2006).
Using the results of benthos surveys carried out in 1980 ����� 2004 along the coast of Crimea, about 50 bottom biocenoses can be described. According to the biocenotical classification suggested by Kiseleva and Slavina (1972), the biocenoses of Mytilus galloprovincialis, Modiolula phaseolina and Chamelea gallina were the most important and widespread ones presented on the maps as concentric zones along the coast. The other biocenoses were of more local origin occupying small areas in the region. The belt-community of Modiolula phaseolina extended from the mid-shelf (~50 m depth) to the shelf break (at 120 ����� 135 m depths) where mollusks were found in the form of fine spots (Zaika et al., 1992). Modiolula phaseolina at depths more than 100 m was represented mainly by juvenile forms and its presence was even extended to the sub-aerobic zone at ~180 m (Yakubova, 1948; Kisseleva, 1985; Zaika and Sergeeva, 2001).
The lower boundary of aerobic benthos along the Crimean coast, defined by the position of oxic/anoxic interface, forms the Periazoic belt (depths about 115 ����� 180 m). It is inhabited by a specific community of polychaete (Vigtorniella zaikai, Kiseleva, 1992), Protodrilus sp., specific hydroid and foraminiferan species, not studied in detail so far (Fig. 8.6) (Zaika, 1998). The periazoic belt was also found in the north-western part of the Black Sea (Bacesco et al., 1965). It is, however, not known whether the periazoic community forms ring-belt around the entire sea.
The belt of silt mussels Mytilus galloprovincialis was limited by the depth range from 30 ����� 40 m to 50 ����� 60. At depths less than 30 ����� 40 m the Chamelea gallina belt community is located. Here the benthic habitat becomes more heterogeneous and higher number of factors impact on the distribution of benthic animals. Communities of this zone become more and more patchy. Regional differences in species composition are here more pronounced and in this zone (less than 30 ����� 40 m) each benthic belt is a habitat of different local communities (Zaika, 1998).
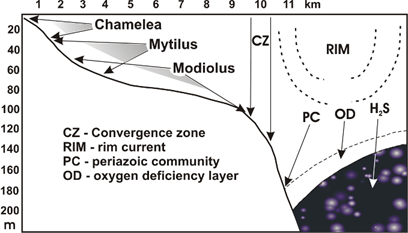
Fig. 8.6. Benthic belts of the Black Sea shelf (from Zaika, 1998, with additions).
The list of leading species on the NWBS shelf is headed by Mytilus galloprovincialis, Mya arenaria and Neanthes succinea (Table 8.2), on the Crimean shelf ����� by Chamelea gallina, Mytilus galloprovincialis and Modiolula phaseolina (Table 8.3). All three main biocenoses of the Crimean sea shelf are belts. In the biocenosis of Mytilus galloprovincialis, occupying large areas in the NWS, the greatest number of species (163) was registered. Significant part of the sampling stations in the Dnepr-Bug and the Danube-Dnestr marine areas (both belonging to the biocenosis of Mytilus galloprovincialis) was executed outside the suffocation zone in the depth range of 4 ����� 10 m (Sinegub, 2006). At this depth range of the Dnepr-Bug marine area, the abundance and biomass of benthos exceeded 10000 ind. m-2 and 10 kg m-2, respectively. The lowest average values of abundance (1548 ind. m-2) and biomass (462.2 g m-2) were measured in the biocenosis of Mytilus galloprovincialis of the central NWS where the maximal length of mussels did not exceed 40 mm.
Table 8.2. Quantity indicators of development of bottom biocenoses on the NWS shelf during 1983 ����� 2003 (Sinegub, 2006).
| Leading species of biocenoses | Timeperiod | Number of stations | Depth, m | Number of species | Average abundance, ind. m‑2 | Average biomass,g m‑2 | Share (%) of leading species biomass | Sitesof NWBS* |
| Mytilus galloprovincialis Lamarck, 1819 | 1984 ����� 2003 | 526 | 4 ����� 45 | 163 | 2810 | 1486.7 | 95.3 | NWBS |
| Mya arenaria Linnaeus, 1758 | 1984 ����� 1999 | 244 | 6 ����� 29 | 87 | 1630 | 217.1 | 82.1 | DB, DD |
| Neanthes succinea (Frey et Leuckart, 1847) | 1984 ����� 2003 | 132 | 7 ����� 29 | 46 | 1124 | 24.2 | 52.9 | DB, DD |
| Heteromastus filiformis (Clapar�¨de, 1864) | 1988 ����� 2000 | 57 | 7 ����� 25 | 25 | 352 | 2.8 | 65.7 | DB, DD |
| Pontogammarus maeoticus (Sowinskyi, 1894) | 1992 ����� 2001 | 39 | 0 ����� 1 | 9 | 8231 | 66.8 | 99.7 | DB, DD |
| Cerastoderma glaucum Poiret, 1789 | 1988 ����� 2000 | 31 | 1 ����� 23 | 80 | 2025 | 86.7 | 60.4 | DB |
| Mytilaster lineatus (Gmelin, 1791) | 1988 ����� 2000 | 28 | 1 ����� 11 | 99 | 3774 | 415.1 | 42.0 | DB, Kark. |
| Melinna palmata Grube, 1870 �������Nephtys hombergii Savigny, 1818 | 1990 | 25 | 25 ����� 35 | 10 | 114 | 2.7 | 85.2 | Centr. |
| Paphia aurea (Gmelin, 1791) | 1990 | 18 | 20 ����� 31 | 29 | 210 | 41.2 | 49.3 | Kark. |
| Nephtys hombergii Savigny, 1818 | 1984 ����� 1990 | 16 | 2 ����� 35 | 31 | 220 | 5.7 | 20.3 | DB, DD, Kark. |
| Orchestia cavimana Heller, 1865(Syn. O. bottae M.-Edwards, 1840) | 1992 ����� 1994 | 12 | 0 | 4 | 2108 | 12.3 | 95.9 | DB |
| Lentidium mediterraneum (Costa, 1829) | 1983 ����� 1993 | 11 | 1 ����� 6 | 30 | 9035 | 78.0 | 63.9 | DB, DD |
| Chamelea gallina (Linnaeus, 1758) | 1985 ����� 2000 | 10 | 6 ����� 26 | 65 | 1203 | 532.3 | 72.5 | Kark. |
| Modiolula phaseolina (Philippi, 1844) | 1985 ����� 1986 | 6 | 49 ����� 54 | 30 | 762 | 93. | 59.2 | Centr. |
| Melinna palmata Grube, 1870 | 1994 ����� 1999 | 5 | 15 ����� 19 | 15 | 974 | 48.5 | 73.0 | DB |
| Anadara inaequivalvis (Bruguiere, 1789) | 1992 ����� 2003 | 5 | 6 ����� 11 | 8 | 2533 | 198.6 | 87.4 | DD |
| Irus irus (Linnaeus, 1758) | 1988 | 3 | 2 ����� 4 | 49 | 6567 | 1168.0 | 44.5 | DB (Е) |
| Balanus improvisus Darwin, 1854 | 1983 | 3 | 1 ����� 2 | 24 | 6251 | 213.7 | 73.6 | DB |
| Donacilla cornea(Poli, 1795) | 1992 | 2 | 0 ����� 0.5 | 7 | 17800 | 88.6 | 80.7 | DB (Т) |
| * ����� NWBS ����� all areas; DB ����� Dnepr-Bug sea water area; DD ����� Danube-Dnestr sea water area; Kark. ����� Karkinitsky gulf; Centr. ����� the Central area, DB (E) ����� Egorlytskii gulf; DB (T) ����� Tendrovskii gulf. | ||||||||
Table 8.3. Quantity indicators of development of bottom biocenoses at the Crimean shores during 1980 ����� 2004.
| Leading species of biocenoses | Timeperiod | Numberofstations | Depth,m | Numberofspecies | Averageabundance,ind. m‑2 | Averagebiomass,g m‑2 | Share (%)of leadingspeciesbiomass | Site ofCrimea* |
| Chamelea gallina (Linnaeus, 1758) | 1981 ����� 2004 | 157 | 1 ����� 32 | 190 | 2547 | 494.9 | 75.8 | Crimea |
| Mytilus galloprovincialis Lamarck, 1819 | 1980 ����� 2001 | 86 | 1.5 ����� 80 | 215 | 1767 | 670.6 | 77.6 | Crimea |
| Modiolula phaseolina (Philippi, 1844) | 1982 ����� 1999 | 38 | 45 ����� 110 | 68 | 596 | 31.2 | 63.4 | Cr 2, 3, 4 |
| Cerastoderma glaucum Poiret, 1789 | 1993 ����� 2004 | 27 | 0.5 ����� 17 | 106 | 3092 | 115.0 | 62.6 | Cr 2 |
| Terebellides stroemi Sars, 1835 | 1981 ����� 1999 | 25 | 15 ����� 136 | 49 | 338 | 5.4 | 64.7 | Crimea |
| Pitar rudis (Poli, 1795) | 1982 ����� 1999 | 21 | 4 ����� 70 | 111 | 1648 | 74.6 | 51.7 | Crimea |
| Nassarius reticulatus (Linnaeus, 1758) | 1982 ����� 2001 | 21 | 1 ����� 28 | 146 | 2218 | 60.7 | 47.8 | Cr 1, 2, 4 |
| Mytilaster lineatus (Gmelin, 1791) | 1994 ����� 2004 | 19 | 1 ����� 16 | 127 | 5006 | 122.5 | 59.9 | Cr 2, 4 |
| Modiolus adriaticus (Lamarck, 1819) | 1983 ����� 2000 | 18 | 3 ����� 40 | 104 | 2171 | 300.1 | 54.3 | Crimea |
| Diogenes pugilator Roux, 1828 | 1983 ����� 1998 | 10 | 2 ����� 20 | 32 | 709 | 9.8 | 74.0 | Cr 2 ����� 4 |
| Paphia aurea (Gmelin, 1791) | 1980 ����� 2000 | 8 | 4 ����� 26 | 60 | 742 | 116.8 | 52.5 | Cr 1, 2 |
| Amphiura stepanovi Djakonov, 1954 | 1983 ����� 1990 | 7 | 60 ����� 106 | 24 | 414 | 8.5 | 37.9 | Cr 3, 4 |
| Abra ovata (Philippi, 1836) | 1993 | 6 | 1 ����� 12 | 40 | 2147 | 146.7 | 59.8 | Cr 2 |
| Nephtys hombergii Savigny, 1818 | 1987 ����� 2001 | 6 | 10 ����� 55 | 29 | 710 | 7.4 | 50.1 | Cr 1�����3 |
| Parvicardium exiguum (Gmelin, 1791) | 1989 ����� 2004 | 6 | 6 ����� 25 | 45 | 2113 | 81.9 | 49.2 | Cr 2 |
| Balanus improvisus Darwin, 1854 | 1994 ����� 2001 | 4 | 12 ����� 17 | 33 | 2385 | 17.9 | 43.5 | Cr 2 |
| Abra nitida milachewichi Nevesskaja, | 1980 ����� 1989 | 3 | 8 ����� 35 | 30 | 276 | 47.1 | 61.1 | Cr 1 |
| Ascidiella aspersa (Muller, 1776) | 1992 ����� 1994 | 3 | 32 ����� 52 | 29 | 636 | 266.3 | 54.4 | Cr 2 |
| Gouldia minima (Montagu, 1803) | 1983 ����� 1990 | 2 | 11 ����� 30 | 17 | 570 | 212.2 | 60.4 | Cr 3, 4 |
| Loripes lacteus (Linnaeus, 1758) | 2000 ����� 2004 | 2 | 3 | 28 | 1364 | 39.8 | 79.4 | Cr 2 |
| * Crimea ����� all areas, Cr 1 ����� northwest Crimea, Cr 2 ����� western Crimea, Cr 3 ����� southwest Crimea, Cr 4 ����� southeast Crimea. | ||||||||
The transformation of NWS mussel settlements during the 1980s and 1990s was caused by periodic suffocations of bottom fauna, destruction of bottom zoocenoses, and silting of substrata under the impact of large-scale trawling (Shurova, 2003). All of these led to the development of a more simplified population structure of mussel settlements (Shurova, Stadnichenko, 2002), which did not change considerably during the last decade. In summary, the present status of NWS bottom fauna exhibits radical changes in species composition, abundance and biomass both at the species and community level (Sinegub, 2006). The benthos trophic structure was simplified by a sharp reduction in carnivorous and phytophage abundances, domination of detritovorous species by abundance and of sestonophages by biomass in the brackish waters areas of the NWS shelf (river influenced), which experienced the strongest damage by suffocations.
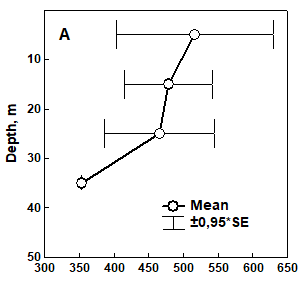 ��
��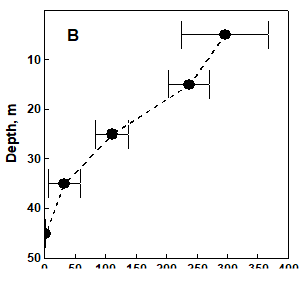
Fig. 8.7. Vertical profiles of the total zoobenthos biomass in the biocenosis Chamelea gallina (A) (according to 157 stations) and the biomass Chamelea gallina (B) (310 stations) at the coast of Crimea for the period 1980 ����� 1990s.
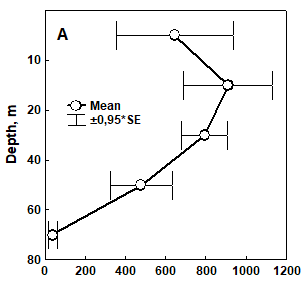 ��
��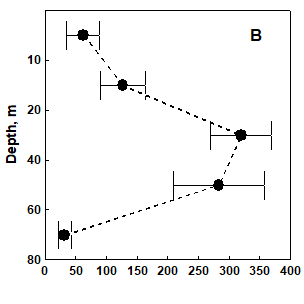
Fig. 8.8. Vertical profiles of the total zoobenthos biomass in biocenosis Mytilus galloprovincialis (A) (according to 86 stations) and the biomass Mytilus galloprovincialis (B) (370 stations) at the coast of Crimea for the period 1980 ����� 1990s.
In 1980 ����� 1990s along the Crimea coast, the maximal average macrozoobenthos biomass in the biocenoses of Chamelea gallina (~520 g m-2) was registered within 0 -10 m depths (Fig. 8.7a) and of Mytilus galloprovincialis (~900 g m-2) within 10 ����� 20 m depths (Fig. 8.8a). Previous locations of maximum macrozoobenthos biomasses in the biocenoses of Chamelea gallina and Mytilus galloprovincialis (1960 ����� 1970s) were, however, at 25 m and 40 ����� 45 m accordingly (Kiseleva, 1981). In 1980-1990s the maximal total macrozoobenthos biomass, allocated at depths of 10-20 m, did not coincide in space with the maximum of dominant species biomass observed in the biocenosis of M. galloprovincialis at 20-40 m depth (Fig. 8.8).
8.2.3. Long-term changes in quantitative development of the soft-bottom fauna: Analysis of long-term data for the period 1930s ����� 2000s, (Chigirin, 1938; Kisseleva, 1981; Zaika, 1990; Zaika et al., 1992; Kisseleva et al., 1997; Black Sea biological ����, 1998; Revkov and Nikolaenko, 2002; Mironov et al., 2003; Mazlumyan et al., 2003; Sinegub, 2006; Revkov et al., 2008) evidences that the bottom fauna in the Ukrainian Black Sea has improved slightly (or, at least, has not worsened) during the last two decades in comparison with the 1970s. The areas below the ���˜offshore waters����� and the ���˜Sevastopol Bay����� of the western Crimea were used as examples to delineate the changes in the zoobenthos characteristics.
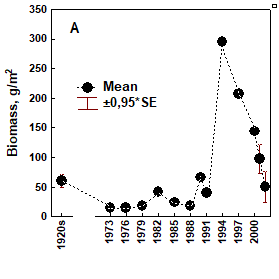 ��
��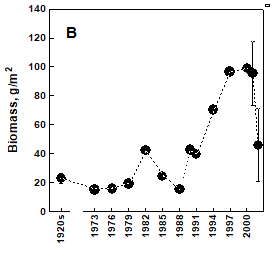
Fig. 8.9. Long-term dynamics of zoobenthos biomass in Sevastopol Bay ����� with consideration of all macrozoobenthos (A), and without Mytilus galloprovincialis which is not a typical soft bottom species of the Sevastopol Bay (B).
Sevastopol Bay: The data from 1920s and 2000s reveal pronounced changes in the development and occurrence of certain benthic forms (Revkov et al., 2008). For example, the most common forms of macrozoobenthos carnivorous Nassarius reticulatus and Nephtys cirrosa in 1920s with the occurrences of 92% and 89%, respectively, were replaced in 2001 by the detritus-feeders Heteromastus filiformis (91%) and Cerastoderma glaucum (85%), with Nassarius reticulatus remaining as a sub-dominant form observed only at several near-shore bottom sites. The alteration of dominant forms indicates qualitative changes in the flow of organic matter in the benthic ecosystem. Moreover, a pronounced increase in the share of seston-feeders was also found in the 1980s (Mironov et al., 2003).
As shown in Fig. 8.9a, the total zoobenthos biomass decreased by half during the eutrophication period of the 1970s and 1980s as compared to the pristine state, and remained below 50 g m-2 until the early 1990s, and then experienced a marked increase to 300 g m-2 in the mid-1990s. The latter was followed by a decrease towards the background values in 2000s (Mironov et al., 2003; Revkov et al., 2008). When Mytilus galloprovincialis biomass was excluded from the total biomass data, since it was not a typical species for the soft bottom fauna of the Sevastopol Bay, the zoobenthos biomass tended to have a more gradual increase from ~20 g m-2 in the 1980s to 100 g m-2 at the end of 1990s and then a marked decline in the 2000s (Fig. 8.9b).
Offshore waters of the western Crimea: Similar long-term structural changes in the zoobenthos biomass and abundance were also observed in the offshore waters of the western Crimea. Here, obvious excess of the average biomass was observed in the 1990s at the depths of 1 ����� 12 m (462��154 g m-2), 13 ����� 25 m (476��97) and 26 ����� 50 m (353��180). For the time being the data of 2000s testify to decreasing of the total zoobenthos biomass towards the level of 1950 ����� 1980s (Fig. 8.10).
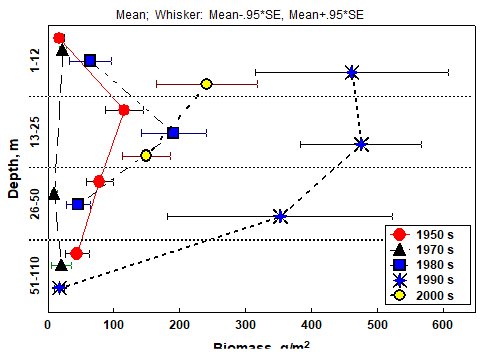
Fig. 8.10. Long-term changes of macrozoobenthos biomass at the western coast of Crimea.
The most significant macrozoobenthos species (by Density index) on the soft bottoms during various periods of study were Chamelea gallina (1 ����� 12 m depths), Chamelea gallina and Gouldia minima (13 ����� 25 m), Mytilus galloprovincialis, Pitar rudis and Terebellides stroemi (26�����50 m), Modiolula phaseolina and Terebellides stroemi (51 ����� 103 m) (Fig. 8.11).
In terms of ���˜Density index�����, Chamelea gallina abundance at the 1 ����� 12 m depth range remained constant (about 25) up to 1980s and then experienced a sharp increase to 300 in the 1990s and decline afterwards to 137 in 2000s (Fig. 8.12). Chamelea gallina abundance, also dominating at the 13 ����� 25 m depth range, changed from 53 in 1980s to 176 in 1990s and dropped to 102 in 2000s. Similarly, Mytilus galloprovincialis density index rose abruptly from less than 5 to 153 during the same phase at the 26 ����� 50 m depth range, but its subsequent trend is not known due to the lack of data. Thus, Chamelea gallina and Mytilus galloprovincialis became the most optimal zoobethos forms in the 1990s. On the contrary, the density index of Modiolula phaseolina, which was the dominant species at the 51 ����� 103 m range in 1950s, decreased from 53 to less than 1 in 1970s and then remained at this level during 1970s ����� 1990s.
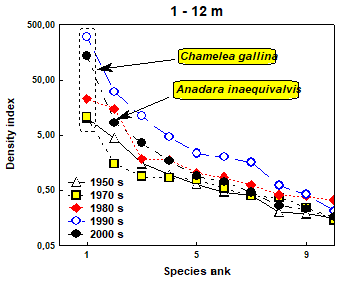 ����
����
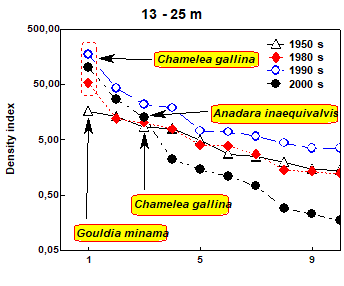
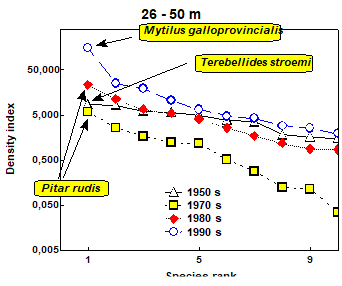 ����
����
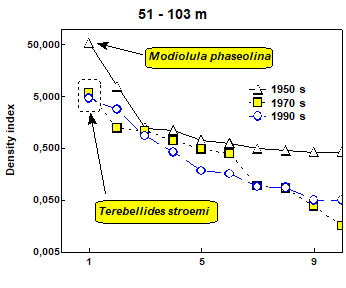
Fig. 8.11. Rank-���˜Density index����� curves for the first 10 macrozoobenthos species at the western coast of Crimea.
We assume that one of the possible factors determining the modern state of benthos at the western Crimea, at depths more than 50 m, is the ���˜near-bottom����� trawling. The areas of most intensive trawling at the coast of Crimea are its western and southern parts with depths 45 ����� 100 m where steady groupings of sprat are formed (Zuev, Melnikova, 2007). The underwater video observations executed in 2005 at the western Crimea (area off the river Kacha) have shown presence of essential anthropogenic pressure on the bottom seascapes, indicated by numerous traces of �����near-bottom����� trawling (Boltachev, 2006).
During the period 1930s ����� 1990s similar changes took place in the benthos along the south-western coast of Crimea. Here, obvious excess of the average biomass was observed in the 1990s at depths of 13 ����� 25 m (800 g m-2) and in the 1930s at depths of 26 ����� 50 m (667 g m-2). In all other cases it is possible to conclude practically comparable levels of benthos development on the mentioned depths during all periods of observations (Fig. 8.13). Such filter-feeding mollusks as Chamelea gallina, Spisula subtruncata, Paphia aurea, Mytilus galloprovincialis and Modiolula phaseolina are the most pronounced ���œevolutioning���� organisms, determining the revealed quantitative alterations in this region and the mode of functioning of benthic communities during all periods of observation.
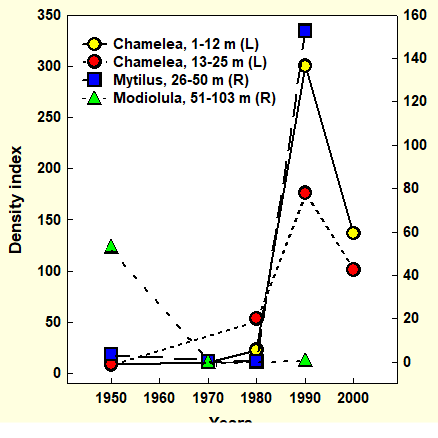
Fig. 8.12. Long-term changes of ���˜Density index����� values with respect to populations of Ch. gallina, M. galloprovincialis and M. phaseolina at the western coast of Crimea. The ���˜Density index����� axes on the left and right are marked by L and R, respectively, in the figure.
In the Lisya Bay, located about 3 km to the west of Karadag (southeastern coast of Crimea), the number of species of all dominant trophic groups increased in 1973 - 1998, and the total species number changed from 56 to 93. Consequently, the average benthos abundance increased from 395 to 7066 ind. m-2 and the biomass from 35.66 to 778.44 g m-2 (Mazlumyan et al., 2003). These changes were further accompanied by reduction in soft bottom areas and expansion of the macrophytes zone. The latter affected the qualitative structure of macrofauna by increasing crustaceans and phytophilous species number. The role of filter-feeders increased markedly due to the domination of Chamelea gallina. Based on the survey conducted in summer 2008, preliminary results suggested that the total biomass of the Lisya Bay benthic fauna is approaching to the values of 1970s.

Fig. 8.13. Index of Biomass of benthic groupings per different years. Range of depths in groupings: a ����� (sandy zone) ����� 1 ����� 12 m, b ����� (silty-sand) ����� 13 ����� 25 m, c ����� (mussel silt) ����� 26 ����� 50 m, d ����� (phaseolina silt) ����� 51 ����� 110 m.
Thus, the tendency of sharp benthos biomass increase during the 1990s appears to be a common feature for many coastal waters of the northern Black Sea, related to the adaptation of the benthic ecosystem to increasing organic pollution. The filter-feeding molluscs Chamelea gallina and Mytilys galloprovincialis (in offshore waters) and Cerastoderma glaucum (in the internal part of the estuarine water areas) became the most abundant forms and altered the benthic assemblages structure along the Ukrainian coastal zone. Recent data from the 2000s testify to reduction in the total zoobenthos biomass towards the level of the 1970 ����� 1980s, possibly due to a reduction in abundance of pollution resistant species.
8.3. Romanian shelf area
8.3.1. Peculiarities of zoobenthos during the previous state of ecosystem
��Almost 800 taxa of benthic invertebrates have been identified in Romanian coastal waters between 1960 and 1970 (Bacescu, et al., 1965), a major portion of which belonged to meiobenthos. The lack of taxonomic studies after 1970, during the period of serious ecological disturbances in the region, however resulted in a gap in the zoobenthic diversity studies.
The most widespread biocoenosis Lentidium (Corbula) mediterraneum in the 1960s northern Romanian coastal zone was represented by very rich fauna (over 100 taxa, mostly molluscs and meiobenthic species), high abundance (> 100000 ind.m-2) and biomass (> 50 g.m-2) (Bacescu et al. 1957, 1965). Because of this richness, the biocenoses used to represent a nourishing place for economically valuable fish species. The anthropogenic disturbances however made this biocoenosis less tolerant to the environmental changes in the 1980s and 1990s, diminished its populations, and dropped the abundances from more than 20000 ����� 30000 ind.m-2 in the 1960�����s to 3000 ind.m-2 in the 1980s. Similarly, the density of Spio decoratus, an important polychaete of this biocenosis, decreased from 30000 ����� 50000 ind.m-2 to less than 1000 ind.m-2. At the same time, some new opportunistic species (e.g. polychaetes Neanthes succinea and Polydora limicola, bivalves Mya arenaria-soft clam and Scapharca cornea; syn. Anadara inaequivalvis) have appeared and started dominating eutrophic areas (Gomoiu, 1976, 1985; Tiganus, 1988).
The development of soft�����shell clam Mya arenaria in sandy infralittoral zones of Romanian shallow waters has been an important ecological event. Following its settlement, Mya has become a mass species with the average density of 1037 ind.m-2 and biomass of 1936 g.m-2 in 1970-1971. It dominated other molluscs and replaced the aboriginal mass species Lentidium mediterraneum community sensitive to ecological changes in the 1970-1980s (Petranu and Gomoiu, 1972). As an opportunistic species with a high capacity for regeneration, Mya arenaria was able to take advantage of consuming increasing quantities of organic matter available in the environment.
The biocoenoses of coarse sands in the mediolittoral of southern zone was characterized by the bivalve Donacilla cornea (syn. Mesodesma corneum) and sometimes associated with the polychaete Ophelia bicornis in the 1960s. Both of these species have not been recorded in the subsequent decades, but the bivalve Donacilla cornea was registered again in 2004 (Micu and Micu, 2006). In addition to pollution, coastal engineering constructions (dams, barrages) have also caused scarcity of D. cornea population and the polychaete O. bicornis disappearance from the shallow water bottoms. Invaders from the upper infralittoral Idotea baltica, Gammarus subtypicus and G. olivii occupied their niche and became mass species.
Rocky substrata forming only 0.3% of the total sea floor area of the Romanian shelf have included ecologically important benthic communities, the biocoenosis of the Mytilus galloprovincialis being the most important.
Hard substratum constituted the most complex environment in the benthic realm with the greatest diversity of fauna, including over 40% of the total identified species and 2.5% of the whole fauna stock of the Romanian littoral.
In the present decade, a survey in the benthos rocky zones indicated a slight decline in biodiversity, mostly in the crustacean community, which has been observed since the beginning of the 1980�����s. Twenty years ago, Jassa ocia and Erichtonius difformis accounted for 45% and 30% of the total abundance of amphipods, respectively. Research conducted between 1993 and 1998 revealed that E. difformis accounted for 12% while J. ocia 9% of the total amphipods abundance. Concerning the decapods, four crab species (Pachygrapsus marmoratus, Pilumnus hirtellus, Xantho poressa and Rhitropanopeus harissi tridentatus) were found in rocky zones. Both Pachygrapsus and Rhitropanopeus were still numerous, especially their juvenile individuals in the rocky zones in the southern littoral. Xanto poressa had a smaller distribution than in the 1980s. The large�����size decapods species, such as Crangon crangon, the shrimps Palaemon elegans and P. adspersus constituted mass species in the past. Now, P. adspersus is considered as endangered and rare species.
��Apart from eutrophication and pollution, the main cause of these changes was the reduction in macrophyte fields, mainly of the perennial alga Cystoseira barbata habitat. The range of vagile fauna had shrunk and there had been severe reductions in populations of phytofile species (Tiganus & Dumitrache, 1995). Another negative ecological impact was the penetration of the predator gastropod Rapana venosa, originating from the Sea of Japan known to be a predacious enemy for the littoral malacofauna. It firstly appeared in the Danube estuaries and rapidly spread southward and became a common element in shallow waters both on sandy and rocky bottoms (Gomoiu, 1972). This gastropod species was found most abundantly and frequently on rocky bottoms between 4 m and 10 m isobaths with a maximum density (up to 10 ����� 12 ind.m-2) at 8 m depth. Because of its high consumption of bivalves, especially Mytilus and Mya, it played a key role as natural biofilters.
The benthic communities of muddy bottoms have been influenced by numerous factors, including increased water turbulence and sedimentation. High load of alluvial deposits carried by the Danube River continually modified the substrata and induced instability.
Two subcoenoses in front of the Danube mouths at depths between 15 and 50 m included sandy-muddy type bottom (15�����30m) and muddy type bottom (30 - 50m depth) with mussels Mytilus galloprovincialis. Hypoxia events associated with frequent and intense phytoplankton blooms caused mass mortality and impoverishment of many species of these subcoenoses (Gomoiu, 1981, 1983). Out of 32 species existed at 10-30 m depth range in 1975-1977, 22 remained in 1979, and only 14 in 1980 (Tiganus, 1982).
The muddy biocoenosis was considered to be the richest biocoenosis in the entire sector containing 50 different types of organisms among which Mytilus was the most dominant between 1960 and 1965. The presence of Phyllophora field in front of the Danube mouths at depths of 40 m played a significant role on the enrichment of the benthic fauna. When Phyllophora populations had declined to the point of extinction, the biodiversity started degrading during the 1976�����1980; the most affected species became molluscs and crustaceans. Crustaceans reduced from 15 in 1977 to 2 in 1980 and molluscs declined from 20 to 4 over the same period. On the other hand, the populations of some opportunistic species have proliferated and become dominant in some communities such as: Mya arenaria, Neanthes succinea, Polydora limicola and Melinna palmata. For example, the polychaete worm M. palmata formed abundant populations and has become characteristic of communities at 15 ����� 30 m depths (Gomoiu, 1981, 1985; Tiganus, 1982, 1988). The benthic communities on the sedimentary substratum have become more homogenous and large areas have been dominated by these opportunistic species.
Along the Romanian littoral, the Modiolus phaseolinus biocoenoses was the most characteristic species on the bottoms from 55-60 m to 120 m. It covered an area of 10,000 km2, which roughly corresponded to 40% of the total Romanian continental shelf (Bacescu et al., 1971). Its maximum development took place between the Sulina�����Sf.Gheorghe (pre-Danubian area) and Mangalia (southern) sectors. Research conducted in 1970 indicated high density and biomass and a good trophic base for benthifagous fish. Measurements performed between 1970 and 1980 did not show any appreciable changes in the Modiolus phaseolinus muddy bottom, and it was the only stable biocoenoses as compared with shallow waters biocoenoses. The Modiolus biocoenosis was however degraded after 1990 that was identified by the reduction of macrozoobenthic organisms, particularly those less tolerant to pollution, from 36 in 1981-1982 to 33 between 1991 and 1995 and 23 in 2000-2001. As a result, opportunistic species were able to spread even in this community that have already dominated coastal communities and reduced total species number (Fig. 8.14). In general, the mean abundance and biomass of the deep benthic communities reduced from 7800 ind.m-2 and 233 g m-2 in 1981-1982 approximately five times in 2000-2001. This implies that the decline has begun in the early 1980s as a consequence of hypoxia (Gomoiu and Tiganus, 1990; Dumitrache, 1996/1997) even though this biocoenosis has not been further monitored after 2001.
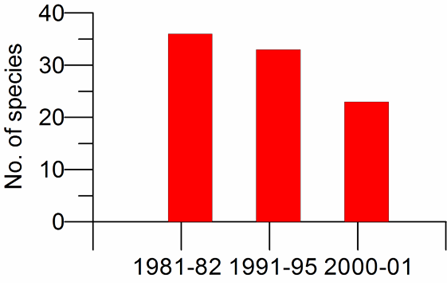
Fig. 8.14. Change in species diversity in the muddy bottom biocoenosis of Modiolus phaseolinus during 1981�����2001 that was the most characteristic biocoenosis along the Romanian coast from 55m to 120 m.
8.3.2. Peculiarities of zoobenthos during the present state of ecosystem
The pre-Danubian sector: The results of recent researches (Dumitrache and Abaza, 2004; Abaza et al., 2006a, 2006b) emphasized an improvement of the qualitative structure of the zoobenthic communities due to reduction in phytoplankton bloom frequencies and intensities. Taking into account the whole area from Sulina to Portitza (the northern sector of Romanian shelf), relatively high species diversity at depths between 15 to 50 m was registered. As compared with 20-to-24 species in the 1990s the macro-benthic fauna was represented by 26-to-44 species during 2000-2003, 49 species in 2005.�� The increase can be even higher since the samplings in 2004 and 2005 only covered the northern Romanian sector between 5 m and 20 m depths (Fig. 8.15).
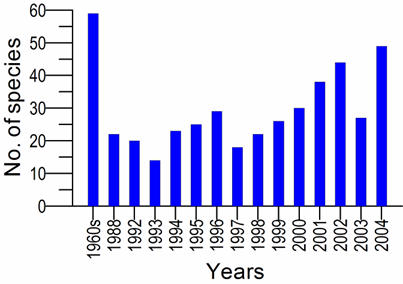
Fig. 8.15. The change in species diversity of the macrobenthic fauna in the pre-Danubian sector of Romanian coastline during 1993-2005.
Regarding the quantitative structure, a slight recovery was noted in abundances of both shallow and medium depth species in 2004 and 2005 with respect to the 1990s: their abundances increased from 2591 ind.m-2 to 3140 ind.m-2 at 15-30 m depths and from 2128 ind.m-2 to 4453 ind.m-2 at 30-50 m depths. Worms constituting 95% of the total density dominated quantitative structure. Among polychaetes, most dominant species were Melinna palmata (55%), Neanthes succinea (52%), and Polydora ciliata (50%). The average total abundance at 5-20 m depth range increased to 12186 ind.m-2 in 2005 due to the improvement of the bivalve Lentidium mediterraneum populations (Fig. 8.16). The high percentage of young specimens (with 1-3 mm length), which settled on the substratum at 5 m depths, suggests process of recovery in response to the improvement in environmental conditions.
Regarding to the biomass, it is difficult to compare the data collected at different months and different depths. The data for 2000-2003 showed a lower biomass value (144.0 g m-2) compared with 1990-1999 (450.0 g m-2) at depths between 10 and 30 m (Fig. 8.17). In this particular case, the soft clam (Mya arenaria) populations flourishing at the beginning of the 1970s diminished during the recent years and represented only 25% of total biomass. The decrease can be related to mortalities caused by adverse effects of hypoxia or bottom trawling on benthic organisms. In 5-20 m depth range, the average biomass increased from 289.0 g m-2 in 2004 to 796.0 g m-2 in 2005. Highest biomass belonged to the mollusks due to their well-developed populations. Among the mollusks, Lentidium mediterraneum, Cardium sp. and Anadara inaequivalvis were dominant in weight; the last one is an opportunistic, self-acclimatized species, appeared and spread extensively through the highly eutrophicated marine environment. Biomass of mussels (Mytilus galloprovincialis) communities on the muddy bottoms between 30 m and 50 m depth increased two-folds as well, because of the well-developed mollusc populations. In this area the mussels were present in large numbers dominated by small and medium size populations.
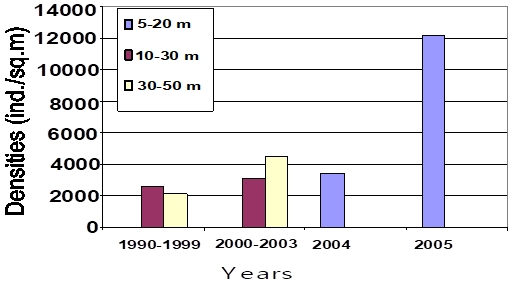
Fig. 8.16. Changes in the average abundances of macrozoobenthos at different depths in the pre-Danubian sector.
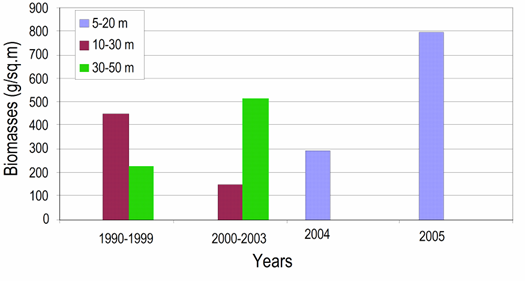
Fig. 8.17 ����� Changes in zoobenthic average biomass at different depths in the pre-Danubian sector.
The Constanta sector: Long-term investigations in the Constanta sector showed a recovery in terms of species diversity (Tiganus and Dumitrache, 1995). The species number reduced below 10 in 1995-1996 due to negative effects of intense and repeated phytoplankton blooms in spring-summer 1995. Beginning with 1997, weakening of intense algal blooms caused fast recovery and the biodiversity increased from 18 to 53 species in 2002 (Fig. 8.18).
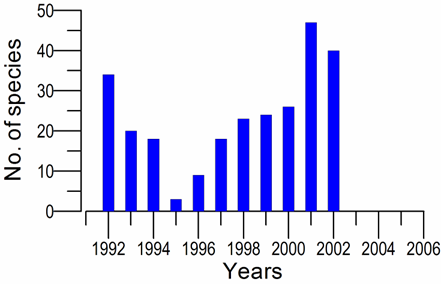
Fig. 8.18. Change of species diversity in the Constanta marine sector between 1993 and 2002.
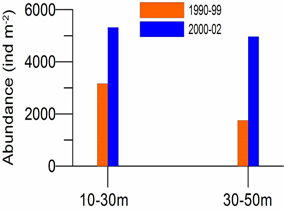
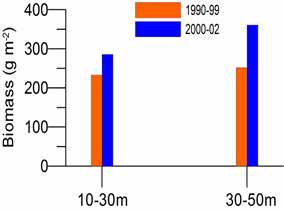
Fig. 8.19. Average zoobenthos abundance (ind. m-2, left) and biomass (g m-2, right) at 10-30m and 30-50m depth ranges in the Constanta sector of the Romanian shelf waters during 1990-99 and 2000-02.
From the quantitative point of view, the abundance increased 2-3 times in 2000-2002 with respect to the 1990s both at 10-30m and 30-50m depth ranges (Fig. 8.19, left). The revigoration tendency of the mollusk and crustacean populations was observed, even if the worms dominated density variation of entire macrozoobenthic population in this area. Similarly, in regards to the biomass the range of values between 286 g m-2 at 10-30 m depths and 361 g m-2 at 30-50 m depths obtained in 2000-2002 were slightly better than those registered in the 1990s (Fig. 8.19, right). In the Mytilus galloprovincialis mud community at 30-50m depths a slight recovery process of biomasses was observed; there are some zones where the mussel populations expanded under more favourable conditions.
The results of benthic ecological research in shallow bottoms (5-20 m) performed between 2003 and 2005 showed a slight reduction in the macro invertebrates fauna from 26 species in 2003 to 21 species in 2005. Similarly, the average abundance (13257 ind.m-2) was higher in 2003 than 2004 (6410 ind.m-2) and 2005 (9710 ind.m-2) (Fig. 8.20) that mostly dominated by Spio filicornis and Lentidium mediterraneum. The average biomass ranged between 327 g.m-2 in 2004 and 800-850 g m-2 in 2003-2005 (Fig. 8.22) that was due to a well-defined mollusks community dominated by Mya arenaria and Scapharca inaequivalvis (Abaza et al., 2006a, 2006b).
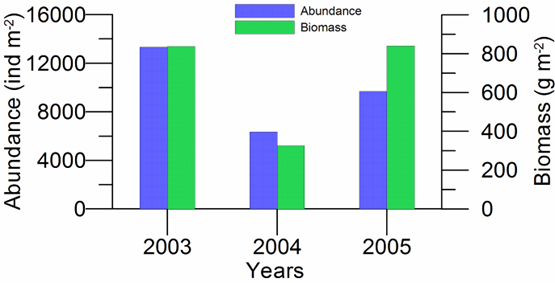
Fig. 8.20. Changes in the average abundance (ind m-2) and biomass (g m-2) of macrozoobenthic populations in the central (Constanta) sector at 5-20 m depth range.
The southern littoral zone: Species diversity in the southern sector of Romanian littoral zone between 15 to 50 m increased steadily in the present decade, and became almost double with respect to the 1990s (Fig. 8.21). The 2005-2007 period maintained relatively stable species number between 50 and 60. In particular, samplings from Tuzla to Vama Veche at depths to 20 m between 2003 and 2005 have revealed 73 different types organisms (Abaza et al., 2006a; 2006b). In the mud mussels����� community at 30 m to 50 m depths, maximum 36 macrobenthic species have been identified in 2000-2002 that comprised the members of muddy bottoms biocoenoses as well as iliophylic and opportunistic species. In the subsequent three years, only areas down to 20 m depths have been monitored. The most representative species were the polychaetes Terebellides stroemi, Prionospio cirrifera, Nephthys hombergi, Exogone gemmifera and Phyllodoce maculata, the bivalves Mytilus galloprovincialis, and Modiolus phaseolinus and the amphipods, Corophium runcicorne, Microdeutopus damnoniensis, Iphinoe elisae and Phtisica marina. The frequency of these common species ranged between 66% and 100 %. Other two species recorded with 83% frequency were polychaetes Polydora limicola and Melinna palmata. The new environmental conditions promoted abundant populations of the opportunistic polychaete species M. palmata.
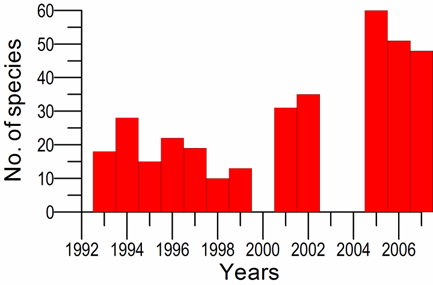
Fig. 8.21. Change of species diversity in the Southern (Mangalia) marine sector between 1993 and 2007.
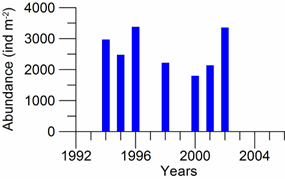
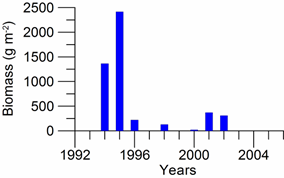
Fig. 8.22. Average zoobenthos abundance (ind. m-2, left) and biomass (g m-2, right) at 30-50m depth range in the Mangalia sector of the Romanian shelf waters during 1994-2002.
From the quantitative point of view, the benthic populations in the mud mussels����� community at 30 m to 50 m depths has been subject to moderate interannual variations changing between 2000-3000 ind.m-2 since the early 1990s (Fig. 8.22, left). These populations were dominated primarily by worms and secondarily by mollusks and crustaceans. The mollusks however dominated the biomass after the mid-1990s although their biomass remained appreciably low, less than 200 g m-2 (Fig. 8.22, right). The abundance at 0-20 m depth range increased from 12377 ind.m-2 in 2003 to 14113 ind.m-2 in 2005. The biomass increased from 1000 g m-2 in 2003 to a maximum of 5596 g m-2 in 2004 and then reduced slightly to ~4500 g m-2 in 2005 (Fig. 8.23). Relatively high abundance in this littoral zone indicates a better capacity of rehabilitation as compared to further offshore.
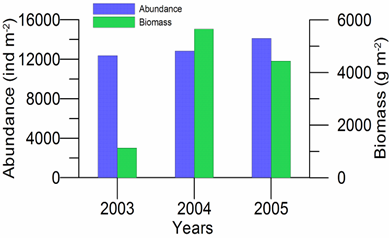
Fig. 8.23. Average abundance (ind. m-2) and biomass (g m-2) of macrozoobenthic populations in the southern sector at 0-20 m depth range.
Comparison of three regions: In terms of average biomass for the 2002-2006 period, the southern sector was three-to-four times superior to the others while the mean abundance is almost comparable to the central but twice better than the northern sector (Fig. 8.24a). The Shannon diversity index varied between 1.5 and 3.5 for all regions during 2002-2006, and implied moderate biodiversity for the central and northern sectors and slightly good biodiversity for the southern sector (Dumitrache et al., 2008). All three regions indicated better macrozoobethos characteristics when compared with the northwestern Ukrainian coastal waters (Fig. 8.7, 8.8). The organisms living in/on the sea bottom also suggested a rehabilitation tendency in terms of their diversity. The species number had a gradual increase in the Danube delta region up to 50 in 2004, comparable number in the central littoral zone and even better in the southern littoral zone (Fig. 24b). The eurioic forms (characterized by large ecological valence) however occurred with high frequencies in all three zones (Neanthes succinea, Polydora limicola, Melinna palmata, Ampelisca diadema and Mya arenaria). On the other hand, some species qualified as rare in the Black Sea Red Book, such as Apseudopsis ostroumovi, Caprella acanthifera and Xantho poressa were again identified in 2003.
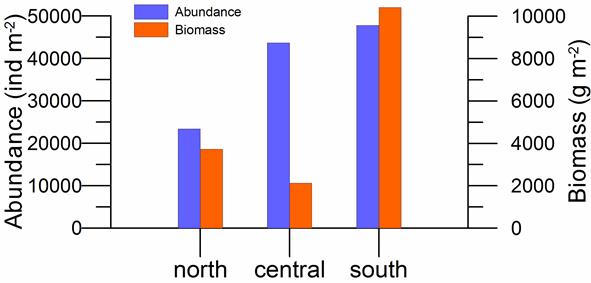
Fig. 8.24a. Average abundance (ind. m-2) and biomass (g m-2) of macrozoobenthic populations during 2002-2006 at 0-20 m depth range of the northern, central, southern sectors of Romanian litteral zone.
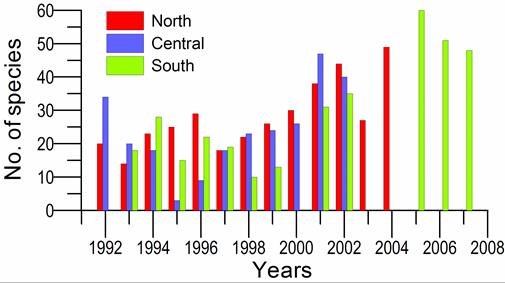
Fig. 8.24b. Change in number of macrozoobenthic species during 1992-2007 in the northern, central, southern sectors of Romanian litteral zone.
8.4. Bulgarian shelf area
The long-term changes in macrozoobenthic communities were examined by comparing recent data obtained along the standard monitoring network of the Institute of Oceanology, BAS (Fig. 8.25) during the summers of 1998-2002 (Stefanova et al. 2005, Todorova and Konsulova 2000) with the reference data from the ���œpristine���� period 1954-1957 of the Black Sea ecosystem (Kaneva-Abadjieva and Marinov, 1960) and the period of the most intensive anthropogenic eutrophication 1982-1985 (Marinov and Stojkov 1990).
8.4.1. Characteristics of major zoobenthic communities
The pool of samples collected during summers of 1998-2002 yielded 134 species and 5 taxa: Polychaeta (41 species), Crustacea (41 species) and Mollusca (38 species), Varia (3 anthozoans, 3 echinoderms, 4 ascidians, 2 pantopods, 1 phoronid, 1 cephalochordate), and the higher taxa included Turbellaria, Nemertini, Oligochaeta, Acarina, and Insecta. The hierarchical cluster analysis (Todorova and Konsuolova, 2000; 2006) differentiated five zoobenthic communities distributed on the Bulgarian shelf as given on the map shown in Fig. 8.26. Bathymetry and sediment type (Table 8.4) were identified as the important determinands of community structure and pattern.
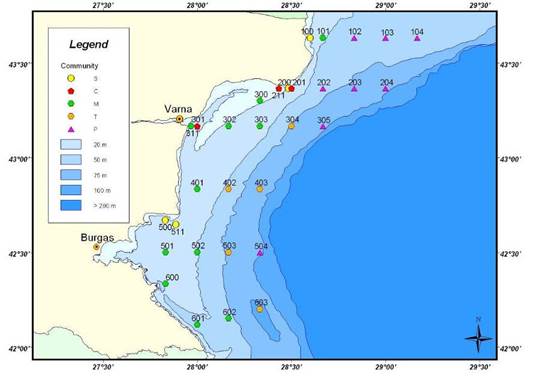
Fig. 8.25. Map of the studied area with sampling locations and communities as differentiated according to the cluster analysis: S ����� infralittoral sand community, C ����� infralittoral silt community, M ����� upper circalittoral silt community with Melinna palmata, T ����� impoverished circalittoral silt community, P ����� lower circalittoral clay community with Modiolula phaseolina.
The ���œinfralittoral sand community���� (S) is distinguished by the typical psamophylic polychaetes Prionospio cirrifera Wiren, 1883 and Protodorvillea kefersteini McIntosh, 1869 and the clam Chamelea gallina Linne, 1758 that contribute mostly to between-groups dissimilarity. The community is dominated in the abundance by Prionospio cirrifera ����� second order opportunist, tolerant to disturbance (Borja et al., 2000), Polydora ciliata Johnston, 1838 and oligochaetes ����� first order opportunists tolerant to hypoxia, colonizers of organically enriched sediments (Pearson, Rosenberg, 1978, Gray et al., 2002). The community is the most abundant and diverse assemblage on soft bottom habitats of the Bulgarian shelf (see Table 8.4). This fact stresses the importance of sandy bottom habitats for marine biodiversity conservation as the sandy bank ���œCocketrice���� (st. 511, Fig. 8.24) was declared as a protected area in 2001 by the Bulgarian Ministry of Environment and Waters. The bank was included into the network of European Marine Biodiversity Research sites established in order to address the climate change effects on species level (Warwick et al. 2003).
The ���œinfralittoral silt community���� (C) is dominated in the abundance by Heteromastus filiformis Claparede, 1864; Neanthes succinea Frey & Leuckart, 1847; Hydrobia acuta Draparnaud 1805. These have major contribution to within-group similarity and discriminate the assemblage against other soft bottom communities. Heteromastus filiformis is first order opportunist, pioneer colonizer of organically enriched sediments (Pearson, Rosenberg 1978), Neanthes succinea is tolerant to disturbance by organic enrichment (Borja et al. 2000, Simbura & Zenetos 2002) and Hydrobia acuta is common in organically enriched fine sediments in the Black Sea and Azov Sea, tolerant to episodes of hypoxia and presence of H2S (Tatishvili et al., 1968).
Table 8.4. Habitat features, average �� conf. lev. 95 % of the number of species (S), abundance, biomass, and Shannon-Wiener community diversity H' index of soft bottom macrozoobenthic communities on the Bulgarian Black Sea shelf, summer 1998-2002.
| Habitat/Community | Depth range (m) | Sediment type | S | Abundance(ind.m-2) | Biomass(g.m-2) | H' (log2) |
| Infralittoral sand (S) | 16-23 | sand | 37 �� 4 | 13500 �� 6291 | 2576 �� 2343 | 3.55 �� 0.29 |
| Infralittoral silt (C) | 12-26 | silt | 22 �� 6 | 6404 �� 2793 | 866 �� 1230 | 2.69 �� 0.36 |
| Upper Circalittoral silt (M) | 17-65 | clastic silt, silt | 28 �� 2 | 9923 �� 2206 | 420 �� 315 | 2.74 �� 0.15 |
| Impoverished circalittoral silt (T) | 64-93 | clay silt | 19 �� 3 | 1579 �� 381 | 21 �� 16 | 3.08 �� 0.39 |
| Lower circalittoral clay (P) | 60-103 | Calcareous��(shellson clay matrix) | 25 �� 4 | 4581 �� 3316 | 84 �� 40 | 2.87 �� 0.49 |
The ���œupper circalittoral silt community with Melinna palmata���� (M) is named after the terebellid worm Melinna palmata Grube, 1870 that ranks second in the abundance but has highest contribution to within-group similarity and is a key structural species. Its dense vertical tubes consolidate the sediment and determine the specific character of the habitat. The most abundant is Aricidea claudiae Laubier, 1967 considered as a species sensitive to anthropogenic disturbances (Borja et al. 2000, Simbura & Zenetos 2002). ���œMelinna palmata silt���� is one of the communities with widest spatial distribution on the Bulgarian shelf (Fig. 8.26).
In terms of species composition, the ���œimpoverished circalittoral silt community���� (T) is transition between ���œMelinna silt���� and ���œphaseolina clay���� communities. The assemblage is dominated by Melinna palmata, but its average abundance is 4.5 times lower than ���œMelinna silt community����. Increased occurrence of some species typical of deeper habitats such as Amphiura stepanovi D'yakonov, 1954 and Modiolula phaseolina Philippi, 1844 was observed in this community. Community impoverishment is manifested both in significant abundance/biomass decrease and species richness decline (Table 8.4).
The ���œlower circalittoral clay community with Modiolula phaseolina���� (P) is discriminated from the rest of the assemblages by the mussel Modiolula phaseolina with highest contribution to within-group similarity and dominant in the abundance. The habitat is characterized by bulk of dead shells and shelly detritus of the same species, hypoxia and increased salinity in comparison to coastal habitats. Other discriminating species are Amphiura stepanovi and Notomastus profundus Eisig, 1887.
Mussel beds typical of the Bulgarian shelf are not differentiated by the multivariate analysis of similarity as a distinct community assemblage. This is due to the continuous species composition alteration of mussel bed associations in correlation with bathymetry and sediment type.
8.4.2. Spatial patterns of diversity, abundance and biomass distribution
The species richness decreased from shallow coastal sites to deeper offshore sites (Fig. 8.27). Species richness of benthic macrofauna had the second strongest negative correlation with silt-clay percentage in sediments after the strongest positive correlation with oxygen saturation in bottom water Todorova (2005). On the other hand, benthic diversity was weakly correlated with trophic supply. The observed spatial pattern of diversity is therefore basically driven by the depth gradient of decreasing oxygen concentration and hypoxia that are determined by regional hydrochemical characteristics, and further modified by sediment heterogeneity especially at the shallow habitats. The infralittoral sand habitat supported the most diverse zoobenthic community as evident by the highest average number of species and highest Shannon-Wiener index (Table 8.4). Silty and clay habitats were less diverse compared to sand. ���œUpper circalittoral silt community with Melinna palmata���� (M) was the richest in species among fine sediment habitats; however increased dominance of few polychaetes yields somewhat lower Shannon-Wiener index (Table 8.4). Minima of Shannon-Wiener index at coastal sites (st. 211, 301, 501) are due to the dominance of Melinna palmata and/or Heteromastus filiformis, while in the offshore area (st. 102, 204, 504) the observed minima are due to the dominance of Modiolula phaseolina (Fig. 8.26).
The abundance and biomass decrease from shallow coastal to deeper offshore area and from north to south (Fig. 8.27 and Fig. 8.28). The decrease along the depth gradient is related to the reduction in trophic supply offshore and significant hypoxia at benthic habitats deeper than 90 m, while the decrease from north to south along shallower coastal zone correlates with reduced primary productivity at increasing distance from the Danube discharge zone.
The abundance structure (Fig. 8.27) is commonly dominated by the polychaetes, except for the ���œlower circalittoral clay community with Modiolus phaseolina���� where the predominance of M. phaseolina increases the molluscs share. Most of the observed abundance maxima occur in the ���œupper circalittoral silt community with Melinna palmata���� due to M. palmata and Aricidea claudiae and in the ���œinfralittoral sand community���� due to Prionospio cirrifera and Polydora ciliata. Extensive literature data showed that organic enrichment of sediments due to pollution and eutrophication resulted in an increase in abundance of opportunistic polychaetes largely due to their ability to continuously colonise the newly available sediment and thus overcome smothering and hypoxia episodes (Gray et al. 2002; Pearson & Rosenberg, 1978). Excessive abundance of polychaetes along the Bulgarian Black Sea coast suggests over-stimulation of benthic biota due to increased productivity of the marine ecosystem and organic enrichment of the sediments.
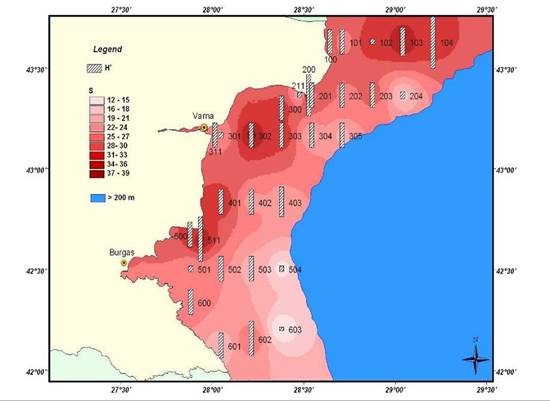
Fig. 8.26. Distribution of the average number of macrozoobenthos species (S) on the Bulgarian shelf and average Shannon-Wiener community diversity (H') index at sampling stations, summer 1998-2002.
Considerable spatial variability of biomass that was caused by patchy distribution of the dominant species (Mytilus galloprovincialis) makes difficult determination of its average value within statistically acceptable limits (Table 8.4). The biomass structure (Fig. 8.28) is typically dominated by the bivalve mollusks, except for the ���œimpoverished circalittoral silt community����, which is dominated by the polychaetes due to almost complete absence of mollusks in the community composition.
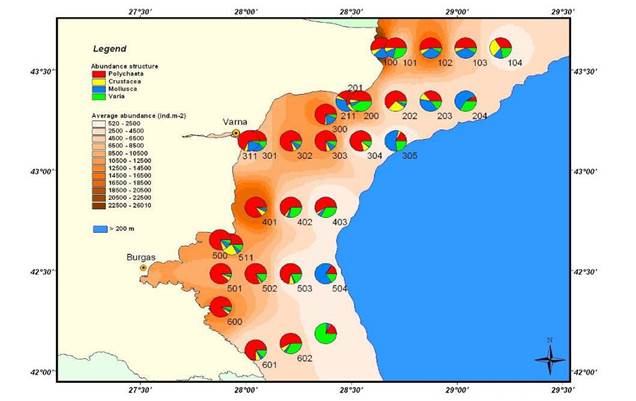
Fig. 8.27. Distribution of average macrozoobenthos abundance on the Bulgarian Black Sea shelf and abundance structure at sampling stations, summer 1998-2002.
8.4.3. Assessment of recent ecological state
The ecological state of benthic macrofauna on the Bulgarian shelf is assessed according to the AZTI Marine Biotic Index (AMBI) (Borja et al. 2000) that provides an ���œecological state classification���� in the range from 0 to 6 in terms of the percentages of abundance of the five ecological species groups according to their sensitivity to stress/pollution. The species are classified as very sensitive to organic enrichment and present under unstressed conditions (the group I), insensitive to enrichment and always present in low densities with non-significant variations with time (the group II), tolerant to excess organic matter enrichment with densities stimulated under organic enrichment (the group III), the second-order opportunistic species (the group IV), the first order opportunistic species (the group V). Opportunistic species are those that can take advantage of adverse conditions and thrive in locations where more sensitive species will not survive; they are capable of rapid colonisation and recovery. First order opportunists are species which first colonise the habitat after mass mortality episodes, while second order opportunists come next.
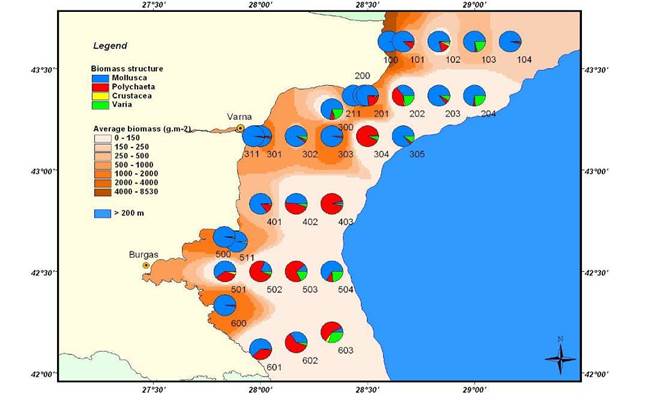
Fig. 8.28. Distribution of average macrozoobenthos biomas on the Bulgarian Black Sea shelf and biomass structure at sampling stations, summer 1998-2002.
The following threshold values are set to distinguish between five categories of benthic disturbance in consistent with the ecological state (ES) classification scheme established by the European Water Framework Directive (WFD): AMBI �� 1.2 Undisturbed community (High ES), 1.2 >AMBI �� 3.3 Slightly disturbed (Good ES), 3.3 >AMBI �� 4.3 ��Moderately disturbed (Moderate ES), 4.3 >AMBI �� 5.5 - Heavily disturbed (Poor ES), 5.5>AMBI �� 6 Extremely disturbed and azoic (Bad ES).����
At few coastal stations in the northern part of the shelf (st. 101, st. 200, st. 202) the ecological state is moderate (Fig. 8.29). Increased community disturbance probably reflects higher level of the eutrophication impact as the distance to the Danube nutrient source decreases. Offshore sites (except st. 603) manifest better ecological state (high at most of the stations, e.g. st. 204, 305, 504) compared to coastal sites. The pattern of improved ecological state offshore evidently reflects decreasing organic enrichment in the open Black Sea area. Despite the natural hypoxia, the environment at deeper offshore habitats is more stable and predictable and less exposed to anthropogenic impact compared to coastal sites, therefore the community is undisturbed or only slightly disturbed as implied by AMBI. The predominance of ecologically conservative bivalve M. phaseolina in the abundance/biomass also indicates low level of environmental impact. AMBI, in contrast to diversity indices, is independent of the habitat type, therefore more sensitive in reflecting the anthropogenic impact. On the contrary, the diversity indices may be used for ecological state assessment only if their deviation from reference values, expected under non-degraded conditions in similar habitat types, are known.
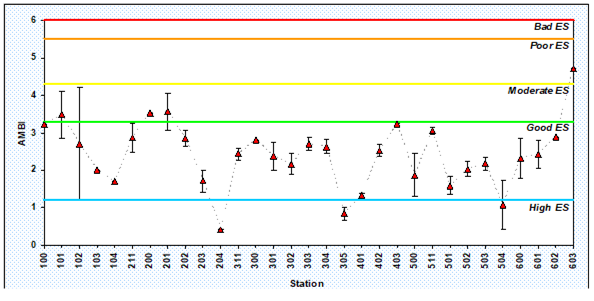
Fig. 8.29. AMBI values (mean �� st. error) at sampling stations (according to Fig. 8.26) on the Bulgarian Black Sea shelf, summer 1998-2002 and thresholds for five ecological state categories.
The ecological state classification provided by AMBI manifests lack of undesirable disturbance of benthic communities in the Bulgarian Black Sea area and gives an encouraging sign of ecosystem recovery after a period of severe decline during the 1980s.
8.4.4. Long-term trends in species diversity, abundance and biomass
Species composition: Total 57 taxa of macrozoobenthos organisms were found in 2001-2003 in the Bulgarian Black Sea. The number of species varied from 54 in 2001 to 47 in 2002 and 57 in 2003. These changes were related most probably to over-fishing of Mollusca and Crustacea species and the negative effect of bottom trawling activities on the bottom communities during the commercial harvesting of Rapana thomasiana.
The species composition comprised mainly Polychaeta, Mollusca, Crustacea and ���œDiversa���� groups. The majority of species (about 20) belonged to Polychaeta which included some dominant species (Melinna palmata, Nephthys homergii, Nephthys cirrosa) which were resistant to strong changes in environmental conditions. The second dominant group Mollusca was presented by 17 species, like Mytilus galloprovincialisand, Mactra subtruncata. Crustacea was mainly represented by their dominant species Ampelisca diadema. Polychaeta had more dominant share (43 %) during the first half of the years and slightly decreased towards the second half (35%). Crustacea (18 %-26%) showed increasing tendency from winter to autumn whereas Mollusca (30-31%) and Diversa (8-9%) species numbers remained steady throughout the year.
Comparison of the recent and historical data sets reveals decreased diversity of benthic macrofauna during the period of anthropogenic eutrophication (1982-85) in all key taxonomic groups (Fig. 8.30a). The polychaetes regained their species richness during the recent period (1998-2002); however, the recovery of the crustaceans, despite significant increase, was incomplete. The current mollusks����� richness also exceeded the level of the ���œpristine���� period. Partly this is due to the immigration and naturalisation of several new settlers in the Black Sea such as the predatory gastropod Rapana venosa, and the bivalves Anadara inequivalvis (Bruguiere, 1789) and Mya arenaria Linne, 1758. Their expansion was determined by the rich trophic resources available to the predators and suspension-feeders and by hypoxia tolerance of both alien bivalves (Zaitsev & ���zt��rk 2001).
As the total number of species analysed depended on the sampling effort, the taxonomic structure is more objective indicator of community composition alterations. The observed changes are characterised by continuous increase of the mollusks����� share over the three compared periods, increase of the polychaetes share during the eutrophication period and recovery in the recent period, decrease of the crustaceans share during the eutrophication period and incomplete recovery during the recent period (Fig. 8.30b).
The temporal trends in the taxonomic structure and species richness can be interpreted in the context of tolerance of crustaceans, polychaetes and mollusks to oxygen deficiency. The crustaceans are the most sensitive group to oxygen deficiency, the polychaetes are less sensitive and the bivalves are the most tolerant (Nilsson & Rosenberg 2000, Rosenberg et al. 1991). Recurrent hypoxia/anoxia, associated with extensive phytoplankton blooms during the period of anthropogenic eutrophication, probably caused the observed sharp decline of crustacean richness, whereas the mollusks and pollychaetes increased their relative share. The recovery of the crustaceans and polychaetes comparable to the ���œpristine���� state therefore suggests an improvement in hypoxia conditions during the recent period. However, the increase of mollusks share was probably caused by ample organic load to the bottom that caused episodes of oxygen deficiency that reduced other oxygen sensitive species (Moncheva et al. 2001).
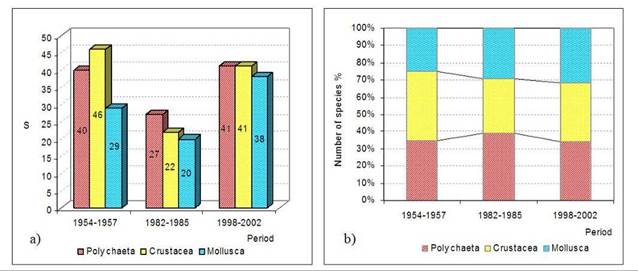
Fig. 8.30. Alterations in (a) total number of species (S) and (b) taxonomic structure of benthic macrofauna over the ���œpristine���� period 1954-1957, the intensive anthropogenic eutrophication period 1982-1985, and the recent period 1998-2002.
Density and biomass: The average multi-annual abundance of macrozoobenthos during 2001-2003 was 1518 ind.m-2 that dropped to minimal values 50 ind.m-2 in 2002 at 20 miles offshore Cape Emine, and attained its maximal value 5520 ind.m-2 in front of Cape Emine in November 2001. The multi-annual average density in front of the Capes Galata and Emine was 1130 ind.m-2 for 1992-2000 and became 1037 ind.m-2 in 2001-2003. According to the average data for 2001-2003, the main share belonged to Polychaeta (65%) because of their successive outbursts, followed by Mollusca (15%) and then ���œDiversa���� and Crustacea (10%) (Fig. 8.31b).
When compared with the historical data (1954-57), the total average abundance did not rise during the eutrophication period 1982-85, whereas more than 10-fold increase was evident for the recent period (Fig. 8.31a). The overwhelming portion of this abundance increase belonged to Polychaeta. The change in abundance structure comprised the shift from predominant Mollusca species (60%) during the pre-eutrophication period to the current state of opportunistic polychaetes species (65%) (Fig. 8.31b). Thus, Mollusca share decreased by four times and Polychaeta share increased two-folds. High abundance of opportunistic deposit-feeding polychaetes during 1998-2002 indicates excessive organic load to sediments.
The average multi-annual macrozoobenthos biomass in 2001-2003 along the Bulgarian Black Sea coast was 452.253 g.m-2 and encompassed the range 0.31-9803.1g.m-2. The extremely high biomass was mainly due to high Mollusca Mytilus galloprovincialis abundance is some samples collected at some of its patchy sources along the Bulgarian coast. Furthermore, this mean biomass was almost identical to its 1992-2000 average value of 434 g.m-2. Mollusca biomass was slightly higher than the previous period which may be considered as a positive sign in the evolution of benthic community along the Bulgarian waters, and likely connected to the decreasing tendency of hypoxic conditions, decrease in the Rapana abundance due to its commercial harvesting, and diminishing density of Mnemiopsis.
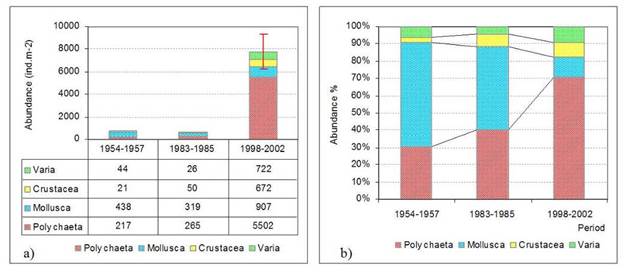
Fig. 8.31. Alterations in (a) total abundance and (b) percent abundance structure for the ���œpristine���� period 1954-1957, the intensive anthropogenic eutrophication period 1982-1985, and the recent period 1998-2002.
According to Pearson and Rosenberg (1978) benthic succession model in response to organic enrichment, the total species number and biomass increase faster than the total abundance as organic load increases above background levels. For further increase in organic load, species diversity starts decreasing, biomass levels off, and abundance raises more rapidly. Additional organic load first causes a sharp peak in abundance with some corresponding increase in biomass and then a rapid drop in both abundance and biomass to background levels due to deteriorated oxygen conditions. Assuming that this model applies to the Bulgarian shelf benthic structure, the present state corresponds to the phase ���œincrease in abundance and level off biomass���� prior to the collapse.��
8.5. Turkish Shelf waters
Macrozoobenthic populations of the Turkish littoral and sublittoral zones have been investigated only partially so far. For the last 45 years, the studies of zoobenthic organisms carried out mostly within the Bosphorus-Black Sea junction region (Demir, 1952; Dumitresco, 1960, 1962; Rullier, 1963; Caspers, 1968; Kiseleva, 1981; Uysal et al., 2002). These studies were then extended more recently to the rest of the southern coastal waters (Kocataş and Katağan, 1980; Ateş, 1997;�� Mutlu et al., 1992; 1993; Sezgin et al., 2001; G��nl��g��r, 2003; ���ulha, 2004; ���zt��rk et al., 2004; ���ınar & G��nl��g��r-Demirci, 2005; Kırkım et al., 2007; Sezgin& Katağan, 2007; Bilgin et al., 2007; Sezgin et al., 2007). On the basis these studies, macrozoobethos species richness along the Turkish coast and the indicator species list are given in Table 8.5 and Table 8.6, respectively. ��
According to the Table 8.5, out of 10 different groups, Polychaeta, Mollusca and Amphipoda accounted for 76% of the total abundance, followed by Decapoda, Isopoda, Echinodermata, Cumacea, Porifera, and others. 385 macrobenthos species were registered during 1980-2000, and this number increased to 419 in 2000-2007 (Table 8.5). Therefore, no evidence exists for the reduction of species richness in the Turkish Black Sea coastal zone during the last 25 years. Moreover, bottom fauna was enriched in 2000-2007 due to (1) introduction of some species that were�� previously recorded only in the Bosphorus region, (2) introduction of alien species, (3) Mediterranization (climate change effects), (4) more detailed studies to cover neglected geographical locations or habitats,�� (5) recovery of ecosystem health. However, contrary to the steady character of species richness, abundance and biomass of�� some species were dramatically changed. The decline in populations of many benthic invertebrates (Crustacea, Mollusca, Polychaeta), which play a significant role in the food chain of the benthos consuming fish, has been clearly noted in the last two decades. The first visible changes in the structure of coastal benthic communities in southern coast of Black Sea were the incresae in density of some Mollusca species (such as Patella spp., Rapana, Chamelea) during the last 10 years. Moreover, the replenishment of juvenile bivalve populations was found to depend on the strength of Mnemiopsis-Beroe interactions in the pelagic zone and therefore subject to considerable interannual variations. Better resistance of Anadara ineaquivalvis to environmental stresses than the native species permitted its population to become a dominant group at the 10-30 m depth range.
A comprehensive zoobenthos survey conducted on soft bottoms along the Turkish coast in May-July 1999 (Kirkim et al., in pres) revealed that the depth range 10�����25 m, ��mostly consisting of fine-to-medium sandy bottom sediment, was dominated by polychaete (M. palmata) and molluscs (C. gallina,�� L. mediterraneum, L. divaricata). The total average abundance of zoobenthos was 1524 ind.m-2 and their biomass 109 g m-2 (Kırkım et al., unpublished data). At the 25�����50 m depth range, the composition of bottom sediments slightly changed to sand-mud composition. The number of recorded zoobenthic species decreased to 74. and their ��total average abundance and biomass was 2134 ind.m-2 and 62.4 g m-2, respectively. Within 50-80 m depths, the bottom sediments consisted of the combination of mud, clay and dead shells. The species diversity was the poorest; a total of 52 species recorded among which polychaetes and some echinoderms the most abundant. The total average abundance and biomass of zoobenthos was 1171 ind.m-2 and 41 g m-2 , respectively (Kırkım et al., unpublished data). In this study, Low dissolved oxygen values of lower layer and soft substratum of sediment resulted in wide distribution of the opportunistic polychaet M. palmata (the mean abundance of 450 ind. m-2) that were adapted to such conditions. Molluscs were among the second abundant taxa, accounting for 32% of the total number of macrofaunal species. The most common bivalve, C. gallina (69%) had a highest frequency value of the 39 stations, followed by the bivalve P. rudis (64%), the gastropod Cyclope neritea (Linne, 1758) (59%) (Kirkim et al., unpublished data).
Table 8.5. Species richness of zoobenthos over the Black Sea and along the Anatolian coast (Sezgin et al., unpublished data)
| Taxon | The Black Sea | Turkish Black Sea coastal zone | ||
| 1980-1990s | 2000-2007 | For all timeobservations | ||
| Polychaeta | 308 | 112 | 120 | 120 |
| Mollusca | 177 | 103 | 115 | 115 |
| Amphipoda | 104 | 75 | 86 | 86 |
| Decapoda | 59 | 29 | 31 | 31 |
| Isopoda | 34 | 13 | 14 | 14 |
| Echinodermata | 27 | 13 | 14 | 14 |
| Cumacea | 26 | 12 | 13 | 13 |
| Porifera | 33 | 12 | 11 | 12 |
| Tanaidacea | 6 | 6 | 6 | 6 |
| Anthozoa | 6 | 4 | 3 | 4 |
| Ascidacea | 10 | 3 | 3 | 3 |
| Cirripedia | 7 | 2 | 2 | 2 |
| Sipuncula | 1 | 1 | 1 | 1 |
| Total | 798 | 385 | 419 | 421 |
Harvesting of the bivalve Rudipates decussatus by dredging the mediolittoral zone damaged the benthic community and destroyed fish habitats, particularly Solea and Scophthalmus. Some important molluscs (e.g Donax sp., Turitella sp., Mactra sp.) were under the threat due to coastal degragation and destruction. The dredging of sand from the sea also destroyed the benthic habitats along the Turkish coast (���zt��rk, 1998). Illegal bottom trawling for Rapana venosa harvesting has raised ecological concerns with respect to the benthic communities and especially the mussel beds. The population decline of the habitat-structuring species Mytilus galloprovincialis in the impacted areas was accompanied by degradation of the associated benthic community from "mussel bed" type to "silt bottom" type dominated by opportunistic polychaetes and oligochaetes. The mollusc species M. arenaria replaced the dominant species Lentidium mediterraneum in the coastal sandy strips and thus affected negatively biodiversity of the Black Sea ecosystem. On the other hand, the high biomass of M. arenaria provided food for the benthic fish and coastal birds.
Table 8.6. Some indicator zoobenthic species in the southern Black Sea.
| Species | Description |
| CRUSTACEA | |
| Corophium acutum | higher abundance under increased pollution |
| Corophium acherisicum | |
| Ericthonius brasiliensis | |
| Jassa marmorata | |
| Hyale crassipes | |
| Hyale pontica | |
| Leptochelia savignyi | |
| Idotea baltica basteri | |
| Shaeroma serratum | |
| Tanais dulongii | sensitive species to hypoxia; indicators of clean waters |
| Elasmopus spp. | |
| Crangon crangon | |
| POLYCHAETA | |
| Capitella capitata | an indicator of organic pollution |
| Malacoceros fuliginosus | |
| Neanthes caudate | |
| Neanthes succinea | |
| Ophiodromus pallidus | |
| Prionospio (Minuspio)��Multibranchiata | |
| Schistomeringos rudolphi | |
| Hydroides elegans | |
| Syllis prolifera | an indicator of clean waters |
| MOLLUSCA | |
| Lentidium mediterraneaum | higher abundance in organic rich environments |
| Mytilus galloprovincialis | |
| Mytilus edulis | Species resistant to severe hypoxia |
| ALGAE | |
| Ulva lactuca | higher biomass�� in organic rich environments |
| Enteremorpha linza | |
| Cystoreira spp. | an indicator of clean waters |
| SEAGRASS | an indicator of clean waters |
| Zostera marina | |
| Zostera noltii | |
Decapod cructaceans Crangon crangon and Paleamon spp. biomass and denstiy also decreased in last 10 years. An exception is Mercierella enigmatica (= Ficopomatus enigmaticus) (Polychaeta), whose density has increased; however, this species grows on coastal substrates and is inaccessible for the benthos consuming fish. Presently, domestic and chemical pollution is the main factor controlling the state of macrophytobenthos along the southern Black Sea coastal waters.
Available observations appear to indicate that eutrophication and different survival ability of benthic species in hypoxic conditions played an important role in the development and formation of macrobenthic communities. It appears that the invasion of Beroe ovata in 1999 did not play any major role for either the recovery of benthic communities or the development of a new stable structure. On the contrary, disturbing quasi-stability of the system, the community started experiencing more pronounced fluctuations in both abundance, biomass and species structure. On the other hand, the Mediterranization process or invasion of of the system by new species continued.
8.6. Georgian shelf area
Marine Ecology and Fisheries Research Institute (MEFRI) and Georgian Fisheries Trust data focused on monitoring the distribution of invasive species starting by 1949. These data sets suggested that Rapana invasion caused sharp decline in the oyster Ostrea edulis stock due to the presence of roughly 30 Rapanas per 1 live oyster. The data in 1950 further showed considerable spreading of Rapana along the entire Georgian coastal waters. This was followed by the reduction of other commercial mollusks as the abundance of Rapana continued increasing.
In 1978-1979, the new opportunistic species filtrating mussel Cunearca cornea was found initially with sizes 1.0-2.5 cm, and 6-8 cm individuals in the vicinity of the Chorokhi River mouth. This bivalve was especially abundant on the Anaklia bank where mussel collectors were installed in 1978-80. Presently, Cunearca cornea is widely distributed in Georgian waters (Gogmachadze & Mickashavidze, 2005).
The last study of benthic communities was conducted in 2003-2004 on a seasonal basis by monitoring 16 stations along the Georgian coast (Table 8.7). In these studies, new exotic species Anadara inaequuivalvis and Mnemiopsis leidyi were found together with significant changes in zoobenthos biodiversity in comparison with previous data (Gogmachadze & Mickashavidze, 2005; Mickashavidze, 2005). Out of 65 macrozoobenthos species recorded, 27 were Molluscs (41%), 18 Crustacean (28%), 20 Polychaeta (31%). Both the zoobenthos species diversity and total abundance were highly variable regionally and seasonally (Fig. 8.32). The species diversity increased as compared to 1990 for all these groups (Fig. 8.33).
������
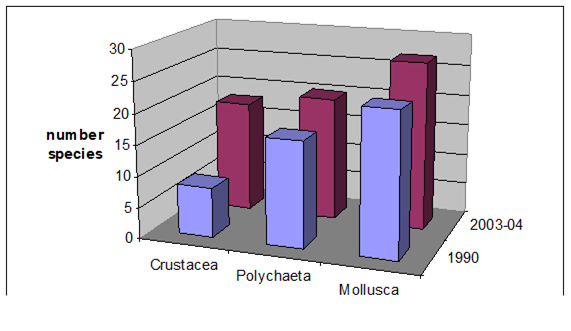
Fig. 8.33. Species number of main macrozoobentic group registered in 1990 and 2003-04 observations along the Georgian coast.
��������
Table 8.7. Quantitative characteristics of the benthic communities in Georgian Black Sea waters in 2003-05.
| Area | Substrate | Abundance (min-max) ind.m-2 | Biomass (min-max) g.m-2 | SpeciesIndex(min-max) | Dominant species |
| Kvariaty region | Sand | 100-14960 | 16.9-123.5 | 0.8-1.8 | Chamelea gallina, Lentidium mediterraneum, Mytilaster lineatus, Diogenes pugilator, Gammarus subtupicus, B. improvisus |
| Sand (6-10m) | 280-14540 | 8.1-169.9 | 0.2-2.0 | Nephtys longicornis, Chamelea gallina, Rapana thomasiana, Diogenes pugilator, Balanus improvisus | |
| Kvariati-Gonio��Area | Sand (6-10m) | 2040-11140 | 60.3-126.0 | 0.4-2.0 | Nephthys longicornis, Chamelea gallina, Lentidium mediterraneum, Mytilaster lineatus,Balanus improvisus |
| Between the mouths of��river Chorokhi��and�� river Khorolistskhali | gray clay1 | 110 | 1.1 | 0 | Heteromastus filirormis, |
| yellow sand | 260-820 | 3.45-87.1 | 0.8 | Rapana thomasiana[1],Callianassa truncate | |
| yellow sand | 134-320 | 0.74-9.0 | 0.3 | Melinna palmate; Chamelea gallina | |
| gray sand | 2720-11280 | 6.73-139.1 | 0.4-1.6 | Lentidium mediteraneum | |
| gray sand | 540-2720 | 10.9-70.6 | 0.4-1.2 | Lentidium mediteraneum | |
| Sand | 2480-5500 | 2.6-83.0 | 0.7-1.3 | Lentidium mediteraneum | |
| Near to the River Korolistskali | 920-2380 | 3.09-124.5 | 0.8-1.5 | Nephthys longicornis, Melinna palmate; Chamelea gallina, Ciclope donivani, Lentidium mediterraneum; Cumela pugmata, Ampelisca diadema | |
| Batumi Port | Sand | 140-2260 | 9.8-46.4 | 0 | Chamelea gallina�� |
| Black silt with smell of oil | 300-3840 | 0.2-5.4 | 0.1-0.2 | Ceritidium pusillum, Melinna palmate | |
��In autumn 2003 strong underwater current was registered, the benthic samples were absolutely void of any species.
2 The main part of biomass is formed by molluscs Rapana thomasiana and Crustacea Callianassa truncate, 50.6 and 34.4 g/m2 respectively.
8.7. Russian Shelf Waters
The data presented for the Russian coastal waters of the Black Sea are based on the materials collected during seasonal surveys of the R/V ���œAkvanavt���� in 2001-2007 (Table 8.8). During every survey 22-54 stations were visited and five grab samplings were collected at each station at depth range from 10 to 45 m (Fig. 8.34). The previous studies (Chikina and Kucheruk, 2004; 2005) indicated that the northeast Black Sea coastal waters were classified in two different regions according to the state of benthic communities: the first one extends from Kerch Strait to Anapa in the northern sector, and the second one from Gelendjik to Adler in the southern sector that encompasses almost 90% of the Caucasian coastal ecosystem (Fig. 8.34). Most of the changes in zoobenthic communities during the last 10 years took place noted in the southern (Gelendjik-Adler) region, whereas the Anapa�����Kerch Strait region remained fairly stable.
Table 8.8. Number of stations made during surveys on R/V ���œAkvanavt����
| Year | Month | Number of stations |
| 2001 | August, September | 53 |
| 2002 | April, June | 54 |
| 2003 | December | 40 |
| 2004 | May | 39 |
| 2005 | May | 31 |
| 2006 | May | 22 |
| 2007 | May | 38 |
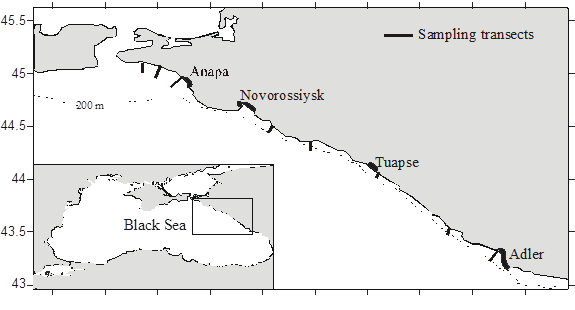
Fig. 8.34. Location of sampling transects in 2001-2007.
According to the studies in 1957, 1963, 1968 (Kiseleva, 1967, 1981; Kiseleva and Slavina, 1965, 1966) and in 1980 (Nikolaenko and Povchun, 1993), the species composition and quantitative characteristics of macrozoobenthos possessed a stable structure until the 1950s. Shallow waters with sandy bottom (< 30 m) were inhabited predominantly by bivalve Chamelea gallina. This community was taken over by Mytilus galloprovincialis community at depths of 35-40 m, and Modiolus phaseolinus community at depths deeper than 60 m. This benthic community structure has then been altered when the carnivorous gastropod Rapana venosa invaded the region in 1947. Its first impact was to eliminate oyster banks, bivalves Ostrea edulis, Chlamys glabra and Mytilus galloprovincialis. The niche has then been filled by small bivalves Gouldia minima at intermediate depths. This bivalvia having better reproduction and growth capabilities provided sufficient food resource and thus provided Rapana to settle into the regional biocoenosis permanently and to expand into shallower depths where Chamelea gallina inhabited (Kiseleva, 1967, 1981; Kiseleva & Slavina, 1965, 1966). Later on, a new alien opportunistic bivalve species Anadara inaequivalvis invaded the system. But, neither Rapana nor Anadara imposed critical predation pressures on the regional benthic ecosystem structure. In the mean time, the Chamelea gallina biocenosis was able to promote higher production in response to moderate level eutrophication and its biomass increased from ~80 g m-2 in the 1950s to ~250 g m-2 in the 1980s prior to the population outburst of Mnemiopsis (Fig. 8.35). The bivalves Pitar rudis and Anadara inaequivalvis constituted subpopulations of this biocenosis with lower biomass and abundances. The predator Rapana also revealed low biomass less than 50 g m-2 at 10-30 m depth range.
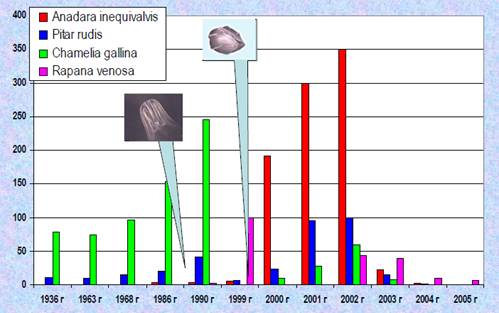
Fig. 8.35. Long-term changes in biomass of dominant macrozoobenthic species at 10-30 m depth range in the southern Caucasian coastal zone.
The outburst of Mnemiopsis after 1988 affected the food web structure by reducing thickness of the euphotic zone and increasing organic material sedimentation rate and reinforcing oxygen deficiency of subsurface levels and thus bringing the lower boundary of phytal zone to shallower depths (Alekseev & Sinegub, 1992). The belt of Cystoseria associations was shifted simultaneously to 10-12 m depths, Chamelea gallina and its successor Gouldia minima at the depth range of 20-30 m and Mytilus galloprovincialis at the depth range of 30-50m completely disappeared.�� Chamelea gallina dominance was then confined to the narrow coastal belt shallower than 11m. Heavy Mnemiopsis predation on bivalve larvae limited settlement of young bivalves whereas adult bivalves were consumed by the predator gastropod species Rapana. Consequently, macrozoobethic communities within 5-30 m coastal zone have been degraded seriously during the 1990s.�� In 1999, the mean Rapana biomass and abundance reached at 100 g m-2 and 50 ind. m-2, respectively. But its population was aggregated at shallower sandy bottoms (5-15 m) and no Rapana settlement was observed at depths deeper than 15m.
The collapse of Mnemiopsis in 1998-1999 triggered substantial changes in the macrozoobethic community structure. Reduction of its predation strength on bivalve larvae in 1999 allowed for mass settlements (on the order of thousands) of Chamelea gallina larvae and juvenile at 10-18m depth range and of Anadara inaequivalvis at 20-25 m in 2000, whereas such settlements was less than 100 ind.m-2 prior to the Mnemiopsis collapse. A consequence of such highly dense young bivalve community was their very slow growth rate. They attained 5 mm length at most in two years instead of 8-15 mm under normal conditions. Therefore, the sudden jump in bivalve biomass to 200 g m-2 in 2000 was followed by their slower biomass increase in the subsequent two years up to 350 g m-2 for Anadara, 100 g m-2 for Pitar rudis and 60 g m-2 for Chamelea in 2003. Higher Anadara biomass was due to their opportunistic character for space and food consumption (Van Hoey et al., 2007). As expected, such slowly growing abundant bivalve population was attack by the opportunistic predator Rapana. As 1 ind. per 10 m2 was a typically observed Rapana population, the population density of young Rapana increased to 8 ind.m-2 in 2001 and 100 ind. m-2 in 2002. Their massive grazing pressure on bivalve (Chamelea, Anadara, Pitar rudis) populations caused an abrupt decrease in bivalve biomass and abundance from 470 g m-2 and 1292 ind.m-2 in 2002 to 35-45 g m-2 and 29-61 ind.m-2 in 2003-2004 (Fig. 8.36).�� This was accompanied by biomass increase of Rapana from 3 g m-2 in 2001 to ~35-45 g m-2 in 2002-2003 as well.
The abrupt loss of bivalves further shifted the macrozoobethos community structure to a Polychaeta-dominated system with an increase of Polychaeta species from 10 to 16, abundance from 300 ind.m-2 to 1494 ind.m-2 and biomass from 2.5 to 7.5 g m-2 in 2003-2004. At the same time, the lack of sufficient food for high Rapana population caused decline of their population to a background level (< 5 g m-2) in 2004-2005. Thus, the Beroe invasion in 1999 introduced interesting prey-predator interactions with strong year-to-year fluctuations in the macrozoobethic community structure during 2000-2004.
8.8. Conclusions
Following significant changes in the qualitative and quantitative characteristics of zoobenthos community along the entire Black Sea in the 1970-1980s in response to intensifying eutrophication and other complementary factors, some increase in benthic species diversity and relative recovery of hypoxia sensitive groups during the post-eutrophication period suggested an adjustment process of benthic communities towards a new quasi-stable balance. On the basis of autumn 2003 observations, the Bulgarian shelf benthic macrofauna was identified as in ���œgood���� ecological state except some hotspots subject to local anthropogenic impacts. The northern sector of Romanian shelf (from Sulina to Constanta) had ���œmoderate���� state of zoobenthic community structure that however improved towards the south with increasing distance from the Danube discharge zone. Coastal zone between the Danube-Dniester River outflows was in the ���œpoor-to-moderate���� state, but the zoobenthos community structure in Odessa coastal area was heavily disturbed. The recovery of shallow (15-30 m) and medium (30-50 m) depth benthic communities is encouraging and signals for a rehabilitation trend. Albeit to such slow recovery, the general state of zoobenthos community structure over large areas of the Ukrainian and Romanian shelves is still fragile and suffers from active role of opportunistic and invasive species that continue to exert undesirable disturbances into the system. High capacity for regeneration and food consumption of these opportunistic species (e.g. bivalves Mya arenaria, Anadara inequivalvis, Rapana venosa) still allow them to expand and destroy benthic food web. The conditions appear to gradually progress to the south and east away from the source region of the pollution and eutrophication.
Resuspension and redistribution of fine sediments and silting of large coastal areas due to bottom trawling remains to be an ecological concern that alter sediment type, destroy mussel beds, degrade the associated benthic community from "mussel bed" type to "silt bottom" type dominated by opportunistic polychaetes and oligochaetes. But the link between bottom trawling and its effects on macrozoobenthos has not been studied in sufficient detail yet. Determining the cumulative direct and indirect effects and ecological consequences of hypoxia, high organic load, invasive and opportunistic species, trawling is often complicated and largely unknown. Their quantification is necessary in order to improve our understanding the recovery process.
The present assessment study demonstrated many information gaps in our present state of knowledge of zoobenthos structure of the Black Sea due to lack of systematic observations. The observations are mostly based on scientific cruises, designed for some other purposes interests, which may not very be compatible with monitoring strategy. The present level of knowledge does not allow for a more solid assessment beyond making rather trivial statements such as ���œrecovery but still fragile structure����, ���œprone to undesirable disturbances����, etc.�� Answering questions like ���œwhere the present benthic system stand in terms of its stability����, ���œhow it is close to its former background state����, ���œwhether it is approaching to it or going to be stabilized at an alternative state���� require implementation of a comprehensive and systematic monitoring strategy that should resolve regional heterogeneities in benthic structure and their pronounced interannual changes.
References
Abaza V., Boicenco L., Moldoveanu M, Timofte F, Bologa AS, Sburlea A, Dumitrache C, Staicu I, Radu Gh (2006b) Evolution of marine biodiversity status at the Romanian Black Sea coast as result of anthropogenic modifications in the last decades. In: 1st Biannual Scientific Conference ���žBlack Sea Ecosystem 2005 and Beyond, 8-10 May 2006, Istanbul, Turkey.
Abaza, V., Boicenco L., Bologa A.S., Dumitrache C., Moldoveanu M., Sburlea A., Staicu I., Timofte F. (2006a) Biodiversity structure from the Romanian marine area. Cercetari marine ����� Recherches marines, INCDM Constanta, 36, 15-29.
Alexandrov, L., Trayanova, A., Varshanidze, M., Todorova, V., Zaharia, T. ���œThe use of mussel (Mytilus galloproviancialis, Linne) larval stages as indicators of water quality.������ Scientific annalises 2000-2001. Danube delta national institute for research and development, Tulcea-Romania.
Ateş, A.S. (1997) Gerze-Hamsaroz (Sinop) Kıyı Decapoda (Crustacea) Faunası ��zerine Bir Araştırma: 1-57s (Ms.C. Thesis, University of Ondokuz Mayis, Samsun). [In Turkish.]��
Bacescu M. and Muller G.I. (1971) I. Biocenologie bentala. II. Compozitia calitativa a faunei bentale din Marea Neagra. Ecologie marina, Edit. Academiei, Bucuresti, 4, 37-225.
Bacescu M., Dumitrescu H., Manea V., Por Fr., Mayer R. (1957) Les sable a Corbulomya (Aloidis) maeotica-base trophique de premier ordre pour les poissos de la mer Noire. Aspect hivernal de le biocenose. Trav.Mus. Hist.Nat. ���œGrigore Antipa����, 1, 305-374.
Bacescu M., Gomoiu M-T., Bodeanu N., Petran A., Muller G., Manea V. (1965) Recherches ecologiques sur le fonds sablonneux de la mer noire (cote roumaine). Trav. Mus.Hist.Nat. ���œGrigore Antipa����, 5, 33-81.
Beukema J.J. (1982) Annual variation in the reproductive success and biomass of the major macrozoobenthic species living in tidal flat area of the Wadden Sea. Neth.J.Sea Res., 16, 27-35.
Bilgin, S., Ateş A.S. and ���elik, E. Ş. (2007) The Brachyura (Decapoda) Community of Zostera marina meadows in the coastal area of the Southern Black Sea (Sinop Peninsula, Turkey). Crustaceana, 80 (6), 717-730.
Black Sea biological diversity. Ukrainian National Report. (1998). Compil. By Zaitsev Yu. P, Alexandrov B. G. United Nations Publication. Vol. 7. 351 p.
Boltachev A. R. (2006). Trawl fishery and its effect on the bottom biocenoses in the Black Sea. Marine Ecology Journal. V. 5, № 3. 2006. P. 45-56. (In Russian).
Borja A., Franko J., Perez V. (2000) A marine biotic index to establish the ecological quality of soft bottom benthos within European estuarine and coastal environments. Marine Pollution Bulletin, 40 (12), 1100-1114.
Caspers, H. (1968) La macrofaune benthique du Bosphore et les probl�¨mes de l�����infiltration des ��l��ments m��diterran��ens dans la Mer Noire. Rapports et Proces- Verbaux des Reunions, Monaco (CIESM), Vol: XIX(1) 107- 115.
Chigirin N. I. (1938). Soft-bottom benthos of the Sevastopol bay. Archive of IBSS.�� 43 p. Reg. № 318-1985. (In Russian).
Chikina M.V., Kucheruk N. V. (2004) Contemporary dynamics of coastal benthic communities of the north Caucasian coast of the Black Sea. In: International Workshop on Black Sea Benthos. ���zt��rk B., Mokievsky V. and Topaloğlu, B. (Eds). Published by Turkish Marine Research Foundation, Turkey,.155-160.
Chikina, M.V. & Kucheruk, N.V. (2005) Long-term changes in the structure of coastal benthic communities in the Northeastern part of the Black Sea: Influence of alien species, Oceanology, 45, Suppl. 1, S176-S182.
Chukhchin V.D. (1965) Reproduction biology of Venus gallina L. (Lamellibranchia) in the Black Sea. Benthos, Kiev, Naukova Dumka, 15-29.
Chukhchin, V.D. (1961) Rapana at Gudauta Oyster Bank, Proc. Sevast. Biol. Sta., 14, 180-189.
���ınar, M. E., & G��nl��g��r-Demirci, G. (2005) Polychaete assemblages on shallow-water benthic habitats along the Sinop Peninsula (Black Sea, Turkey). Cahiers de Biologie Marine, 46, 253-263.
Clarke K. R. and Warwick R.M. (1994) Change in marine communities: An approach to statistical analysis and interpretation. Plymouth, Plymouth marine laboratory, 144 pp.
���ulha, M. (2004) Sinop ve civarında dağılım g��steren Prosobranchia (Mollusca-Gastropoda) t��rlerinin taksonomik ve ekolojik ��zellikleri: 1-150s (Ph.D. Thesis, University of Ege, Izmir). [In Turkish.]
Demir, M. (1952) Boğaz ve adalar sahillerinin omurgasız dip hayvanları. Hidrobiyoloji Araştırma Enstit��s�� Yayınlarından, Istanbul University Pres., 2A: 1-654, [In Turkish.]
Dumitrache C (1996/1997) Present state of the zoobenthos from the Romanian Black Sea continental shelf. Cercetari Marine (Recherches Marines), 29-30, 141 �����151.
Dumitrache C. Abaza V., Mihnea, R., Varga, L.A., Gheorgge, L. (2008) Establishing the ecological quality status using benthic invertabrates as bio-indicators in marine monitoring. Cercetari marine (Recherches marines), 38, 119-135.
Dumitrache C. and Abaza V. (2004) The present state of benthic communities in the Romanian coastal waters. Cercetari marine (Recherches marines), 35, 61-75.
Dumitresco, H. (1960). Contribution A La Connaissance Des polych�¨tes De La Mer Noire, Specialement Des Eaux Pr��bosphoriques, Trauaux de Mus��um d�����Histoire Naturelle ���œGregor Antipa����, II, 69-85.
Dumitresco, H. (1962) Nouvelle Contribution A L�������tude Des polych�¨tes De La Mer Noire, Trauaux de Mus��um d�����Histoire Naturelle ���œGregor Antipa����, 3, 61-68.
Gogmachadze T.M., Mickashavidze E.V. (2005) Cunearca cornea (Reeve) new dominant�� hydrobiont of the Georgian Black Sea shelf. 12-14.
Gomoiu M.T. (1972) Some ecological data on the gastropod Rapana thomasiana Crosse along the Romanian Black Sea coast. Cercetari marine (Recherches Marines), 4, 169-180.
Gomoiu M.T. (1976) Changes in the structure of benthic biocoenoses of the Romanian littoral of the Black Sea. Cercetari marine (Recherches marines), 9, 119-143.
Gomoiu M.T. (1981) Distribution of Mya arenaria populations in the western part of the Black Sea. Cercetari marine (Recherches marines), 14, 145-158.
Gomoiu M.T. (1983) Sur la mortalite en masse des organismes bentiques du littoral roumain de la mer Noire. Rapp.Comm. int. mer Medit., 28(3), 203-204.
Gomoiu M.T. (1985) Sur l�����etat du benthos du plateau continental roumain. Rapp.Comm. int. mer Medit., 29 (5), 199-204.
Gomoiu M.T. and Tiganus V. (1990) Elements pour la connaissance de l�����etat de l�����evolution des communautes benthique de l�����ouest de la mer Noire. Rapp. Comm. int. mer Medit., 32, 24.
G��nl��g��r, G. (2003) Batı Karadeniz (Sinop) sahillerinin ��st infralittoral zonundaki bazı fasiesler ��zerinde kalitatif ve kantitatif araştırmalar. 1-323, (Ph.D. Thesis, University of Ege, Izmir). [In Turkish.]
G��nl��g��r-Demirci, G. (2005) Sinop Yarımadası�����nın (Orta Karadeniz) Mollusca faunası. Fırat �œniv. Fen ve M��h. Bil. Der., 17(3), 565-572.
G��nl��g��r-Demirci, G. and Karakan, İ. (2006) Sinop kıyılarında (Orta-Karadeniz) Deniz ��ayırlarının durumu. Fırat �œniv. Fen ve M��h. Bil. Dergisi., 18(3): 331-337.
Gray J. S., McIntyre A.D., ��tirn J. (1992) Manual of methods in aquatic environment research. Part 11. Biological assessment of marine pollution with particular reference to benthos. FAO Fisheries Technical Paper 324, 49 pp.
Helmboldt M.V. (2001) Species composition and abundance of marine ticks (Halacaridae: Acari) of Odessa Bay. Gidrobiol.zhurnal. 37(1), 22-26 (in Russian).
Kalugina-Gutnik, A.A. (1975) Phytobenthos of the Black Sea. Naukova Dumka, Kiev, 1-246 pp (In russian).
Kaneva-Abadjieva V. and Marinov T. (1960) Zoobenthic distribution in the Bulgarian Black Sea area. Proc. Inst. Fish., 3, 117-161 (In Bulgarian).
Kırkım, F., Sezgin, M., Dağlı, E., Doğan, A., ���zt��rk, B., �œnl��oğlu, A., Katağan,T. and Benli, A. Sublittoral Soft-Bottom Zoobenthic Communities and Diversity of Southern coast of the Black Sea (Turkey), (Unpublished data).
Kırkım, F., Sezgin, M., Katağan, T., Bat, L., Aydemir, E. (2006) Some benthic soft-bottom crustaceans along the Anatolian coast of the Black Sea. Crustaceana, 79(11), 1323-1332.
Kiseleva M.I. (1965) Quantitative composition and quantitative distribution of meiobenthos at the western coast of Crimea. Benthos. Kiev, Naukova dumka, 48-62 (in Russian).
Kiseleva M.I. (1981) Soft-bottom benthos of the Black Sea. Kiev, Naukova Dumka,. 168pp ( in Russian).
Kiseleva M.I. (1981) Soft-bottom benthos of the Black Sea. Kiev, Naukova Dumka, 168 pp.
Kiseleva M.I. (2004). Polychaetes (Polychaeta) of the Azov and Black Sea. Apatity: Print. Kola Science Centre RAS, 2004. 409 p.
Kiseleva M.I., Revkov N.K., Kopytov Yu.P. (1997) The modern state and the long-term changes of zoobenthos in Streletskaya Bay (Sevastopol area).���� Hydrobiol. Journal, 35 (in English).
Kiseleva M.I., Slavina O.Y. (1965) Qualitative structure and quantitative distribution of macro- and meiobenthos near the Northern Caucasian coast. Benthos. Kiev, Naukova dumka, 62-80 ( in Russian).
Kiseleva M.I., Slavina O.Ya. (1972) Distribution of benthos at coast of Caucasus in area of Tuapse ����� Shepsi. Biologiya moray, 26, 125-133 (in Russian).
Kiseleva M.I., Zaika V.E. Chordata (1972) Taxonomic keys to fauna of the Black and Azov Seas, Kiev, Nauka Dumka, 3, 294�����304 (in Russian).
Kisseleva M.I. (1985) Distribution of benthos at the Crimea and Caucasus lower shelf zone. Dep. VINITI, № 5390, Sevastopol, 22pp. (in Russian).
Kisseleva M.I. (1992) Development of benthos in sandy biotope of Lisya bay (southeast coast of Crimea). Ecologiya Morya, 40, 50�����55 (in Russian).
Kocataş, A. and Katağan, T. (1980) T��rkiye Karadeniz sahillerinin bentik Amphipodları. In: Proceedings of the Seventh Science Congress, Kusadasi, 6-10 October 1980: 285-296. (Ege University Press, Aydin). [In Turkish.]
Kucheruk, N.V., Basin, A.V., Kotov, E. (2002) Macrobenthos of crumbly sediments of the Black Sea Caucasian coast: Long-term dynamics of the community sturctures, In: Multidisciplinary studies of the Northeastern part of the Black Sea (Nauka, Moscow), 289-298.
Kulakova I.I. (2001) Contemporary state of fauna of free-living nematodes of the northwestern Black Sea in conditions of anthropogenic eutrophication. Ecological safety of coastal and shelf zone and integrated use of shelf resources, Sevastopol, MGI, 295-300 (in Russian).
Makarov Yu.N., Kostylev E. F. (2002) Molluscs in eutrophic areas of the Ukrainian shelf of the Black Sea (by results of observation of 1997�����1998). The bulletin of Zshitomirsky Pedagogical University. Biol. Sciences, 10,�� 120�����122 (in Russian).
Mazlumyan S.A., Boltacheva N.A., Kolesnikova E.A. (2003) Zoobenthos diversity changes on the soft bottom at southeast Crimean region (Lisya bay as an example). Modern condition of biological diversity in near-shore zone of Crimea (the Black Sea sector). Sevastopol: Ekosi-Gidrophizika, 229�����238 (in Russian).
Mee, L. D., Friedrich, J. and Gomoiu, M. T. (2005) Restoring the Black Sea in times of uncertainty. Oceanography, 18(2), 32-43.
Mickashavidze E., Gogmachadze T. (2005) Cunearca cornea (Reeve)- The New dominant hydrobiont of the Georgian Black Sea coast. News of biology. Ivane Jawakhishvili Tbilisi State University, 12-14.
Micu, S., Micu D., Abaza V. (2004) Changes in biodiversity of decapods (Decapoda, Crustacea) from the Romanian Black Sea Coast.�� Ann. Sci. Univ. Al. I. Cuza, Iasi, s. Biologie animala, Tom L, 17-26.
Milchakova, N.A. (1999) On the status of seagrass communities in the Black Sea. Aquatic Botany, 65, 21-32.
Mironov O.G., Kiryukhina L.N., Alemov S.V. (2003) Sanitary and biological aspects of ecology of the Sevastopol Bays in XX century. Sevastopol, Ekosi-Gidrophizika, 185pp. (in Russian).
Mistri M., Rossi R., Ceccherelli V. (1988) Growth and production of the ark shell Scapharca inaequivalvis (Brugui�¨re) in a lagoon of the Po River Delta. P.S.Z.N.I. Marine Ecology, 9(1), 35-49.
Moncheva S., Doncheva V., Kamburska, L. (2001) On the long-term response of harmful algal blooms to the evolution of eutrophication off the Bulgarian Black Sea coast: are the recent changes a sign of recovery of the ecosystem the uncertainties. In: Proceedings of IX International conference on ���œHarmful Algal Blooms����, Hallegraff G.M. et al., (eds), Hobart, Tasmania, (UNESCO-IOC, Paris, 2001), 177-182.
Mordukhay-Boltovskoy F.D. (1972) General characteristics of the Black and Azov seas fauna. In: Descriptive catalogue of the fauna of the Black Sea and Azov Sea. Kiev, Naukova Dumka, 3, 316-324 (in Russian).
Mutlu, E., �œnsal, M. and Bingel, F. (1992) A preliminary view on the faunal assemblage of softbottom crustaceans along the nearshores of the Turkish Black Sea. Acta Adriatica, 33 (1/2), 177-189.
Mutlu, E., �œnsal, M.and Bingel, F. (1993) Faunal community of soft-bottom mollusc of the Turkish Black Sea. Turkish Journal of Zoology, 17, 189-206.
Nikolaenko, T.V. and Povchum, A.S. (1993) Benthos of the Kerch Prestrait Area, Ecologia morya, 44, 46-50.
Nilsson H.C., Rosenberg R. (2000) Succession in marine benthic habitats and fauna in response to oxygen deficiency analysed by sediment profile-imaging and by grab samples. Marine Ecology Progress Series, 197, 139-149.
���zt��rk, B. (1998) Black Sea Biological diversity. Turkey. United Nations puplications, New York. Vol.9, 144pp.
���zt��rk, B. and ���evik, C. (2000) Molluscs fauna of Turkish Seas, Club Conchylia Informationen, 32(1/3), 27-53.
���zt��rk, B., ���ulha, M. and �œrkmez, D. (2004) Bivalvia Fauna of the Sinop Peninsula and its vicinity. Turkish Journal of Aquatic Life, 2(2), 71-80.
Pearson, T. H. and Rosenberg R. (1978) Macrobenthic succesion in relation to organic enrichnment and pollution of the marine environment. Oceanogr. Mar. Biol. Ann. Rev., 16, 229-311.
Petranu A. and Gomoiu, M-T (1972) The distribution of the bivalve Mya arenaria L. on the Romaniana shore of the Black Sea. Cercetari marine ����� Recherches marines, 3, 53-67.
Petrov A.N., Zaika V.E. (1993) Pathological changes in structure of Cerastoderma glaucum Poiret (Mollusca:Bivalvia) shells in Sevastopol Bay. Ekologiya Morya, 43, 56-60 (in Russian).
Povchun A.S. (1992) Changes of benthic communities in Karkinitsky Gulf. Long-term changes of zoobenthos in the Black Sea. Kiev, Naukova Dumka Publ., 105-138 (in Russian).
Revkov N. K. Zoobenthos vertical distribution / Modern condition of biological diversity in near-shore zone of Crimea (the Black Sea sector). Sevastopol: Ekosi-Gidrophizika, 2003 c. P. 221�����222. (In Russian).
Revkov N. K., Petrov A. N., Kolesnikova E. A., Dobrotina G. A. (2008). Comparative analysis of long-term alterations in structural organization of zoobenthos under permanent anthropogenic impact (сase study: Sevastopol Bay, Crimea). Marine Ecological Journal. 7, №3. P. 37-49.
Revkov N.K. (2003a) Taxonomical composition of the bottom fauna at the Black Sea Crimean coast. Modern condition of biological diversity in near-shore zone of Crimea (the Black Sea sector), Sevastopol: Ekosi-Gidrophizika, 209�����218, 326�����338 (in Russian).
Revkov N.K. (2003b) The long-term changes of zoobenthos over the soft bottoms in the southwest Crimea region. Modern condition of biological diversity in near-shore zone of Crimea (the Black Sea sector). Sevastopol: Ekosi-Gidrophizika, 222�����228 (in Russian).
Revkov N.K. (2005) On the modern state and long-term changes of zoobenthos on the soft bottoms of Sevastopol Bay. Proc. Intern. Sci. Conf. ��Modern status of ecosystems of the Black and Azov Seas��, 13�����16 Sept., 2005. Crimea, Donuzlav. Sevastopol: EKOSI-Gidrofizika,�� 62 (in Russian).
Revkov N.K., Kolesnikova E.A., Valovaya N.A., et al. (2000) Benthos of coastal zone of Crimean southern shore (Balaklava ����� Aya cabo): structure and state. J. Hydrobiology, 36(4), 3-10.
Revkov N.K., Nikolaenko T.V. (2002) Biodiversity of zoobenthos in the coastal zone of the south coast of Crimea (Laspi Bay). Russian Journal of Marine Biology, 28(3), 151�����162 (in English).
Revkov N.K., Prosvirov Iu.V. and Logachev V.S. (1992) State and spatial distribution of benthos under effect of industrial muddy waters (Balaklava area, depth 25�����88m). In: VINITI 20.02.92. 585 ����� В92, IBSS, Sevastopol, 16 pp. (in Russian).
Revkov N.K., Valovaya N.A., Kolesnikova E.A., Nikolaenko T.B. & Shalyapin V.K. (1999) Concerning problems of response of the Black Sea macrozoobenthos to eutrophication. Ecological safety of coastal and shelf zones and complex use of shelf resources: Collect. Works. ����� Sevastopol, EKOSI-Gidrophizika, 199�����212 (in Russian).
Rosenberg R., Hellman B., Johansson B. (1991) Hypoxic tolerance of marine benthic fauna. Marine Ecology Progress Series, 79, 127-131.
Rullier, F. (1963) Les Annalid��s Polch�¨tes du Bosphore de la Mer de Marmara et de la Mer Noire, en relation avec celles de la M��diterran��e. Rapports et Proces- Verbaux des Reunions, Monaco (CIESM), Vol: XVII, Fasc: 2, 161- 260.
Sergeeva N.G. (2003) Morfological anomalies of free-living nematodes as an indicator of the environmental state. Contemporary state of biodiversity of coastal waters of Crimea (Black Sea Sector). Sevastopol, 302-310 (in Russian).
Sezgin, M., A. Kocataş�¸ and T. Katağan (2001) Amphipod fauna of the central Black Sea region. Turkish Journal of Zoology, 25, 57-61.
Sezgin, M., Katağan, T. (2007) An account of our knowledge of the amphipod fauna of the Black Sea. Crustaceana, 80(1), 1-11.
Sezgin, M., Katağan, T., Kırkım, F. Recent status of Turkish Black Sea Benthos, (Unpublished data).
Shurova N. M. (2003). Interannual variability of age structure of population Mytilus galloprovincialis in the northwest part of the Black Sea. Ekologiya morya (Marine Ecology). 2003, № 63. P. 73-77. (In Russian).
Shurova N.M. (2006) Macrozoobenthos. Fauna of Oligochaeta. In: Northwestern part of the Black Sea: biology and ecology. Kiev, Naukova dumka Publ., 286-288 (in Russian).
Shurova N.M., Stadnichenko S.V. (2002) Changes of the Black Sea mussel population characteristics and strategy formation of their population in modern conditions. Visn. Zhitomir. Ped.univ. 10, 137-139 (in Russian).
Simboura N., Zenetos A. (2002) Benthic indicators to use in Ecological Quality classification of Mediterranean soft bottom marine ecosystems, including a new Biotic Index. Mediterranean Marine Science, 3/2, 77-111.
Sinegub I.A. (2006) Macrozoobenthos. Bottom communities in 1984�����2002. In: Northwestern part of the Black Sea: biology and ecology. Kiev, Naukova dumka Publ., 276-286 (in Russian).
Skolka M., Paraschiv, G.M., M.D., Samargiu (2006) The biodiversity of Romanian Black Sea coast. 1st Biannual Scientific Conference ���œBlack Sea Ecosystem 2005 and Beyond����. 8-10 May 2006, Istanbul, Turkey.
Stefanova K., Todorova, V. Kamburska, L. Dencheva, K. (2005) The Black Sea ecosystem in front of Bulgarian coast ����� research review and contemporary state. Bulgarian Bioplatform ���œRecent state of biodiversity in Bulgaria ����� problems and perspectives����, Petrova A. (ed.), 447-468 (in Bulgarian).
Tatishvili K, Gagdasaryan, K., Kazahshvili Zh. (1968) Handbook of marine gastropods ecology. Georgian Academy of Sciences, Institute of Palaeobiology, Nauka, Moscow, 167 pp.
Tiganus V. (1982) Modification dans la structure de la biocenose des sables a Corbula mediterranea Costa du littoral roumain. Rapp. Comm. int. mer Medit., 28, 205-206.
Tiganus V. (1988) Evolution of sand dwelling benthic communities during 1983-1985 at the Romanian shores (in Romanian), Zirdava, 2 Conf. Nat. ecol., Arad 1986, 17, 344-347.
Tiganus, V. and Dumitrache C. (1995) Sur la diversite actuelle de la macrofaune bentique du littoral roumain. Rapp. Comm. int. mer Medit., 34, 45.
Todorova V. (2005) Benthic communities in the north-western Black Sea ����� indicator of the current ecosystem state. Proceeding of the Institute of Oceanology, 5, 243-260. (in Bulgarian)
Todorova V., Konsulova Ts. (2000) Long term changes and recent state of Macrozoobenthic communities along the Bulgarian Black Sea coast. Mediterranean Marine Science, 1/1, 123-131.
Todorova V., Konsulova Ts. (2006) Ecological state assessment of zoobenthic communities on the northwestern Black Sea shelf ����� the performance of multivariate and univariate approaches. Abstracts of 1st Biannual Scientific Conference ���œBlack Sea Ecosystem 2005 and Beyond���� (8-10 May 2006 Istanbul, Turkey), 96-100.
Tolmazin, D. (1985) Changing coastal oceanography of the Black Sea. I: The north-western shelf. Progress in Oceanography, 15, 217-276.
Uysal, A., Y��ksek, A., Okus, E. and Yılmaz, N. (2002) Benthic community structure of the Bosphorus and surrounding area. Water Science and Technology, 46, 37-44.
Van Hoey Gert, Vincx Magda and Degraer Steven (2007) Temporal variability in the Abra alba community determined by global and local events. Journal of Sea Research, , 58(2), 144-155.
Vorobyov V.P. (1949) Benthos of the Azov Sea // Trudy Azovo-Chernom. NII Mor.Ryb.Khoz-va i okeanogtafii.- T.13, Simferopol, 193pp. (in Russian).
Vorobyova L.V. (2000) Meiobenthos of marine areas with different types of anthropogenic impact. Global system of Black Sea monitoring: Fundamental aspects. Sevastopol, 126-132 (in Russian).
Vorobyova L.V. (2006) Contemporary state of the benthic zone of the western part of the Black Sea according to meiobenthos indices. In: 1st Biannual Scientific Conference, Black Sea Ecosystem 2005 and Beyond, 8-10 May 2006, Istanbul, Turkey.
Vorobyova L.V., Kulakova I.I. (1998) Spatial-temporal meiobenthos variability in Zhebriansky Bay. Ecology of marine coasts of the Ukrainian part of the Denube Delta. Odesa Astroprint Publ., 238-249 (in Russian).
Vorobyova L.V., Yaroshenko N.N. (1979) Marine ticks (Halacaridae) of the northwestern Black Sea. Gidrobiol.zhurnal, 15( 6) 29-33 (in Russian).
Warwick R. M., Emblow Ch., Feral J.-P., Hummel H., van Avesaath P., Heip C. (2003) European Marine Biodiversity Research Sites. Report on the European Concerted Action: BIOMARE. Implementation and Networking of Large Scale, Long Term Marine Biodiversity Research in Europe. NIOO-CEME, Yerseke, the Netherlands, 136 pp.
Yakubova L.I. (1948) On the distribution of Modiola phaseolina (Phil) in the Black Sea. Proc. of Sevastopol Biol. Station, 6, 286�����297 (in Russian).
Zaika V.E. (1990) Changes of makrobenthic species number in the Black Sea at the depth of 50�����200 m. Proc. Acad. Sci. Ukraine, Ser. B, no. 11, 68�����71 (in Russian).
Zaika V.E. (1992) Mechanisms of anthropogenic impact on the structure and function of the benthic ecosystem. Long-term changes in the Black Sea zoobenthos. 226-239 (in Russian).
Zaika V.E. (1998) Spatial structure of the Black Sea benthic communities: influence of the pelagic processes. Ecosystem Modeling as a Management Tool for the Black Sea. Kluwer Acad. Publ., Vol. 1, 293�����299.
Zaika V.E., Kisseleva M.I., Mikhailova T.V., et al. (1992) Multiannual changes in the benthos of the Black Sea. Kiev, Naukova Dumka Publ., 247pp. (in Russian).
Zaika V.E., Sergeeva N.G. (2001) Makrozoobenthos of the lower shelf zone of the Black Sea (deeper 40�����50 m) according to last XX century samplings. Ecologiya moray, № 57, 25�����30 (in Russian).
Zaitsev Yu. and ���zt��rk B. (2001) Exotic species in the Aegean, Marmara, Black, Azov and Caspian Seas. Published by Turkish Marine Research Foundation.- Istanbul, Turkey, 267 pp.
Zolaterev, V. (1996). The Black Sea ecosystem changes related to the introduction of new mollusc species. P.S.Z.N.I.
Zuev G.V., Melnikova E.B. (2007). Intraspecific differentiation of the sprat Sprattus sprattus phalericus (Risso) (Pisces: Clupeidae). Marine Ecological Journal. Vol. 6., # 4. P. 31-42. (In Russian).
CHAPTER 9 THE STATE OF MARINE LIVING RESOURCES (V. Shlyakhov & G. Daskalov)
YugNIRO, Kerch, Crimea, Ukraine
CEFAS Lowestoft laboratory, Lowestoft, Suffolk, UK
9.1. Introduction
In the context of this chapter, ���œMarine living resources���� (hereinafter it is referred to as MLR) comprise the populations (exploited, being exploited or being able to be exploited by humans) of finfishes (hereinafter ����� fishes), mollusks, crustaceans, water plants and other living organisms inhabiting the Black Sea, excluding waterfowl and mammals. About 200 fish species, more than 500 mollusks species and water plants�����macrophytes (red and brown algae as well as marine floral plants) inhabit the Black Sea. Among the whole specific diversity, the greatest economic value, however, is not more than two dozens of species that produce about 98% of catch in 1996 ����� 2005 (Fig. 9.1). The rest 2% included commercially less important fishes, mollusks, crustaceans and other aquatic organisms. The main portion of catches falls into three groups ����� anadromous, pelagic, and demersal fishes. In each of these groups, more than 90% of capture volume fall on several leading species. As a whole, the total mean annual catch of MLR in 1996 ����� 2005 was at the level of 410 thousand tons varying annually between 330 thousand tons and 500 thousand tons, that is more than 30 thousand tons higher than the mean catch in 1989 ����� 1995 (Fig. 9.2).
This chapter summarizes the state of marine living resources in the Black Sea during the last 10 years with respect to the previous decades. In particular, the state of MLR will be assessed for 1996 ����� 2005 as compared with the earlier period to explain the changes occurred. The chapter was benefited from the data used for the TDA (Technical Task Team National Experts on Fisheries) Reports (2006), kindly submitted to the BSERP - PIU by the authors. Information on MLR catches of the Black Sea countries in 1989 ����� 2005 was taken from the FAO statistical data base with some corrections made on the basis of TDA reports (2006) and the Black Sea Commission Information System data base.
9.2. The state of key anadromous fishes
The anadromous species of the Black Sea include the pontic shad (Alosa pontica) and three sturgeon species Acipenser gueldenstaedtii, Acipenser stellatus, Huso huso. Among fishes by the capture volume, anadromous fishes take the last place (Fig. 9.1), but their high consuming and economical value determines their specific role in the structure of the MLR. Their life cycle consists of marine period (wintering and fattening) and river period (spawning and migration of newly born juveniles into the sea). Stocks of anadromous fishes are formed mainly by the Danube populations. The catch data of anadromous fishes (Fig. 9.3) suggest decline of their commercial value in 1996 ����� 2005 as compared with the previous period. Following the minimal catch occurred in 1999, nevertheless an increasing trend of annual catches was observed due particularly to the recovery of Pontic shad.
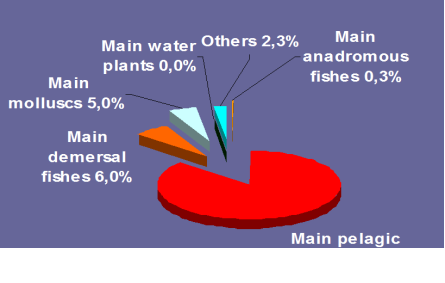
Fig. 9.1. Commercial exploitation of Marine Living Resources in the Black Sea in 1996 ����� 2005.
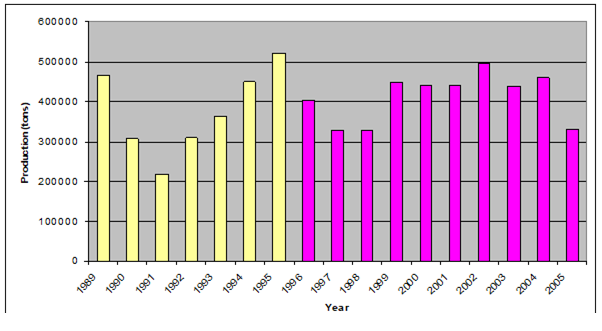
Fig. 9.2. Total capture production of Marine Living Resources in the Black Sea in 1989 ����� 2005.
9.2.1. Sturgeons
Out of six sturgeon species of family Acipenseridae inhabited the Black Sea and inflowing rivers, three species called the Russian sturgeon (A. gueldenstaedtii), starred sturgeon (A. stellatus) and beluga (Huso huso) are most common. They are large-sized fishes with long life cycle: beluga lives up to 100 years and reaches the weight more than 1 ton with length of 490 cm; for Russian sturgeon maximum recorded age is 37 years, the length is 236 cm and weight is 115 kg; starred sturgeon reaches the length of 218 cm, weight 54 kg and age 23 years old (Pirogovskiĭ et al., 1989; Popova et al., 1989; Vlasenko et al., 1989). Russian sturgeon and starred sturgeon feed mainly on benthic organisms, namely mollusks and Polychaetae. Beluga is a typical predator, feeding on fish exclusively. Anadromous sturgeons make extended migrations during their life from the sea into the rivers; larvae drift after hatching and juveniles in rivers; and back into the sea after completion of spawning.
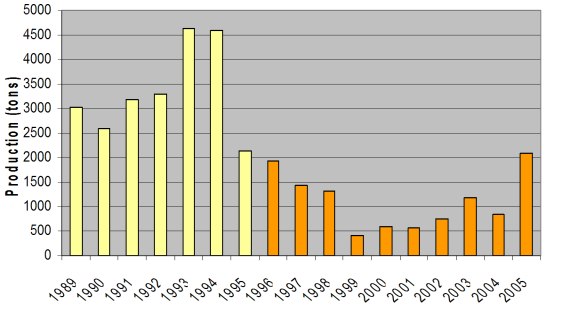
Fig. 9.3. Total capture production of main anadromous fishes in the Black Sea during ��1989 ����� 2005.
The main fattening and wintering grounds of the Danube and Dnieper populations of the Russian sturgeon and starred sturgeon as well as juveniles of beluga are the coastal waters of Ukraine. The Danube, the Dnieper and the Rioni Rivers offer most important habitats for their reproduction. Major part of the adult sturgeon populations in the sea comes from the Danube and Dnieper populations.�� The Danube populations of Russian sturgeon, starred sturgeon and beluga are all abundant. Among Dnieper populations, the Russian sturgeon is the most abundant, artificial reproduction (restocking) play an important role for keeping its abundance above a certain level.�� In Ukraine, restocking of sturgeons and releasing their fingerling into the wild is carried out in the Dnieper Sturgeons����� Rearing Plant. From 1985 till 1995 this farm has released into the sea 1 ����� 2.5 million juveniles per year (generally, Russian sturgeon) (Prodanov et al., 1997; Shlyakhov, 2003). The scale of sturgeons����� restocking is the largest in the River Dnieper; however, it has the tendency to decrease up to 0.354 million individuals in 2005 and 0.118 million individuals in 2006 (Table 9.1).
According to the methodology described by Shlyakhov and Akselev (1993) and Shlyakhov (1994) and the results of bottom trawl surveys (1981, 1984, 1987, 1991, 1992, 1993, 1994, 1998, and 2002) that were undertaken on the wintering grounds in the Karkinitsky Bay in February-March, the Russian sturgeons����� abundance acquired a continuous growth in 1981 ����� 1993, but started decreasing in subsequent years (Fig. 9.4). On the contrary, the abundance of starred sturgeon remained more or less stable around 1.5 millions of individuals until 1994 and reduced gradually afterwards to less than 0.5 millions of individuals at the end of the 1990s and the early 2000s. The abundance of beluga juveniles decreased from 0.4 to around 0.1 million individuals, and then remained steady around 0.1 ����� 0.15 million individuals up to 2002 that was about one third of the level in 1981. Thus, the total sturgeon abundance increased from 0.2 millions of individuals in 1966 ����� 1974 (Ambroz, Kirilluk, 1979) to 5.3 ����� 6.2 millions of individuals in 1992-93. This increase was due to population growth of Russian sturgeon under highly efficient protection measures and restocking. Starting by 1994, their total abundance however decreased gradually up to 2 millions individuals in 1998 and 1.5 millions of individuals in 2002.
Table 9.1. The total and individual populations of the Russian and Starred sturgeon and Beluga in the Rivers Dnieper and Danube in 1996 ����� 2006, in million individuals per year. Data sources: for RO ����� R. Reinartz (2002), for BG and UA ����� BSIS (2007).
| Year | Country | River | Russian sturgeon | Starred sturgeon | Beluga | Total |
| 1996 | RO | Danube | 0.010 | - | - | 0.010 |
| UA | Dnieper | ���� | ���� | - | 4.018 | |
| 1998 | BG | Danube | 0.001 | - | ���� | 0.001 |
| 1999 | BG | Danube | 0.027 | - | 0.003 | 0.030 |
| 2000 | BG | Danube | 0.020 | - | 0.001 | 0.021 |
| RO | Danube | - | 0.068 | - | 0.068 | |
| 2001 | BG | Danube | 0.028 | - | - | 0.028 |
| UA | Dnieper | 2.370 | - | - | 2.370 | |
| 2002 | BG | Danube | 0.022 | - | - | 0.022 |
| UA | Dnieper | 2.366 | 0.142 | - | 2.508 | |
| 2003 | BG | Danube | 0.161 | - | 0.005 | 0.161 |
| 2004 | BG | Danube | 0.127 | - | - | 0.127 |
| UA | Dnieper | 1.071 | - | - | 1.071 | |
| 2005 | UA | Dnieper | 0.354 | - | - | 0.354 |
| 2006 | UA | Dnieper | 0.112 | 0.006 | - | 0.118 |
The rejuvenation of sturgeon schools after 2000 was reflected in their smaller length-weight characteristics in the Ukrainian sector of the Danube. 82% of all analyzed fish samples corresponded to the range of 96 ����� 105 cm and 4.96 kg in weight. The male:female ratio for both starred and Russian sturgeon schools was 82%:18%. At present starred sturgeon population corresponding to 60% of the total population at 7 years of age made the basis of sturgeons����� catches in the Danube delta; other age groups as well as Russian sturgeon are found in smaller amounts in catches (Table 9.2).
The changes in Russian and starred sturgeon abundances in the Danube school (Fig. 9.4) imply larger amount of fishing of Russian sturgeon than starred sturgeon after 1993 ����� 1994 that made the starred sturgeon progressively more predominant species forming almost 75% of the total population.
The fact that all acipenseriform species were included in the Convention of International Trade of Endangered Species (CITES Appendix II /Notification to the Parties No. 1998/13 Conservation of Sturgeons) since 1998 evidences an unfavorable state of sturgeon populations during the present decade although the data shown in Fig. 9.4 did not extend beyond 2002. In the opinion of the IUCN experts, stocks of migratory sturgeons in the Lower Danube River have been overexploited and a collapse of stocks was inevitable with the same rate of exploitation.
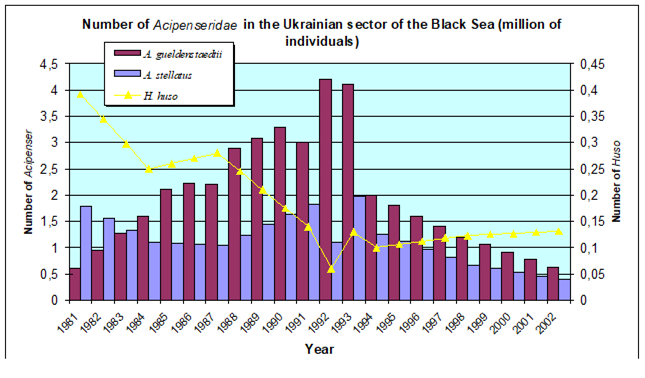
Fig. 9.4. The total abundance (in million of individuals) of three anadromous sturgeon species in the north-western Black Sea according to the data of YugNIRO trawl surveys and mathematical modeling (taken from Shlyakhov, 2003). Red bars: Russian sturgeon; blue bars: Starred sturgeon; yellow line: Beluga.
Table 9.2. Length-weight and age characteristics of mature Russian and starred sturgeons in the Ukrainian Danube in 2003
| Age | 6 | 7 | 8 | 9 | 10 | 11 | 12 | 13 | 14 | 15 |
| Starred sturgeon | ||||||||||
| L (cm) | 101.0 | 100.8 | 102.8 | 104.5 | 110.5 | - | - | - | 103.0 | - |
| Weight(kg) | 4.6 | 5.42 | 5.66 | 6.25 | 7.50 | - | - | - | 5.0 | - |
| % | 10.0 | 60.0 | 22.0 | 4.0 | 3.0 | - | - | - | 1.0 | - |
| Russian sturgeon | ||||||||||
| L (cm) | - | - | 110.0 | 112.7 | 113.5 | 114.8 | 115.9 | 116.5 | 117.0 | 126.0 |
| Weight(kg) | - | - | 8.50 | 9.93 | 10.43 | 10.68 | 11.57 | 14.00 | 14.00 | 16.50 |
| % | - | - | 4.0 | 12.0 | 16.0 | 20.0 | 28.0 | 8.0 | 4.0 | 8.0 |
Statistics on targeted and non-targeted fisheries comprise only officially documented catch or by-catch. ���œUnreported���� catch due to its hidden part during legal fisheries and from poachers����� catch as well as dead fish which is not landed by some reasons (fish died in nets, discarded illegal catch, etc.) were not usually included in statistics, but their proportion may be much higher than the officially reported catch size. Therefore, any reliable assessment for the state of sturgeons need to include the contribution of unreported catch as published earlier by Prodanov et al. (1997); Navodaru et al. (1999); Shlyakhov et al. (2005).
Immediately after the USSR disintegration, the unreported catches increased up to 280 tons (in 1994) due to the illegal fishing of sturgeons����� wintering aggregations in the Karkinitsky Bay (Zolotarev et al., 1996). 60 ����� 70% of these poaching catches consisted of Russian sturgeon. The unreported catch of anadromous sturgeons was estimated as ~600 tons for 1995 that was 12 times more than the officially reported catch by all the Black Sea countries. This number is expected to be even higher since the calculations did not cover all areas of the sturgeons����� fishery and no correction was made for fish death at sea. In the Sea of Azov, mean annual unreported catch of the Russian sturgeon was estimated as 2.0 ����� 4.8 thousand tons for 1988 ����� 1997 (Table 9.3). As depicted in Table 9.3, overfishing led to the collapse of the Azov Sea sturgeon stock and its fisheries within less than 10 years. It can�����t be overcome till now in spite of the complete banning of commercial fisheries of Azov sturgeons after 2000 by the Russian Federation and Ukrainian authorities.
Table 9.3. Mean annual and unreported catches and total abundance of Russian sturgeon according to the data of trawl surveys in 1988 ����� 2005 in the Sea of Azov (assessments of unreported catch were taken from Shlyakhov et al., 2005).
| Years | Total abundance(thousand individuals) | Catch, tons | |
| Official | Unreported | ||
| 1988-90 | 12606 | 772* | 4814 |
| 1992-94 | 8264 | 1143* | 3213 |
| 1995-97 | 4357 | 427 | 2040 |
| 1998-00 | 2785 | 156 | 984 |
| 2001-03 | 1757 | 6 | 109 |
| 2004-05 | 745 | 1 | 54 |
* - Russian sturgeon and starred sturgeon
According to the official statistics, the total catch of all three species of anadromous sturgeons in the Black Sea basin increased from 19 tons in 1994 to 211 tons in 2003 and then sharply declined to 42 ����� 43 tons in 2004 ����� 2005. This abrupt decline may be interpreted as an evidence of the stock collapse due to the recruitment failure.
Besides over-exploitation during the last 10 years, anadromous sturgeon populations were also adversely affected by habitat loss and habitat degradation as a consequence of�� loss of shelters, feeding and reproduction habitats; alteration of the hydrological regime of surface and ground waters (loss of regular soil aeration and moistening), changes in the sediment regime (balance of erosion and sedimentation processes), loss of typical and rare habitats and species diversity especially in flood plains, reduced flood retention capacity resulting in increased flood hazards downstream of�� dams, reduced self-purification capacity resulting in increased need for expensive water purification, reduced productivity (regular free nutrient input) for forestry, agriculture and fisheries, reduction of recreational value.
In accordance with the assessments of national experts, the three main threats for anadromous fishes are as follows.
Illegal fishing and use of destructive harvest techniques: Illegal fishing since 1993 was the major reason of overfishing of sturgeons, and perhaps the collapse of their stocks. Control of poaching in the former Soviet Union countries had no effect at all; responsible authorities were often engaged in illegal fishery (Toje and Knudsen, 2006).�� In the opinion of IUCN experts, control of poaching and illegal caviar trade should be carried out via development and implementation of regional trade and law enforcement agreements; improvement of social and economic conditions of people; improvement enforcement of existing laws.
Loss of valuable spawning and nursery habitats in rivers and lagoons: Recovery of spawning and nursery habitat in rivers and lagoons in the nearest future is not realistic. Key habitats in the Danube, Dnieper, Rioni Rivers and in the Black Sea from catches or by-catches should be protected.
Modification in river flow regimes (including building of dams and drain of meadow): Reduction and loss of anadromous sturgeons may also be connected with dam constructions.�� Prior to the dam construction, the Dnepr sturgeons were used to travel up to Mogilev (Belarus) and the major spawning area was extended from Kherson all over the lower Dnepr, including the Dnepr rapids. After construction of Kakhovka dam in 1956, the spawning area reduced to 75 km. Even in the vicinity of New Kakhovka and village Lvovo, conditions for spawning of sturgeons became unsuitable. Similarly, important spawning sites in the Middle Danube River were reduced after the construction of the Iron Gate Dam I in 1972. The Iron Gate Dam II in 1980 further reduced the migration potential of sturgeons. The dams in the Turkish Rivers Sakarya, Yesilirmak and Kizilirmak were the reason of complete loss of their significance for spawning of anadromous sturgeons.
Banning of commercial sturgeon fisheries by Turkey more than 15 years ago, Ukraine since 2000 and Romania since 2006 was an important step towards conservation of sturgeon stocks.�� However, such measures as well as insufficiently developed restocking and inefficient control of poaching cannot solve this transboundary problem. Concerted actions of all Black Sea countries are necessary.
9.2.2. Pontic shad
Pontic shad (Alosa pontica) is an anadromous pelagic fish reaching the length of 45 cm, maturing at the age of 3-4 years. It is not found in the catches at the age older than 6-8 years. Mature Pontic shad feeds mainly on fish (anchovy, sprat), and to a lesser extent, crustaceans. It is considered that two populations of Pontic shad ����� Don and Danube ones ����� inhabit in the Azov and Black Seas. The Don populations winter in the eastern part of the sea from the Crimean coasts to Batumi and the Danube populations in the western part of the sea (Svetovidov, 1964). More recent studies suggested a possibility of wintering along the Turkish coasts (Prodanov et al., 1997). The Danube population migrates into the Danube, Dnieper and Dnestr Rivers for spawning in spring. Its fisheries are conducted both at sea during spring migration period in Bulgaria and Romania and during wintering phase in Turkey and in the western rivers by Bulgaria, Romania and Ukraine. Its fishery is almost absent in the territorial waters of Georgia and Russian Federation.
According to assessments by Ivanov and Beverton (1985) on the basis of analysis of age cohorts in the catches of Bulgaria, Romania and the former USSR for 1963 ����� 1979, the Danube population of Pontic shad varied from 17 million individuals in 1968 to 114 million individuals in 1974. The corresponding stock was 3 and 20 thousand tons. In subsequent studies (Prodanov et al., 1997) high abundance of the Pontic shad in 1974 was estimated as 122 million individuals without including the Turkish catches and considering only the catches in the eastern part of the sea which possibly did not include the Danube school.
After the peak in 1974 ����� 1975 till the early 1990s, the stock and catches of Pontic shad tended to reduced even excluding the Turkish catch. After 1989, the catch statistics also included the Turkish catches that accounted for 2 ����� 4 thousand tons from 1989 to 1995 (Fig. 9.5). Intensification of catch in the Turkish waters was most likely due to the yearning of fishermen to compensate their losses as a result of collapses in anchovy and horse mackerel fisheries. The extensive harvesting then caused sharp drop in shad catches after 1994 to less than 500 tons in 1999 ����� 2001. The Turkish catch increased again in 2005, exceeding 1 thousand tons. The catches of Bulgaria, Romania and Ukraine in 1989 ����� 1998 were approximately at the same level of 1 thousand tons. It declined sharply in 1999 and acquired a slight recovery afterwards.
The Turkish Pontic shad fishery appears to introduce an important contribution to the sharp decline of the stock after 1995. The Danube population generally winters along both western and eastern coastal waters of Turkey. The Don population of Pontic shad also winters along the eastern Turkish coastal waters.�� Younger year classes of these Pontic shad populations were therefore harvested in the Turkish waters during their overwintering phase, as their older age classes were caught along the coasts of Bulgaria, Romania and Ukraine during spawning migrations into the rivers, mainly the Danube. If that was the case, intensification of the Turkish fisheries on the Pontic shad caused depletion of the stock of potential breeders in 1990 ����� 1995 that then became an important cause of stock and catch decline after 1995.
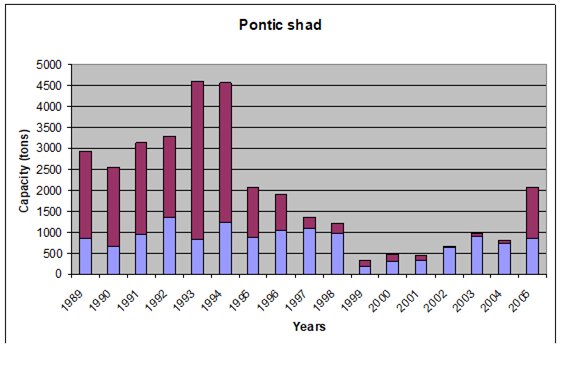
Fig. 9.5. Changes in Pontic shad catches in the Black Sea basin in 1989 ����� 2005.
The stock assessment of the Danube shad at the level of 4 ����� 6 thousand tons during 1989�����1992 (Prodanov et al., 1997) might be an underestimation, since the analysis did not include the Turkish catch which in fact exceeded the total catch of Bulgaria, Romania and Ukraine in those years. The other source of underestimation was the correction for poaching in the Danube and adjacent coastal waters. Assessment for the abundance and biomass of the Danube population of shad in 1996 ����� 2005 was not available. By analyzing of the composition and values of annual catches of Pontic shad by Odessa YugNIRO Centre, the shad biomass was assessed as ~1000 tons in 1998 ����� 2004 except a temporary drop to ~500 tons in 2001in the Ukrainian sector of the Danube (Fig. 9.6). An implication of such rather uniform stock assessment is the importance of including the Turkish catch data into the stock estimation analysis without which it wouldn�����t be possible to explain reliably the stock changes of Pontic shad over the basin.
The present state of the Danube population of Pontic shad should be regarded as unfavorable. Even taking into account unfortunate ecological changes due to the environmental factors such as lower water level, water temperature and pollution that could actually affect the success of the Danube shad reproduction, the most important cause of the stock decrease appears to be the overfishing mainly in the Danube Delta area (Radu, 2006). Indeed, poaching fishery for shad in the lower Danube for recent 10 years has become wide-scale, although it has not been assessed properly so far. Perhaps, marine fisheries of Turkey make a comparable contribution to the overexploitation of the Danube stock of shad.
The main threats for anadromous Pontic shad are almost the same as for sturgeons. The only additional point which might be added is the slightly better state of shad stock as compared with sturgeon due to their natural abilities for rapid recovery. Therefore, the regional level of fishery regulation should be sufficient to improve the Danube population of Pontic shad.
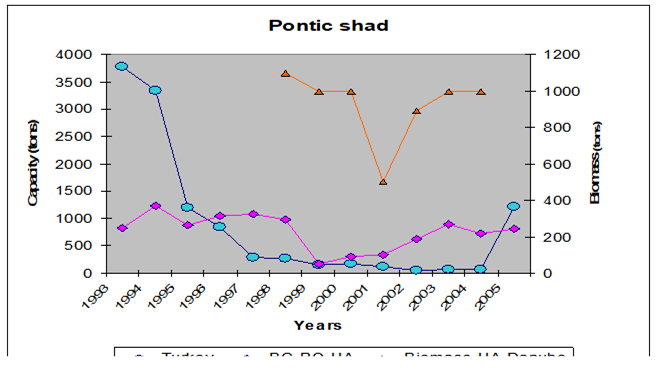
Fig. 9.6. Turkish and the sum of Bulgarian, Romanian and Ukranian catch variations of Pontic shad in the Black Sea as well as its biomass estimation in the Ukrainian Danube region.
9.3. The state of key pelagic fishes
Pelagic fishes, particularly their small-sized plankton-eating types are the most abundant in the Black Sea ichthyocenosis. This factor defines their leading role in fisheries. The main target species of fisheries is European anchovy (Engraulis encrasicolus), whose catch has varied from 31% in 1991 to 75% in 1995 of the total MLR harvest during the last 15 years. Mediterranean horse mackerel (Trachurus mediterraneus), European sprat (Sprattus sprattus), Atlantic bonito (Sarda sarda) and bluefish (Pomatomus saltatrix) are the major pelagics in terms of fishing value. The latter of these three species are large-sized predators which enter the Black Sea from the Marmara and Aegean Seas for feeding and spawning in spring and turn back for wintering in late autumn. The catch data suggest partial recovery of major pelagic species after the fishery collapse at 1991 (Fig. 9.7).
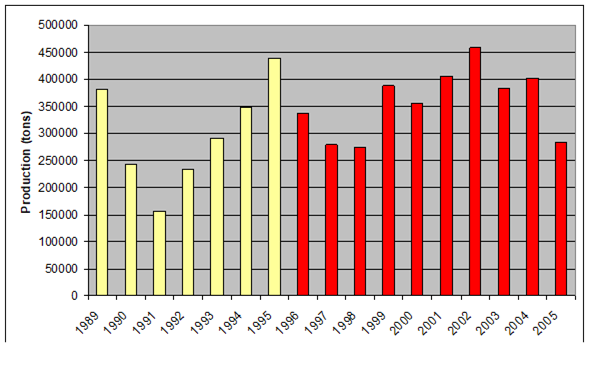
Fig. 9.7. Total catch of main pelagic fishes in the Black Sea during 1989 ����� 2005.
9.3.1. Sprat
Sprat is a self sustaining, one of the most abundant and commercially important pelagic fish species in the Black Sea, and it serves an important food source for larger fishes (Ivanov and Beverton, 1985; Daskalov et al., 1996; Daskalov, 2002). It is distributed over the whole Black Sea, but its maximum abundance takes place in the northwestern region and shelf waters (Ivanov and Beverton, 1985; Fashchuk et al., 1995). In spring, schools migrate to coastal waters for feeding. In the summer, sprat stays under the seasonal thermocline forming dense aggregations near the bottom during the day and in the upper mixed layer during the night (Ivanov and Beverton, 1985).
Sprat reaches maturity at 1 year and reproduces during the whole year, but its peak spawning takes place between November and March. The spawning size is strongly controlled by winter hydroclimatic conditions and plankton blooms (Simonov et al., 1992; Daskalov, 1999). Its reproductive niche is therefore situated to ensure optimal concentration and retention for eggs and larvae. Eggs and larvae are mostly concentrated near the shelf edge and within the central cyclonic gyres with relatively stable subsurface layer (20 ����� 50 m) (Arkhipov, 1993; Fashchuk et al., 1995).
Its recruitment population was found to be weakly dependent on the parental stock biomass and correlated negatively with SST and river discharge but correlated positively with the wind stress (Daskalov, 1999). Its spawning during the winter and spring in deeper layers was also relatively unaffected by M. leidyi because of its low biomass and therefore weak food competition and predation impacts on sprat eggs and larvae. In summer, the juvenile and adult sprat populations leave the upper warmed layer and thus avoid severe competition for food with other plankton-consumers including M. leidyi. During this period their preferred food consists mainly of the cold-water Calanus and Pseudocalanus copepod species living below the cold intermediate layer of the water column. It should be noted that this prey is also available to M. leidyi feeding as they migrate to the thermocline at night for their daily feeding where they can be consumed by the ctenophore. This can partly explain the reduction of the sprat stock in the early 1990s of the Mnemiopsis population outburst. As with the other commercial stocks, heavy overfishing took place before and during the M. leidyi outbreak as well, which should aggravated the stock depletion (Prodanov et al., 1997; Daskalov, 1998). In addition to M. leidyi, the jellyfish Aurelia aurita distributed in deeper waters has a strong trophic interference with sprat. This may explain the coincidence between the declining phase of sprat recruitment and biomass and the peak abundance of A. aurita during the 1980s (Daskalov, 2003; Shulman et al., 1994).
Sprat has always been subject to both artisanal and commercial mid-water trawl fisheries. The regular pre-recruit surveys were performed by the former USSR in collaboration with Bulgaria and Romania from the early 1960�����s to 1993 (Tkacheva and Benko, 1979; Ivanov and Beverton, 1985; Arkhipov, 1993; Prodanov et al., 1997). The long-term monitoring of sprat fat content for at least 30 years has been performed by Shul�����man et al. (1994). Data on catches (often monthly) have been collected by the countries since the early 20th century. Size and age compositions have been regularly assessed (weekly and monthly) based on samples from the commercial landings or research survey. CPUE has been monitored for different vessel type, fleets, and gear since the 1980s (Daskalov et al., 1996). Research surveys however have been limited in recent years because of financial constraints in many research institutes in the region.
Time-series of the main stock parameters based on catch-at-age stock assessment models (Daskalov et al., 1996; Daskalov 1998; Daskalov et al., 2007) are shown in Fig. 9.8. A quasi-decadal cyclic pattern dominates the recruitment abundance time series. Maxima of recruitment and biomass occurred in the mid-1970s and mid-1980s. Its maximum catch was recorded in 1989, leading to highest fishing mortality prior to the stock collapse. The combination of low recruitment and excessive fishing as well as the Mnemiopsis outburst were the major causes of the 1990 stock collapse since the survey indices, age and size composition consistently showed a drop in recruitment, biomass, mean size, and age (Daskalov and Prodanov, 1994; Prodanov et al., 1997; Daskalov, 1998).
After the 1990 stock collapse, sprat recruitment, biomass and catches started to increase, and the stock reached the previous peak-level recorded in the 1980s by the mid-1990s and even higher stock size at 2005. The catch, however, stayed at relatively low level because of the stagnated economies of Bulgaria, Romania and Ukraine, although the fishing mortality increased from 0.1 in 1990 to 0.3 in 2000. Consequently, the catch attained its former level in the 1980s after 1995 and reached ~70 000 tons in 2001 ����� 2005. The decreasing CPUE and mean catch size in Bulgarian and Romanian fisheries in 2006 ����� 2007 indicate that the current level of fishing pressure might be too strong for the size of exploited stock biomass and therefore further catch limitations may be needed.
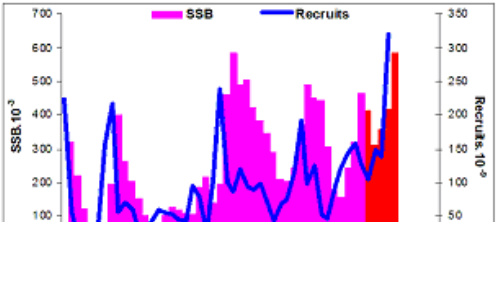
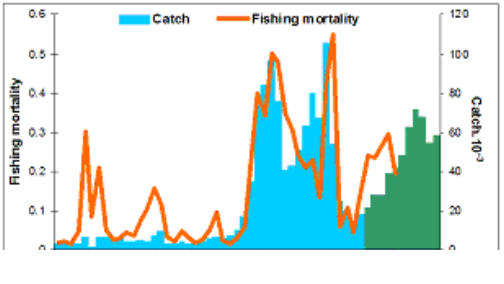
Fig. 9.8. Time-series of recruitment, spawning stock biomass (SSB), catch and fishing mortality of Black Sea sprat.
9.3.2. Black Sea anchovy
Two different anchovy populations exist in the Black Sea: the Black Sea and the Azov Sea anchovies (Ivanov and Beverton, 1985). The latter reproduces and feeds in the Azov Sea and hibernates along the northern Caucasian and Crimean coasts. The stock of the former species is of bigger ecological and commercial importance and the information given below concerns only this stock. Anchovy plays a crucial role in the Black Sea pelagic food web as a prey of many predators such as bonito, blue fish, horse mackerel, dolphins, and the others. It is also an important consumer of zooplankton, especially when the stock is large; thus they act as a predator of zooplankton and competitor of other planktivores (Daskalov et al., 2007).
The Black Sea anchovy is distributed over the whole Black Sea. In October ����� November, it migrates to the wintering grounds along the Anatolian and Caucasian coasts and forms dense wintering concentrations until March and becomes subject to intensive commercial fishery. It occupies its usual spawning and feeding habitats across the sea in the rest of the year with preferentially in the shelf areas including the northwestern part of the sea being the largest and most productive shelf (Faschuk et al., 1995; Daskalov, 1999).
Anchovy reaches maturity several months after spawning that takes place during the summer within the warm surface mixed layer in coastal and shelf waters (Arkhipov, 1993; Fashchuk et al. 1995).�� Eggs and larvae are retained in coastal regions protected from offshore waters by thermohaline fronts. A large convergence zone formed in the northwestern and the western shelf (the main anchovy spawning area) due to the River Danube inflow favors fish offspring retention.
Anchovy is subject to both artisanal (with coastal trapnets and beach seines) and commercial purse-seines fishery on their wintering grounds. The total anchovy standing stock biomass (SSB) in the Black Sea until 1993 has been assessed using the catch-at-age data in the VPA method (Prodanov et al., 1997). Its more recent changes (after 1993) was estimated using a linear regression between logarithmically transformed SSB and CPUE data of the Turkish purse seine fleet and using the fishing mortality estimation as the ratio of landings and SSB (Daskalov et al., 2007).
Time-trajectories of abundance, catch and fishing mortality shown in Fig. 9.9 reveals pronounced decadal fluctuations as in the case of sprat. The increase in biomass and catch during the 1970s and 1980s was promoted by the expansion of powerful trawl and purse seine fishing fleets in Turkey and thus a steady increase in fishing effort (Anon, 1997; Gucu, 1997). During the years 1974 to 1980, the anchovy stock (largely formed by juveniles of the age 0.5 year) showed upward trend increasing from 800 to 1600 ����� 1800 thousand tons. The anchovy catch also increased from 152 to 460 thousand tons but the rate of removal did not exceed 50% of the stock (Prodanov et al., 1997). After the 1981/82 fishing, the limit of fishing mortality for safe stock exploitation (F0.1) has been systematically exceeded (Shlyakhov et al., 1990), causing an average annual reduction of 7% over 1981-1986. The high catches were however maintained by the relatively large reproductive stock. First signs of overfishing appeared after 1984 (Shlyakhov et al., 1990) when anchovy shoals were difficult to be found and the fishery enterprises incurred losses. However, the real catastrophe happened after 1986, when the stock shrunk from 1200 to 500 thousand tons in two subsequent years. Catches during the 1986/87 and 1987/88 remained high, at the level of 452 ����� 469 thousand tons, but in the following 1988/1989 fishing season the catch suddenly dropped to 188 thousand tons. The annual rate of stock reduction was 25% for 1987 and 44% for 1988 on average 29% for 1987 ����� 1988. The fat content was lower by 40 ����� 60% than the previous years. Then, the stock experienced an abrupt decline to less than 300 thousand tons in 1990 that was the lowest level over the period 1967 ����� 1993. The fishing effort and fishing mortality also dropped subsequently because of decreasing profitability of fishing. During the collapse phase the size/age structure of the catch shifted toward a predominance of small, immature individuals (Prodanov et al. 1997; Gucu 1997; Mikhailov and Prodanov, 2002). In 1995 ����� 2005, the stock partially recovered and catch increased to 300,000 ����� 400,000 tons (Fig. 9.9), but because the fishing effort and catch remained relatively high (Zengin, 2003), the exploited biomass could not reach its levels in the 1980s. Anchovy compete for food with M. leidyi (Grishin et al., 1994) and this competition probably further affected the anchovy population growth (Oguz et al., 2008).
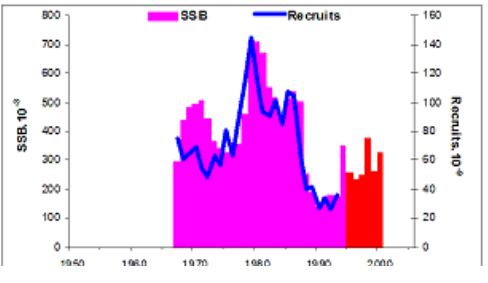
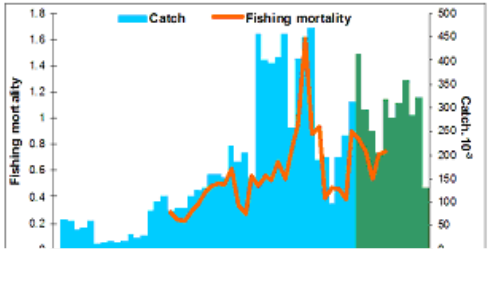
Fig. 9.9. Time-series of recruitment, spawning stock biomass (SSB), catch and fishing mortality of the Black Sea anchovy.
Simonov et al. (1992) and Panov and Spiridonova (1998) have found that anchovy abundance and aggregation behavior depended on hydro-climatic factors. They used some climate indices like SST at Batumi and atmospheric circulation to identify climatic regulation of the anchovy stock. As in the case of sprat, the generalized additive modeling (GAM) related favorable anchovy reproduction to high stratification, high SST, low wind stress as well as biological production expressed by the phosphate concentration as a proxy variable (Daskalov, 2003). Probably the strongest environmental effect on anchovy stock by the end of the 1980s was the food competition with and predation by the invasive ctenophore M. leidyi as supported by the modeling studies (Oguz et al., 2008). The initial outbreak of M. leidyi was reported in 1988-89 in the Black and Azov Seas. It appears that the catastrophic reduction of the Black Sea anchovy stock in the late 1980s was due to the combined action of two factors: the excessive fishing and M. leidyi outburst (Grishin et al., 2007). The total loss from the anchovy catch over the years 1989-1992 due to M. leidyi outbreak can be roughly estimated of about 1 million tons causing estimated losses of US$16.8 million (Knowler, 2005). Damage by M. leidyi to the anchovy population was most likely done through food competition, as unusually low levels of the summer food zooplankton have been observed in the top 50m layer in the early 1990s (Grishin et al., 2007; Oguz et al., 2008). Anchovy larvae could also be affected by M. leidyi predation. Mass appearance of anchovy larvae in the plankton occurred in July and August during the M. leidyi biomass seasonal peak (Grishin et al., 2007). M. leidyi was capable of consuming a daily ration several times greater than its own weight (Lipskaya and Luchinskaya, 1990; Grishin, 1994). Its food spectrum was quite wide and included anchovy eggs and larvae as well (Tsikhon-Lukonina and Reznichenko, 1991). There was an overlap in the distributions of anchovy larvae and M. leidyi, even though anchovy larvae were predominantly found in the narrow coastal zone while the ctenophore was also distributed further offshore.
The state of the anchovy stock has improved after the collapse in 1990s, and in 2000-2005 the catches reached ~300 thousand tons. However, the anchovy catch dropped substantially in 2006 indicating a distressed stock condition (M. Zengin, personal communication).�� The other possible cause of the drop in anchovy stock include climatic effects (higher water temperature may cause a dispersal of fish schools making them less accessible to the fishing gears) and abundant predators (bonito). Given the strong natural variability, transboundary migratory behaviour, and sensitivity to various environmental impacts, the protection and sustainable use the anchovy resource can be achieved only by coordinated international management and regulation based on sound scientifically grounded stock assessment.
9.3.3. Horse mackerel
The Black sea horse mackerel is a subspecies of the Mediterranean horse mackerel Trachurus mediterraneus. It is a migratory species distributed in all over the sea (Ivanov and Beverton, 1985; Fashchuk et al., 1995). In the spring, it migrates to the north for reproduction and feeding. In the summer, it is distributed preferably in the shelf waters above the seasonal thermocline. In the autumn, it migrates towards the wintering grounds along the Anatolian and Caucasian coasts (Ivanov and Beverton, 1985). It matures at an age of 1 ����� 2 years during the summer, which is also the main feeding and growth season. It spawns in the upper layers, both in the open part of the sea and near the coast (Arkhipov, 1993; Fashchuk et al., 1995). Eggs and larvae are often found in areas with high productivity (Daskalov, 1999; 2003).
The horse mackerel (Trachurus mediterraneus) fishery operates mainly on its wintering grounds in the southern Black Sea using purse seine and mid-water trawls. The horse mackerel of age 1-3 years generally prevails in the commercial catches, but strong year classes (for example, the 1969 year class) may enter into exploitation at the age of 0.5 year. Over the last 40 years, highest horse mackerel catches were reported in the years preceding the M. leidyi outbreak (Prodanov et al., 1997; FAO, 2007). The maximum catch of 141 thousand tons was recorded in 1985, from which ~100 thousand tons were caught by Turkey (Prodanov et al., 1997). In the next four years catches remained at the level of 97 ����� 105 thousand tons. In the period 1971 ����� 1989, the stock increased, although years of high abundance alternated with years of low abundance due to year class fluctuations, typical of this fish (Fig. 9.10). VPA estimates showed that the stock was highest in 1984-1988 (Fig. 9.10). According to Bryantsev et al. (1994) and Chashchin (1998), the intensive fishing in Turkish waters in 1985 ����� 1989 led to overfishing of horse mackerel population and reduction of the stock and catches in the subsequent years. A drastic decline in stock abundance occurred after 1990 when the stock was diminished by 56%. In 1991 the horse mackerel stock dropped to a minimum of 75 thousand tons and the catch dropped to 4.7 thousand tons that was a twenty fold reduction compared to the average annual catch in 1985 ����� 1989.
In contrast to anchovy and sprat, the horse mackerel stock still remained in a depressed state. The horse mackerel fishery was extremely limited in the former USSR countries during 1992 ����� 1998 because of the lack of fishable aggregations on the wintering grounds. Small quantities of horse mackerel were caught with trap-nets in coastal areas of the Crimea and Caucasus. In Turkish waters, horse mackerel catch in 1994 ����� 2006 were 9 ����� 11 thousand tons, i.e. at the level of the years 1950 ����� 1975 before the start of industrial fishing.
The horse mackerel recruitment has been highly variable that therefore supported sporadic year-class strength (Fig. 9.10). The influence of a strong year-class can be traced through biomass increase in the subsequent one-two years. The relationships with selected environmental variables (Daskalov, 1999; 2003) suggested a strong negative correlation with surface temperature (SST) as also reported by other studies (Mikhayluk, 1985; Simonov et al., 1992). It may appear surprising for a warm-water summer spawning species to correlate with cold SST. The effect of the wind stress was significant and generally positive. These results indicated that horse mackerel recruitment has been more abundant in years with increased physical forcing and enrichment.
During 1985 ����� 1993, a relatively successful recruitment was recorded only in 1988 (Fig. 9.10). Despite its coincidence with the first year of M. leidyi outbreak, the juveniles from this cohort were sufficiently well-supplied with food. As the first outburst of M. leidyi occurred in the autumn of 1988, the summer zooplankton maximum production did not suffer much from the devastating effect of M. leidyi. The copepods Oithona nana and Oithona similis which constituted the main food of larval horse mackerel (Revina, 1964) were especially abundant. However, the favorable trophic conditions for larvae in summer 1988 failed to ensure the formation of a strong year-class because juveniles were faced with strong feeding competition with M. leidyi further in the year. Sharp decline in Oithona under the predation pressure of M. leidyi in the subsequent years (Shushkina and Musaeva, 1990; Vinogradov et al., 1993) affected the survival of horse mackerel. Dietary studies of juvenile and adult horse mackerel (Revina, 1964) have shown that both the habitat diet of juvenile horse mackerel and M. leidyi overlapped; therefore the strong feeding pressure by M. leidyi on zooplankton directly affected larval and juvenile horse mackerel.
9.3.4. Ecosystem effects on pelagic fisheries
Over the decades, fishing has become a leading anthropogenic stressor, affecting not only fish stocks but also triggered large-scale ecosystem effects such as trophic cascades and regime shifts characterized by sudden, irreversible switches (Daskalov et al., 2007). Overfishing in combination with fluctuating climate was recognized as main causes of the fisheries collapses (Oguz and Gilbert, 2007). Deteriorating environment and alien introductions exacerbated the problem. Overfishing and alien intrusion at high trophic levels drove trophic cascades and switched dominance from valuable fisheries resources to an excess of jellyfishes and microalgae. Interaction between environmental, biological and anthropogenic factors generated feedbacks resulting in harmful plankton blooms, hypoxia, and hydrogen sulphide production, adversely affecting the ecosystem as a whole and fish stocks in particular. The complex nature of ecosystem responses to human activities calls for more elaborate deterministic-based management approaches than currently provided by traditional environmental and fisheries assessment methodologies.
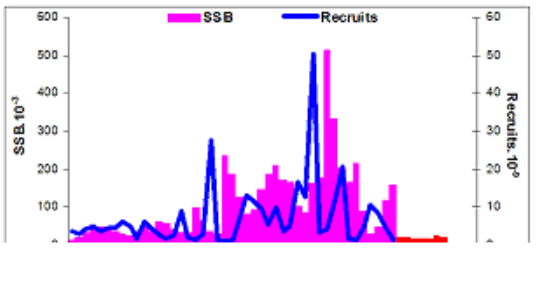
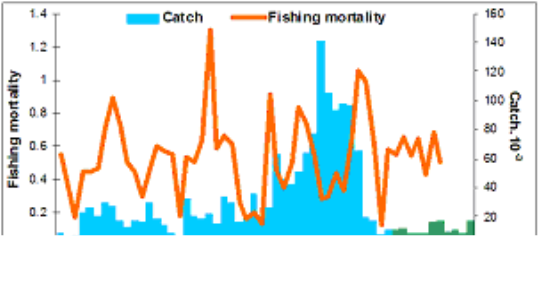
Fig. 9.10. Time-series of recruitment, spawning stock biomass (SSB), catch and fishing mortality of the Black Sea horse mackarel.
9.4. The state of populations of key demersal fishes
From the Black Sea fisheries perspective, the most important demersal fish species are whiting (Merlangius merlangus), picked dogfish (Squalus acanthias), turbot (Psetta maxima), striped, red mullets (Mullus barbatus, M. surmuletus), and four species of family Mugilidae, including so-iuy mullet (Mugil soiuy). The total catch of these demersal fish species in 1996�����2005 was lower on the average than in 1989 ����� 2005 and had tendency of reduction after 2000 (Fig. 9.11).
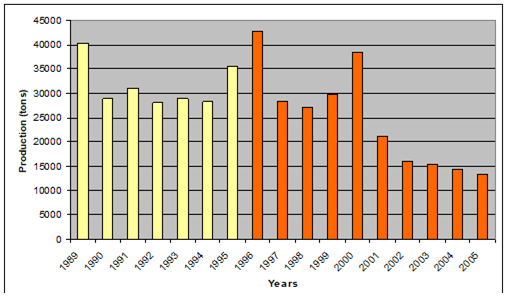
Fig. 9.11. Total catch of main demersal fishes in the Black Sea during 1989 ����� 2005.
9.4.1. Whiting
In the Black Sea, whiting is one of the most abundant species among the demersal fishes. It does not undertake distant migrations, spawns mainly in the cold season within the whole sea. Whiting produces pelagic juveniles, which inhabits the upper 10-meter water layer for a year. The adult whiting is cold-living species at temperatures 6 ����� 10�� С (Shlyakhov, 1983). Species younger than 6 years old dominate the populations, and older year classes are found rarely in catches. Dense concentrations are formed by 1-3 year old fishes at depths up to 150 m, most often at the depth range 60 ����� 120 m (���zdamar et al, 1996; Shlyakhov and Charova, 2003).
In Bulgaria, Georgia, Romania, the Russian Federation and Ukraine, whiting was rarely a target species and collected mainly as by-catch during trawl fisheries or non-selective fisheries with fixed nets in the coastal sea areas. This fishery was most developed in Romanian waters. In 1996 ����� 2005, the total mean annual catch of whiting by Black Sea countries (except Turkey) according to the data of official statistics submitted to FAO was less than 0.6 thousand tons (Table 9.4). Whiting landings by-caught in larger quantities during target trawl fisheries for sprat and other fishes in Bulgaria, Georgia, Romania and the Russian Federation were specified in the official reports of these countries. Thus, the whiting by-catch in the waters of Ukraine in 1996 ����� 2002 was assessed in the range of 0.65 ����� 1.8 thousand tons (Shlyakhov and Charova, 2003). On the other hand, by-catches of small-sized whiting populations were often not graded and merely discarded (although it is prohibited by the Regulations of Fisheries) or recorded in statistics as sprat.
In the vicinity of southern coast, whiting concentrations are more stable.�� Turkey is the only country in the region to conduct the target trawling fisheries for this fish with permission between September and April within offshore areas outside the 3 miles zone from the coast.�� Among by-catch fishes in the Turkish fisheries, whiting usually is therefore ranked third or fourth. Its annual catch varied from 6 thousand tons to 19 thousand tons during 1996 ����� 2005, making on the average 10.8 thousand tons. As compared with 1989 ����� 1995, when the mean annual catch of whiting was 17.6 thousand tons, the tendency towards reduction of both its catches and CPUE is observed (Fig. 9.12).
Using the VPA method, Prodanov et al. (1997) produced assessments for whiting abundance and biomass for the period of 1971 ����� 1993. No such basin-scale assessments however existed for 1996 ����� 2005, except for the western Black Sea excluding the western Turkish coastal waters (Prodanov and Bradova, 2003). According to this latter assessment, whiting biomass in 1997 was assessed as 121 thousand tons, which was comparable with the long-term mean after decline in 1990 ����� 1991 (Fig. 9.14).
Table 9.4. Whiting and picked dogfish catches in the Black Sea according to the official statistics. The last three rows provide the average catches for the periods indicated in the subscripts.
| Year | Whiting | Picked dogfish | ||||||||||
| BG | GEO | RO | RF | TR | UKR | BG | GEO | RO | RF | TR | UKR | |
| 1989 | 0 | 5 | 2739 | 7 | 19283 | 579 | 28 | 217 | 30 | 135 | 4558 | 1191 |
| 1990 | 0 | 70 | 2653 | 235 | 16259 | 87 | 16 | 128 | 45 | 183 | 1059 | 1330 |
| 1991 | 0 | 82 | 59 | 210 | 18956 | 24 | 21 | 18 | 26 | 67 | 2017 | 755 |
| 1992 | 0 | 70 | 1357 | 37 | 17923 | 0 | 15 | 14 | 52 | 15 | 2220 | 595 |
| 1993 | 0 | 172 | 599 | 2 | 17844 | 5 | 12 | 131 | 6 | 5 | 1055 | 409 |
| 1994 | 0 | 187 | 432 | 125 | 15084 | 64 | 12 | 45 | 2 | 11 | 2432 | 148 |
| 1995 | 0 | 146 | 327 | 91 | 17562 | 17 | 80 | 31 | 7 | 90 | 1562 | 67 |
| 1996 | 0 | 223 | 389 | 11 | 19326 | 3 | 64 | 71 | 0 | 15 | 1748 | 44 |
| 1997 | 0 | 58 | 441 | 10 | 12725 | 29 | 40 | 1 | 0 | 9 | 1510 | 20 |
| 1998 | 0 | 53 | 640 | 119 | 11863 | 55 | 28 | 550 | 0 | 6 | 855 | 38 |
| 1999 | 0 | 41 | 272 | 184 | 12459 | 18 | 25 | 18 | 0 | 9 | 1478 | 94 |
| 2000 | 0 | 45 | 275 | 341 | 15343 | 20 | 102 | 21 | 0 | 12 | 2390 | 71 |
| 2001 | 8 | 32 | 306 | 642 | 7781 | 18 | 126 | 27 | 0 | 27 | 576 | 134 |
| 2002 | 16 | 37 | 85 | 656 | 7775 | 9 | 100 | 65 | 0 | 19 | 316 | 97 |
| 2003 | 13 | 45 | 113 | 93 | 7162 | 21 | 51 | 40 | 0 | 29 | 1840 | 172 |
| 2004 | 2 | 29 | 118 | 55 | 7243 | 43 | 47 | 31 | 0 | 34 | 111 | 93 |
| 2005 | 3 | 37 | 105 | 49 | 6007 | 30 | 15 | 45 | 0 | 17 | 102 | 74 |
| Y89/95 | 0 | 105 | 1167 | 101 | 17559 | 111 | 26 | 83 | 24 | 72 | 2129 | 642 |
| Y96/05 | 4 | 60 | 274 | 216 | 10768 | 25 | 60 | 87 | 0 | 18 | 1093 | 84 |
| Y00/05 | 7 | 38 | 147 | 306 | 8552 | 24 | 74 | 38 | 0 | 23 | 889 | 107 |
Along the eastern coast of Turkey in 1990 ����� 2000, more than 80% of landings of whiting were caught by trawl (Zengin, 2003).���� The research on trawl fisheries in the vicinity of Samsun indicated that as much as 75% of whiting trawl catches were discarded in 2005 (Knudsen and Zengin, 2006) due to their small size average length (Fig. 9.13).
In the Russian sector of the Black Sea, trawl surveys showed that stocks of whiting and other Gadidae (Gaidrosparus mediterraneus) were estimated about 7.6 ����� 8 thousand tons, and the total annual allowable catch (TAC) for whiting was 2 thousand tons (Volovik and Agapov, 2003). The corresponding assessments for 1999 ����� 2005 given in Table 9.5 testify rather high stable level of biomass in the Russian waters with an average value of 6.6 thousand tons.�� If the whiting portion of total by-catch is assumed to be 9% of sprat catch in 1996 ����� 2005 (as in Bulgarian case), the average annual capture of whiting is assessed as 1.2 thousand tons that, in agreement with the estimate by Volovik and Agapov (2003), suggests under-exploitation of whiting resources.
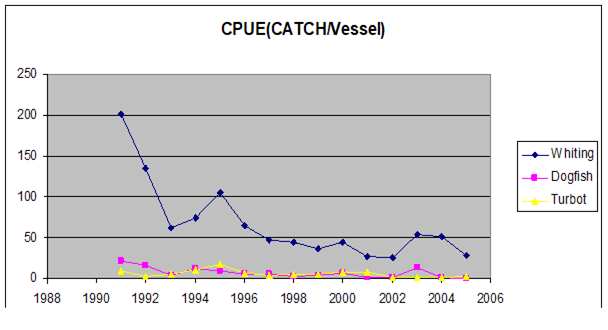
Fig. 9.12. Long-term changes of CPUE for three demersal species in Turkish waters of the Black Sea in 1989 ����� 2005 (from the TDA Technical Task Team National Experts ����� Turkey Report, Duzgunes, 2006).
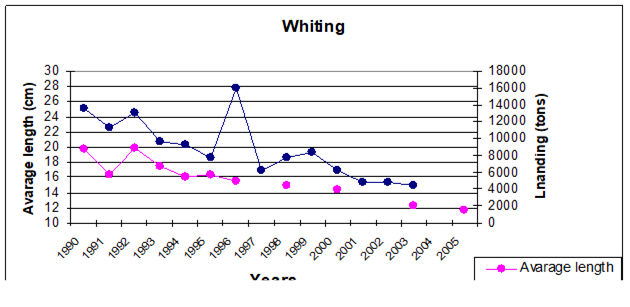
Fig. 9.13. Whiting landings and average length of whitings harvested in the eastern Black Sea region of Turkey. (Taken from Knudsen and Zengin, 2006).
Along the Turkish coasts, the total biomass of whiting in local trawling areas was estimated by A. İşmen (2003). The highest biomass of 30 thousand tons was found between Sinop and Sarp (eastern Black Sea), which is the area closed to trawl fishing in 1992. The biomass between Sinop (central Black Sea) and İğneada (western Black Sea) was estimated within the range of 1.1 ����� 1.7 thousand tons in 1990. But, there are no similar published assessments for the period of 1996 ����� 2005. It is therefore more difficult to identify the present state of rather intensively exploited whiting stocks in the Turkish waters. However, the change of mean length of whiting from 16 ����� 20 cm range in 1989 ����� 1995 to 14 cm in 2000, 12 cm in 2003 and 11 cm in 2005 highly likely implies an intensive whiting fishery within the recent years as further supported by independent statistical-based studies conducted by Gen�� et al. (2002) and İşmen (2003). Thus, whiting stock in the waters of Turkey may be characterized as excessively exploited. The main reason for whiting overfishing in Turkey may be the lack of any limitation for annual catch sizes and/or fishing efforts.��

Fig. 9.14. Whiting biomass by age groups (in thousand tons) in the western part of the Black Sea during the period of 1971 ����� 1997. (Taken from Prodanov and Bradova, 2003).
Table 9.5. Whiting stock in the Russian waters in the northeastern Black Sea (thousand tons) (taken from the TDA Technical Task Team National Experts ����� Russian Federation Report, 2006).
| Years | 1999 | 2000 | 2001 | 2002 | 2003 | 2004 | 2005 |
| Stock | 7.1 | 7.6 | 7.0 | 5.8 | 6.85 | 6.0 | 6.0 |
For 1992 ����� 1995 whiting biomass in the waters of Georgia, the Russian Federation and Ukraine was identified within the range 64 ����� 103 thousand tons, on the average 82 thousand tons. The range and the average stock size for 1996 ����� 1998 were 68 ����� 77 thousand tons and 72 thousand tons, respectively (Shlyakhov and Charova, 2003). In 1992 ����� 1995 whiting biomass in the Ukrainian waters changed from 43 to 70 thousand tons, on average 54 thousand tons. For the subsequent decade, they were 40-68 thousand tons and 52 thousand tons, respectively (Shlyakhov, Charova, 2006). These data testify rather high inter-annual fluctuations but rather stable average level of whiting biomass in the regions where whiting specialized fisheries was almost absent and trawling fisheries were not conducted on the grounds with the densest whiting distributions. In the Ukrainian sector, whiting catch in 1996 ����� 2005 did not exceed 30% of allowable catch (Shlyakhov, Charova, 2003; 2006). Therefore resources of whiting are underexploited in Ukraine.
These official statistics provided by the Black Sea countries however may not reflect the true harvesting that may indeed higher. For this reason, the assessments of the stock abundance made from the scientific trawl surveys or estimates produced using the obligatory correction of unregistered catch seem to be more realistic. Using one latter type data set, an independent assessment of whiting average annual capture in 1996 ����� 2005 on the shelf from the border with Turkey to the Danube estuary was computed as 670 tons that turned out to be 2.4 times higher than the value of 278 tons based on the official catch statistics. Thus, it appears that the official statistics underestimates considerably the real catch.
Prodanov and Bradova (2003) and Radu et al. (2006) noted the important role of improved ecological conditions of the Black Sea environment after 1993 for the tendency of increasing whiting biomass along the Bulgarian and Romanian coasts. In their opinion, rehabilitation of small-sized pelagic fish stocks reduced the pressure on whiting populations, thus leading to a slight recovery of their stock. Another likely cause of rehabilitation of the whiting stocks may be naturally-caused year-to-year variations in their reproduction, length-weight and age parameters (Shlyakhov, 1983), whereas intensity of whiting fisheries along the coasts of Bulgaria and Romania has been too low to exert major effect on its abundance and biomass.
Table 9.6. Fish stocks protection measures for whiting implemented by the Black Sea countries.
| Fish Stocks Protection Measures applied in the Black Sea coastal states | Coastal states | |||||
| BG | GEO | RO | RU | TR | UA | |
| Periodic ban | + | + | + | + | + | + |
| Total Allowable Catch (TAC) | + | + | + | + | + | |
| Total Permitted Catch (Limit) | + | + | ||||
| Minimum admissible size | + | + | + | + | + | + |
| Periods for fishing bans | + | + | + | + | + | + |
| Fishing Free Zones | + | + | + | |||
| Prohibited fishing gears | + | + | + | + | + | + |
| Allowable mesh size for nets | + | + | + | + | + | + |
In all the Black Sea countries, protection measures for fish stocks were adopted including whiting (Table 9.6). However, implementation of TACs, quotas without efficient enforcement of the measures does not avoid the overfishing problem and other negative impacts of fisheries on exploited species. On the basis of the assessments of national experts in fisheries, the main transboundary threats for whiting are listed as follows.
���������� Lack of regional cooperative management of fisheries. For the group of non-migratory fishes with shared stocks where whiting belongs, management of shared stocks can be successful only with rather developed regional cooperation. It requires a unique methodological approach in all the aspects of stock assessment (methodology, collection, processing and analysis of common data set, etc.), agreed measures of fisheries regulation (terms and grounds of banning, permitted fishing gears, mesh size for nets, fishable length of fishes, allowable by-catches for juveniles, etc.), agreed system of satellite monitoring for commercial fishing vessels and many other aspects.
���������� Illegal fishing and use of destructive harvest techniques. Illegal fishing has never been and will not be a real threat for whiting population.�� But the use of destructive harvest techniques by trawls due to high by-catch capture rate of the year 0+ small-sized populations is a real threat. In addition to its direct threat on the reduction of whiting recruitment, it may indirectly cause wrong TAC assessments and thus false decision-making.��
���������� Eutrophication and pollution. The alterations of trophic flow structure due to eutrophication-induced effects in the ecosystem may be critical for whiting populations because zooplankton, small pelagic fishes and benthos organisms (crustaceans and Polychaetae) are among their important diet. In turn, whiting is an important prey species for large predators, dolphins and fish-consuming birds. Whiting juveniles and bottom-dwelling whiting at age less than 2 years old distributed mainly in shallow depths are the most vulnerable for eutrophication effects.
9.4.2. Picked dogfish
Picked dogfish inhabits the whole Black Sea shelf at water temperatures 6 ����� 15�� С. They migrate in the form of large schools for feeding and overwintering on anchovy and horse mackerel to the Crimean, Caucasus and Anatolian coasts in autumn. In the Ukrainian and Romanian grounds of whiting and sprat concentrations, abundant wintering concentrations of picked dogfish are also observed at depths from 70-80 m to 100 ����� 120 (Kirnosova and Lushnicova, 1990). Reproductive migrations of picked dogfish take place in spring and autumn at coastal shallows at 10 ����� 30 m depths zones (Maklakova and Taranenko, 1974). The major grounds for reproduction are the Crimean coastal waters such as the Karkinitsky Bay, the vicinity of Kerch Strait, and the Feodosia Bay. Picked dogfish belongs to long-living viviparous fish; therefore reproduction process includes copulation and birth of fries. Near the coasts of Bulgaria, Georgia, Romania, Russian Federation and Ukraine the maximum copulation takes place in March ����� May. Two peaks of birth of juveniles can be distinguished ����� spring (April-May) and more powerful ����� summer-autumn (August ����� September) at water temperature range of 12 ����� 18��С (Serobaba et al., 1988). The picked dogfish population includes 19 year-classes and among commercial fish species of the Black Sea this species is inferior only to sturgeons in duration of life cycle.
It is not a target species of fisheries, and mostly caught as by-catch in trawl and purse seine operations mainly during their wintering period. The largest catches of picked dogfish are along the coasts of Turkey. In the Ukrainian waters, picked dogfish is mainly harvested in spring and autumn months by target fishing with nets of 100 mm in mesh and with long-lines as well as during sprat trawl fisheries as by-catch. For the whole population of picked dogfish in the Black Sea stock assessments for 1972 ����� 1992 were produced by the VPA method (Prodanov et al., 1997), and trawl surveys and mathematical modelling (Shlyakhov and Charova, 2006) (Table 9.7). In 1989 ����� 2005, picked dogfish stock on the Ukraine shelf reduced gradually. Such dynamics of the stock agrees well with Turkish data concerning variations of CPUE (see Fig. 9.15). According to the assessments of Prodanov et al. (1997), the picked dogfish stock increased until 1981 due to increased abundance of their main dietary species (whiting, sprat, anchovy and horse mackerel), and then started decreasing due to intensification of the dogfish fishery.
Evidently, the role of fisheries in reduction of picked dogfish stock was over-estimated at that time. In fact, for 1979 ����� 1984 the mean annual capture from the stock in the Black Sea made up 8254 tons or about 4% of the initial stock, and it reduced to 3.5% in 1989 ����� 1992 (Kirnosova, 1990). Even taking into account unreported catches of picked dogfish, which in late 1980s seemed not to exceed the official catch (at least in the waters of Ukraine ����� Shlyakhov and Charova, 2003), real capture was not excessive. The mean length of picked dogfish in the northwestern Black Sea in trawl catches in 1989 ����� 2005 did not reduce and even increased (Fig. 9.15), that do not imply overexploitation of this species. The causes of reduction of picked dogfish stock should therefore be related to the changes in the Black Sea ecosystem due to pollution and subsequent progressive deterioration of reproductive ability of females (Shlyakhov and Charova, 2003). In the 1970-1980s, the mean number of yolk ovocytes and embryos for one female was 22 and14, respectively, and they were reduced to 19.5 and 12.4 by late 1990s. As a result, the abundance of recruits reduced year by year.
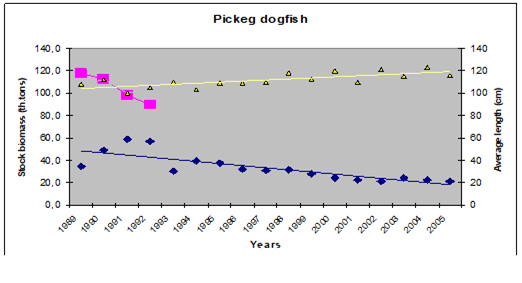
Fig. 9.15. Biomass of picked dogfish in the Black Sea-BBS (Prodanov et al., 1997), in the waters of Ukraine����� BUA (Shlyakhov, Charova, 2006) and the mean standard length (l average) in trawl catches of picked dogfish in the northwestern part of the sea: Trend lines are shown for the BUA and l average data series.
Table 9.7. Commercial stock of picked dogfish in the Black Sea and along the coast of the former USSR and in the water of Ukraine in 1989 ����� 2005, thousand tons
| Years | Whole Black Sea shelf | Waters of Ukraine, the Russian Federation and Georgia | Waters of Ukraine | ||
| VPA | Trawlsurvey | Modeling | Trawl survey | Modeling | |
| 1989 | 117.8 | 58.5 | 63.5 | 34.6 | - |
| 1990 | 112.9 | 58.7 | 63.2 | 48.8 | - |
| 1991 | 97.9 | 17.2/69.9* | 64.0 | 14.4/58.5* | - |
| 1992 | 90.0 | 62.9 | 60.3 | 56.9 | - |
| 1993 | - | - | 57.1 | 30.2 | - |
| 1994 | - | - | 52.9 | 36.0 | 42.1 |
| 1995 | - | - | - | - | 37.6 |
| 1996 | - | - | - | - | 32.1 |
| 1997 | - | - | - | - | 31.0 |
| 1998 | - | - | - | 32.0 | 30.8 |
| 1999 | - | - | - | - | 28.0 |
| 2000 | - | - | - | - | 24.3 |
| 2001 | - | - | - | - | 22.3 |
| 2002 | - | - | - | - | 21.0 |
| 2003 | - | - | - | - | 22.1 |
| 2004 | - | - | - | - | 22.3 |
| 2005 | - | - | - | - | 21.0 |
* stock assessment is reduced to the average area of the registration (survey) zone
The main threats for the Black Sea picked dogfish resource with transboundary significance are the same as for whiting. One more threat may be added to that list:
Pollution from land based sources (rivers) and direct discharges (inshore area). As a long-living predator as compared with other fishes in the Black Sea, picked dogfish has the ability to accumulate toxic pollutants ����� heavy metals (mercury, arsenic, lead, copper, cadmium and zinc) and chlorine organic compounds (including and its metabolites, polychloride biphenyls, etc.).
9.4.3. Turbot
Turbot occurs all over the shelf of the Black Sea. It is a large-sized fish with long life cycle; it reaches length of 85 cm, weight of 12 kg and age of more than 17 years old in the Black Sea (Svetovidov, 1964). Turbot fecundity is very high, up to 12.8 million of eggs per year. Larvae and fries in the first two months inhabit in the pelagic zone, feeding on zooplankton. Adults feed on fish mainly, both on demersal (whiting, red mullet and gobies), and with pelagic species (anchovy, sprat, horse mackerel, shad) species. Diet of turbot also includes crustaceans (shrimps, crabs, etc.), mollusks and polychaetes. Like whiting, it does not undertake distant transboundary migrations. Local migrations (spawning, feeding and wintering) have a general direction from the open sea towards the coast or from the coasts towards offshore. It matures in majority at the age of 3 ����� 5 years in the waters of Bulgaria (Ivanov and Beverton, 1985), at the age of 5 ����� 6 years in the waters of Ukraine and the Russian Federation (Popova, 1967). It spawns in spring, from the late March until the late-June, at water temperature range 8 ����� 12��С. The peak of spawning occurs in May at depths from 20 ����� 40 to 60 m. After the spawning, turbot moves downwards to the depths 50 ����� 90 m and maintains low-activity life with limited feeding until the early autumn. In autumn turbot returns coastal waters again, where it feeds intensively. For wintering it migrates to the depths from 60 m to 140 m.
In all the Black Sea countries, turbot is one of the most valuable fish species. Its target fisheries is conducted with bottom (turbot) gill nets with minimum mesh size 180 mm in the waters of Bulgaria, Georgia, Romania, the Russian Federation and Ukraine (Prodanov et al., 1997) and with minimum mesh size 160 ����� 200 mm as well as with bottom trawls with minimum mesh 40 mm in the waters of Turkey (Tonay and ���zt��rk, 2003). Turbot as a by-catch is harvested during target fisheries of other species with trawls, long-lines and purse seines. According to Zengin (2003), 72% of turbot fishing in Turkish waters of the Black Sea has been carried out by bottom gill nets, 26% by trawls and 2% as the by-catch from purse seines. More than 80% of the Ukrainian turbot catches were performed by target fisheries using nets with mesh size 180�����200 mm, the rest part mainly corresponded to by-catch. In 1996 ����� 2005, the mean annual Turkish turbot catch was 1235 tons, and 177 tons for the rest of the Black Sea countries (Table 9.8). The turbot fishery was completely banned or largely limited by the Total Permitted Catch in all countries except Turkey in the early 1990s and therefore was at a negligible level.
Like for many demersal fish species, the serious problem for estimating the status of turbot population and justifying efficient measures for its fisheries regulation is considerable difference between the recorded statistics and the real catches. According to the expert assessments (Shlyakhov and Charova, 2003), the unregistered annual yield of turbot for Ukrainian waters was in the range of 0.2 ����� 0.8 thousand tons in 1992 ����� 2002. These assessments are not complete, as they included only the unregistered turbot by-catch during sprat fisheries and poaching (illegal) catches of Turkish vessels. But, this unregistered annual yield was even higher than official turbot statistics.
Table 9.8. Turbot catches in the Black Sea in 1989 ����� 2005 in tons. The last three rows show the average catches for the years indicated in the subscripts.
| Year | Turbot | |||||
| BG | GEO | RO | RU | TR | UA | |
| 1989 | 1 | 8 | 0 | 0 | 1449 | 2 |
| 1990 | 0 | 1 | 0 | 0 | 1383 | 9 |
| 1991 | 0 | 0 | 2 | 0 | 915 | 18 |
| 1992 | 0 | 0 | 1 | 1 | 418 | 19 |
| 1993 | 0 | 0 | 6 | 2 | 1585 | 18 |
| 1994 | 0 | 0 | 6 | 5 | 2114 | 16 |
| 1995 | 60 | 0 | 2 | 19 | 2850 | 10 |
| 1996 | 62 | 0 | 4 | 17 | 1924 | 39 |
| 1997 | 59 | 0 | 1 | 11 | 911 | 42 |
| 1998 | 64 | 0 | 0 | 14 | 1468 | 42 |
| 1999 | 54 | 5 | 2 | 15 | 1804 | 73 |
| 2000 | 55 | 9 | 2 | 4 | 2639 | 80 |
| 2001 | 57 | 11 | 13 | 24 | 2323 | 129 |
| 2002 | 136 | 11 | 17 | 15 | 335 | 104 |
| 2003 | 41 | 1 | 24 | 15 | 119 | 124 |
| 2004 | 16 | 7 | 42 | 2 | 274 | 133 |
| 2005 | 13 | 6 | 28 | 15 | 548 | 129 |
| Y89/95 | 9 | 1 | 2 | 4 | 1531 | 13 |
| Y96/05 | 56 | 5 | 13 | 13 | 1235 | 90 |
| Y00/05 | 53 | 8 | 21 | 13 | 1040 | 117 |
Caddy (2006) interpreted the landing data in terms of trends and suggested the baseline trend before 1989, the decreasing trend in the collapse years 1989-92, gradually increasing trend in 1992 ����� 2002, a more pronounced increasing trend in 1998 ����� 2002. The landing in 1998 ����� 2002 was 70% of the baseline and therefore suggested partial recovery in recent years. If the catch analysis takes into account exploitation of different stock units, the interpretation given by the trend analysis however changes greatly. In the base period (1967 ����� 1988) Turkish landings made up 82% of total catches of all the countries. Its fisheries was conducted mainly on local turbot stocks existed in its own waters in 1967-71 and 1985-92, but extended into the western and northwestern stocks within the international waters in 1972 ����� 1984 (Acara, 1985). By 1985, the western and northwestern stocks appeared to be overfished; for this reason since 1986 the former USSR imposed banning for turbot fisheries in its waters to which Bulgaria and Romania joined soon but Turkey refused to join to this banning. In 1986 ����� 1992 (i.e. at the end of the base period and in the years of collapse) recovery of the stocks took place with the negative trend of landings, as in this period only stocks in the Turkish waters were fished. The positive trend of landings in 1992 ����� 2002 and its steep increase in 1998 ����� 2002 was explained not only by recovery of turbot stocks in the waters of Ukraine, but by the intensification of illegal fishing of the western and northeastern stocks by Turkish vessels. As indicated by the available studies carried out in different Black Sea countries (Table 9.9), turbot stocks decreased prior to 1989 and a partial recovery of turbot biomass took place in waters of all countries except Turkey as a result of banning and limiting the fisheries by the early�����1990s.
Table 9.9. Some studies carried out in the Black Sea regions on turbot stocks.
| Researchers | Location | Years and periods | Biomass assessment (tons) | MSY or TAC(tons) | Methods |
| Prodanov et al., 1997 | Waters of the Black Sea | 1989-19901991-1992 | 191006200 | - | LCA Jones����� method |
| Bingel et al., 1996 | Southern Black Sea(Sinop-Georgia board)Western Black Sea | 1990199119921990 | 124410766130.5 | - | Swept area method (trawl surveys) |
| Zengin, 2000 | Southern Black Sea(Sinop- Georgia board) | 1990199119921993 | 686.3250.4222.4134.3 | 96.126.324.515.4 | Swept area method (trawl surveys) |
| Prodanov and Mikhailov, 2003 | Waters of Bulgaria | 2002 | Mean ����� 352Initial ����� 425 | 60 | LCA Jones����� method |
| Shlyakhov and Charova, 2003 | Waters of the Russian Federation | 1992 | 1800 | - | Swept area method (trawl surveys) |
| Volovik, Agapov, 2003 | Waters of the Russian Federation | 2000-2002 | 1000-1700 | 100 | Swept area method (trawl surveys) |
| Shlyakhov and Charova, 2003 | Waters of the Russian Federation | 1992-1994 | 4280 (1800-5900) | - | Trawl surveys and Baranov�����s modified equation |
| Maximov et al., 2006 | Waters of Romania | 2003-2005 | 427-1066 | - | Swept area method (trawl surveys) |
| Shlyakhov and Charova, 2003; 2006 | Waters of Ukraine | 1992-19951996-20022003-2005 | 8830 (8200-10400)10980 (8400-13700)9570 (8500-10200) | - | Swept area method (trawl surveys) |
| Shlyakhov and Charova, 2003; 2006 | Waters of Ukraine | 1992-20022003-2005 | 10590 (8200-13700)8900 (8200-10200) | - | Trawl surveys and Baranov�����s modified equation |
| Panayotova et al., 2006 | Waters of Bulgaria | 2006 | 1440 | - | Swept area method (trawl surveys) |
| Raykov et al., 2008 | Waters of Bulgaria | 2006 | 1567 | - | Swept area method (trawl surveys) |
Analyzing the state of the stock using official statistics of turbot capture near the coasts of Bulgaria, Prodanov and Mikhailov (2003) concluded that biomass of this species was about 2500 tons in early 60s. By late 1970s biomass reduced to 355 tons as a result of overfishing and deteriorating environment, and to 100 tons in 1993. Applying LCA method, they assessed the turbot stock as 424 tons in 2002. Increased biomass was the consequence of five-year banning for fisheries. However, comparing stock abundance and capture, they determined that the catches were composed by fish size 42 ����� 47 cm and 2 ����� 4 year old indicating turbot excessive exploitation again. According to the official statistics, landings in 2003 made up 49 tons, and in subsequent two years it reduced to 16 tons and 13 tons respectively. The last assessment indicated the turbot biomass in the Bulgarian waters as 1440 ����� 1567 tons in 2006 (Panayotova et al., 2006; Raykov et al., 2007).
Table 9.10. Biomass and catches of the turbot of the Black Sea in the waters of Ukraine in 1996 ����� 2006 (tons), mean fishing mortality, relevant to its official catches in 1992 ����� 1995 and 1996 ����� 2005.
| Years | Biomass of stocks (B) | Catch (Y) for: | Total Permitted Catch (Limit) | Official landings | ||
| Swept area method (trawl surveys) | Baranov�����s modified equation | F0.1=0.15 | Fmax=0.20 | |||
| 1996 | - | 13500 | 1792 | 2333 | 84 | 39 |
| 1997 | - | 13600 | 1805 | 2350 | 90 | 42 |
| 1998 | 8400 | 13300 | 1440 | 1875 | 90 | 42 |
| 1999 | - | 12600 | 1672 | 2177 | 190 | 73 |
| 2000 | - | 9600 | 1274 | 1659 | 185 | 80 |
| 2001 | 9900 | 10500 | 1354 | 1762 | 370 | 129 |
| 2002 | 10000 | 8700 | 1241 | 1616 | 395 | 104 |
| 2003 | 10000 | 8900 | 1254 | 1633 | 310 | 124 |
| 2004 | 8500 | 8200 | 1108 | 1443 | 350 | 133 |
| 2005 | 10200 | 7800 | 1194 | 1555 | 319 | 129 |
| 2006 | 10400 | 7600 | 1194 | 1555 | 323 | 162 |
| 1992-95 | 8871 | 1177 | 1533 | - | 14Fof = 0.001 | |
| 1996-05 | 10094 | 1411 | 1744 | 238 | 90Fof = 0.009 | |
The last research on turbot stock in the waters of Bulgaria and Romania pointed to their level of exploitation. In 2005 biomass of this species was assessed as 1066 tons (Maximov et al., 2006). Near the Russian coast, the long-term banning for turbot fisheries (since mid 1980s till mid 1990s) resulted in improvement of the state of northeastern stock. By the end of banning it was assessed as 1800 tons. According to AzNIIRKH research, the state of turbot stock is not stable, but changes occur in a rather narrow range of 1000 ����� 1700 tons (Volovik, Agapov, 2003). The observed interannual fluctuations in biomass assessments in 2000s may be caused by re-distribution of turbot between Russian and Ukrainian waters. In the opinion of Russian scientists, overexploitation of turbot in their waters for recent 10 years has not been observed.
Direct assessments of turbot biomass made using the data of trawl surveys near the coasts of Turkey eastwards to Sinop for 1990 ����� 1992 differed greatly. According to Bingel et al. (1996) increase in biomass took place in those years, and according to Zengin (2000), on the contrary, reduction in biomass occurred. According to the assessments of Prodanov et al. (1997) on the grounds of cohort analysis of the length composition of catches between 1989 and 1992 turbot biomass reduced 3.1 times in the waters of Turkey, and this tendency agreed well with 3.9 times reduction assessed by Zengin (2000). Composition of Turkish catches was evidence of capture of immature turbot at ages under 4+ that was about 63% in 1990 ����� 1995 and 62% in 1996 ����� 2000 of the population.
For recent 10 years, continuous set of the published assessments of turbot biomass is available for the waters of Ukraine where the greater part of its western population distributes. Table 9.10 gives the most detailed information on biomass dynamics and potential catch of turbot after 1996.
According to the data of the last trawl surveys proportion of biomass of the western stock and northeastern is close to 9:1, and the percentage of fish from the western stock in the annual catch of Ukraine is even more. As compared with 1992 ����� 1995, in 1996 ����� 2005 turbot biomass in the Ukrainian waters increased slightly. Trawl surveys undertaken each year since 2001 is the evidence of stable level of turbot biomass in the waters of Ukraine. In 1996 ����� 2005 the control measures enabled to avoid overfishing of turbot, and stabilized the length-weight composition of catches in the northwestern Black Sea (Fig. 9.16).
The list and significance of the main threats for turbot resources in the Black Sea are similar to those for whiting. The first place should be given to Illegal fishing and use of destructive harvest techniques. In the broad sense it is not only poaching but deliberate avoidance of adopted measures of regulation by fishermen. This threat is of social and economic character, and not easy to reduce it. An almost equivalent, in experts����� opinion, threat is the lack of regional cooperative management of fisheries.
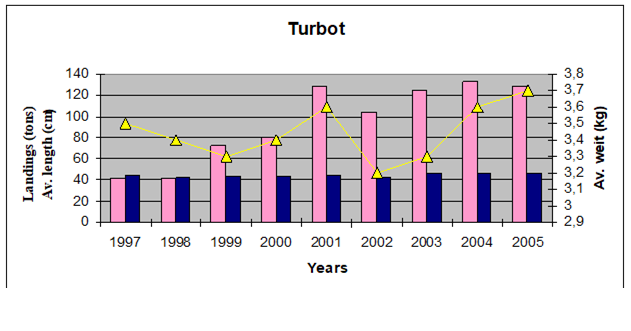
Fig. 9.16. Mean length and weight of turbot in the northwestern Black sea and its landings by Ukraine in 1997 ����� 2005.
9.4.4. Striped and red mullets
Two physiologically similar species Mullus barbatus and Mullus surmuletus belong to the family Mullidae. The species M. barbatus is also called as red mullet or striped mullet. In FAO terminology, M. barbatus is also named as striped mullet. For the convenience�����s sake we use hereinafter this name to both species of the family Mullidae.
Striped mullet is distributed all over the shelf of Black Sea. It prefers waters with the temperature higher 8�� С and salinity more than 17����. Striped mullet reaches maturity in the first-second year of its life. It lives usually until 4 ����� 5 years old reaching length of 20 cm and more. Striped mullet spawns in the warm period of time with a maximum in mid-summer. Eggs and juveniles (up to the age of 1.5 months) are pelagic; adults live near bottom, feeding on Polychaetae, crustaceans and mollusks. In the vicinity of the Crimean and Caucasus coasts, it is customarily distinguished in two particular forms ����� settled and migratory ones. The latter has higher rate of growth. Migratory form has the greater commercial value, moving to the Kerch Strait and the Sea of Azov for fattening and spawning in spring and coming back to the coasts of the Crimea for wintering.
Due to its taste, the striped mullet is a valuable target species for fisheries. Most of all striped mullet is harvested in the Turkish waters (Table 9.11) where it is the second important target species in the bottom trawling fisheries after whiting. In 1990 ����� 2000, around 75% of landings of striped mullet were caught by trawl along the eastern Black Sea coast of Turkey (Zengin, 2003). Its mean annual catch made up 2590 tons and as compared with the previous 7-year period it reduced 46% in 1996 ����� 2005 due mainly to decreased catches in the eastern part of the sea. Beginning from 1999, more than half of striped mullet landings have realized on the western Black Sea of Turkey where the proportion of trawl fisheries is much less (Fig. 9.17). To some extent it is the evidence of excessive pressure of trawl fisheries on striped mullet stocks near the Turkish coasts. The years 1989, 1993 and 1996 are identified as particularly abundant years with relatively high catches in the eastern part whereas higher catches in the western part follows with a 2 ����� 3 years phase lag (1991, 1996 and 1999).��
Table 9.11. Landings of mullets in the Black Sea according to the official statistics (tons).
| Year | Striped mullet | Mullets (Mugilidae) | ||||||||||
| BG | GEO | RO | RU | TR | UA | BG | GEO | RO | RU | TR | UA | |
| 1989 | 0 | 0 | 5 | 324 | 6753 | 0 | 3 | 5 | 8 | 12 | 2843 | 22 |
| 1990 | 0 | 0 | 7 | 132 | 3507 | 0 | 1 | 19 | 0 | 4 | 1749 | 6 |
| 1991 | 0 | 0 | 25 | 210 | 3610 | 0 | 7 | 0 | 0 | 2 | 4026 | 8 |
| 1992 | 1 | 0 | 0 | 37 | 2988 | 5 | 5 | 0 | 0 | 2 | 2358 | 0 |
| 1993 | 0 | 0 | 0 | 0 | 2877 | 12 | 6 | 0 | 0 | 70 | 4061 | 0 |
| 1994 | 0 | 0 | 5 | 25 | 2337 | 10 | 6 | 0 | 0 | 70 | 5112 | 0 |
| 1995 | 0 | 0 | 9 | 324 | 4348 | 13 | 24 | 0 | 1 | 65 | 7779 | 4 |
| 1996 | 0 | 0 | 1 | 76 | 5419 | 2 | 29 | 3 | 0 | 382 | 12901 | 12 |
| 1997 | 0 | 14 | 3 | 68 | 4040 | 17 | 30 | 0 | 0 | 480 | 8680 | 118 |
| 1998 | 0 | 11 | 3 | 119 | 2536 | 26 | 13 | 0 | 0 | 401 | 8198 | 82 |
| 1999 | 0 | 8 | 1 | 92 | 2989 | 26 | 16 | 9 | 0 | 35 | 9887 | 211 |
| 2000 | 0 | 3 | 2 | 127 | 2355 | 10 | 15 | 19 | 0 | 85 | 14189 | 178 |
| 2001 | 26 | 22 | 3 | 119 | 1498 | 19 | 57 | 28 | 1 | 7 | 6705 | 459 |
| 2002 | 33 | 67 | 2 | 47 | 1651 | 40 | 96 | 73 | 2 | 33 | 4048 | 187 |
| 2003 | 36 | 50 | 3 | 177 | 1073 | 26 | 34 | 80 | 1 | 312 | 3711 | 59 |
| 2004 | 17 | 35 | 40 | 99 | 1187 | 16 | 18 | 68 | 3 | 366 | 4191 | 51 |
| 2005 | 1 | 51 | 15 | 92 | 1649 | 15 | 10 | 74 | 2 | 92 | 3882 | 91 |
| Y89/95 | 0 | 0 | 7 | 150 | 3774 | 6 | 7 | 3 | 1 | 32 | 3990 | 6 |
| Y96/05 | 14 | 28 | 8 | 114 | 2590 | 22 | 38 | 38 | 1 | 220 | 8310 | 191 |
| Y00/05 | 19 | 38 | 11 | 110 | 1569 | 21 | 38 | 57 | 2 | 149 | 6121 | 171 |
In the waters of Bulgaria and Romania the striped mullet is not a valuable target species for fisheries. It is harvested as by-catch during trawl fisheries or together with other fishes during non-selective fisheries with trap nets. In 1996 ����� 2005 catches of striped mullet in the Bulgarian waters increased slightly. In the waters of Georgia according to the data of official statistics in 1989 ����� 1996 catches of striped mullet were absent or was categorized within the ���œother fish���� group. In 1997 ����� 2005, its mean annual catch was equal to 28 tons. According to Komakhidze et al. (2003), the striped mullet was captured recently in higher amounts that provided an indirect evidence of increasing abundance. Along the coasts of the Russian Federation target fisheries of striped mullet are performed mainly with passive fishing gears. The stocks exceeded over 100 tons by 1998, which was mainly related to the reduction of Mnemiopsis leidyi population (Volovik, Agapov, 2003). In 2002, the total biomass was estimated as 1200 tons, exploited biomass as 960 tons and TAC as 200 tons. In the Ukrainian waters, target fishing of the striped mullet was permitted only with beach seines and scrapers; however, the greater part of its catches corresponded to the non-target fishing with bottom traps (Shlyakhov and Charova, 2003). The major share of striped mullet was harvested in autumn in Balaklava Bay, near Sebastopol. The amount of non-registered catches of striped mullet was undefined. The annual determination of limits for striped mullet harvesting was made without TAC, but taking into account the monitoring of the whole status of the population (size and age composition of catches, proportion between the rest and recruitment, etc.). Its value was estimated as 50 ����� 60 tons for recent years.
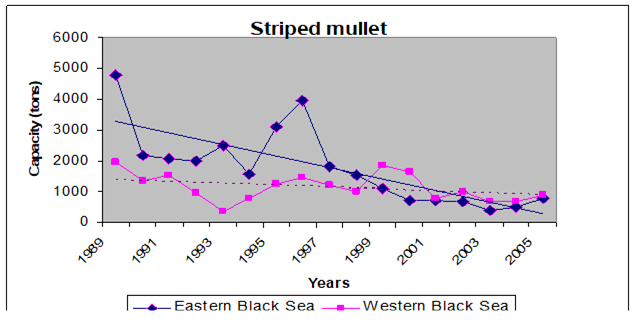
Fig. 9.17. Landings of striped mullet in the Black Sea waters of Turkey (according to data of the TDA Technical Task Team National Experts ����� Turkey, Duzgunes, 2006).
9.4.5. Mullets (Mugilidae)
Among 6 species of mullets from family Mugilidae inhabiting the Black Sea, three aboriginal species Liza aurata (Risso), Mugil cephalus L., Liza saliens (Risso) and one acclimatized species Mugil so-iuy Basilevsky (Liza haematocheilus (Temminch et Schlegel) are of commercial value. Mullets are distributed all over the coastal waters and in the estuaries adjacent to the sea. Their migration routes run along the whole coast and via the Kerch Strait (to the Sea of Azov and back). Wintering migrations of mullets are the most intensive in November. Wintering of warm-loving aboriginal mullets takes place in the narrow coastal band and bays at depths less than 25 m. The wintering grounds of so-iuy mullet are not studied well-enough but known to spend winter in the northwestern Black Sea in the vicinity of the Crimean coast, in the Dneprovsky estuary and in other estuaries connected to the sea (Donuzlav, Berezansky, etc.). Often it spends winter under the ice. Spawning migrations of aboriginal mullets from feeding grounds to the Black Sea take place in late August-September. Their stock is the most abundant in the northern Black Sea in the waters of the Russian Federation and Ukraine Crimean-Caucasus.
All coastal countries are engaged in mullet fisheries. Due to their geographical position and wide application of active fishing gears for mullets capture, Turkey has the largest landings (Table 9.11). So-iuy mullet fisheries along the coasts of Anatolia are mainly based on fishing off pre-spawning and spawning concentrations. Vessels with engine power from 5 to 380 Hp are engaged (Knudsen and Zengin, 2006). In other countries, the mullet fisheries are carried out with passive fishing gears with traps of different design.
The separate statistics for catch of mullets by species is not available although the Russian Federation and Ukraine compiled the separate statistic for So-iuy mullet. Lack of separate statistics for catches of mullets, availability of local stocks as well as their un-reporting catch obstructed producing the mullet biomass assessments for the whole Black Sea.
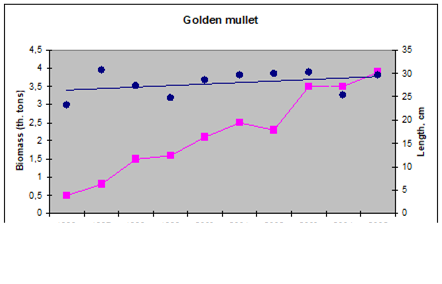
Fig. 9.18.�� Biomass and mean length changes of golden mullet in the Crimean waters of Ukraine during 1996-2005.
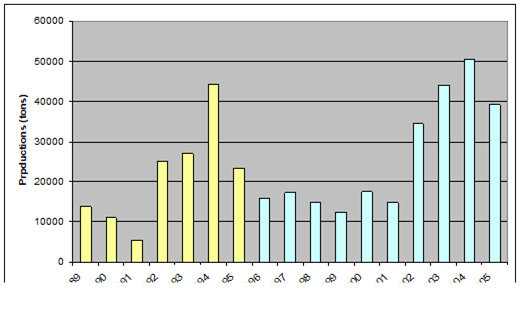
�� Fig. 9.19. Total catch of main mollusks in the Black Sea in 1989 ����� 2005.
The 1980s and early 1990s was a period of very low mullet stocks in the Crimean-Caucasus coasts and thus their fisheries were prohibited. Populations of mullets started to be restored only by the late-1990 (Fig. 9.18); however, their renewed fisheries became less intensive. Its stock increase was accompanied by an increase in its total length (Fig. 9.18) that is an additional evidence of improvement of stocks of this fish in the waters of Ukraine. Along the coasts of Caucasus in the waters of the Russian Federation, the state of So-iuy mullet stocks, golden mullet and flathead grey mullet stocks was rather favorable in 2002 to conduct target fisheries within TAC 150 tons (Volovik and Agapov, 2003).
9.5. Commercial mollusks
Among mollusks, the clams (Chamelea gallina, Tapes spp.), Mediterranean mussel (Mytilus galloprovincialis), and sea snail (Rapana thomassiana) have the greatest commercial value. The former two species are harvested only by Turkey and the latter species ����� by all the countries of the region except Romania. The capture of mollusks in 1996 ����� 2005 has the tendency to increase (Fig. 9.19).
9.5.1. Mediterranean mussel
Among the Black Sea mollusks, Mediterranean mussel (Mytilus galloprovincialis) is the one with highest commercial value. It is one of the most abundant macrozoobenthos species in the Black Sea. It forms the communities along all the coasts from the shoreline to the depth of 55 ����� 60 meters.
In 1989 ����� 2005 mussel fisheries was developed in Turkey and Ukraine, while its harvesting in the waters of Bulgaria and the Russian Federation was much less, and Georgia and Romania did not harvest this mollusk at all. Comparison of mussel harvesting in 1989 ����� 1995 and 1996 ����� 2005 demonstrated a major reduction in the waters of Turkey and Ukraine for the last10 years (Table 9.12).
According to the opinion of Turkish experts, Mediterranean mussel banks were seriously affected and production rates were decreased. Recently mussel harvesting in the eastern part has not been conducted. In the Ukrainian waters degradation of the mussel settlements occurred mainly due to the deterioration of the environmental conditions and anthropogenic impacts (Fashchuk et al., 1991). The most abundant settlements of this mollusk were concentrated in the northwestern part. Up to the mid-1970s, mussel biomass in the northwestern Black Sea varied between 8 and 12 million tons. In subsequent years, massive death of bottom organisms was registered almost every year due to the oxygen deficiency in near-bottom water layer. It results in rejuvenation of the mussel population as compared with the preceding period. In 1980s the total mussel stock on the Ukrainian northwestern shelf reduced to 4-6 million tons (Zaitsev, 1992). The juveniles made up the basic population at the age of fingerlings and yearlings, up to 35 ����� 40 mm long. In some years juvenile proportion became as high as 75% of the total population.
Up to 1992, on the banks located in the vicinity of the Black Sea Ukrainian coasts, mussel was harvested with drags more than 1000 tons per year. Almost all the mussels were small-sized and were designed for foraging purposes. At present, only ��Mezhvodnoye�� bank remained for mussel exploitation. Analysis of the mussel stock status on this bank for the period of observations indicated moderate fluctuations in the range of average amount of 60 thousand tons for mussels of 5 to 70 mm long and 20 thousand tons ����� for mollusks of more 50 mm long. Mussel harvesting on this bank is recommended annually for 2 thousand tons; however it never exceeded 0.5 thousand tons after 1992.
9.5.2. Sea snail (Rapana spp.)
This species of mollusk is considered to be R. thomasiana in most Black Sea countries, and the name R. venosa is used rarely for this species. It is thought that sea snail came to the Black Sea with ballast waters from its home places of the Indian-Pacific oceans (Sorokin, 1982). Near the Ukrainian coast sea snail becomes mature at the age of 2 ����� 3 old; it lives till 8 ����� 9 years and reproduces during the warm period (July ����� September). Pelagic larvae of sea snail feed on nanoplankton algae and their adults feed mainly on bivalves of families Cardiidae, Mytilidae, Veneridae, Arcidae and they travel over large distances for feeding. In some periods of a year it buries itself into the ground. Introduction of this predatory mollusk into the ecosystem of the Black Sea turned out to be a catastrophe for oyster biocenoses. Distribution of sea snail is associated with reduction in area and density of mussel settlements, in particular near the coasts of Anatolia and Caucasus. In the Ukrainian waters sea snail destroyed the oyster banks in the area of the Kerch Strait and in Karkinitsky Bay, biocenoses of other mollusks associated with depth down to 30 m suffered as well.
Turkey has been conducting large-scale harvesting of sea snail since the mid-1990s. The other Black Sea countries joined to its fisheries excluding Romania. The Turkish catch remained, however, much higher than other countries, followed by Bulgaria. Their catch increased noticeably during 2000s (Table 9.12). It also became commercially important resource in Bulgaria after 1994. Prior to beginning of its regular harvesting, the biomass on the coastal grounds between Kaliakra and Pomorie was about 2 thousand tons (Prodanov and Konsulova, 1993). Taking into account all the area and the buried part of mollusks, its total biomass was assessed as 7.5 thousand tons. Bottom trawling and dredging were officially forbidden, although these fishing gears were used for the sea snail fishery. According to the assessments of the Private Bourgas Fishery Association, sea snail landings almost 17 times higher than the official report 8557 tons in 2005 (TDA Technical Task Team National Experts ����� Bulgaria report, Raykov, 2006).
Table 9.12. Landings of Mediterranean mussel and sea snail in the Black Sea (tons).
| Year | Mediterranean mussel | Sea snail (Rapana spp.) | ||||||||||
| BG | GEO | RO | RU | TR | UA | BG | GEO | RO | RU | TR | UA | |
| 1989 | 0 | 0 | 0 | 26 | 2637 | 1128 | 0 | 0 | 0 | 4 | 10032 | 0 |
| 1990 | 0 | 0 | 0 | 9 | 2544 | 2189 | 0 | 0 | 0 | 156 | 6094 | 0 |
| 1991 | 0 | 0 | 0 | 88 | 26 | 399 | 0 | 0 | 0 | 11 | 3730 | 0 |
| 1992 | 0 | 0 | 0 | 0 | 5678 | 449 | 0 | 0 | 0 | 192 | 3439 | 14 |
| 1993 | 0 | 0 | 0 | 0 | 5914 | 210 | 0 | 0 | 0 | 29 | 3668 | 3 |
| 1994 | 0 | 0 | 0 | 0 | 6038 | 226 | 3000 | 0 | 0 | 2 | 2599 | 5 |
| 1995 | 0 | 0 | 0 | 0 | 5741 | 578 | 3120 | 700 | 0 | 54 | 1198 | 303 |
| 1996 | 5 | 0 | 0 | 0 | 1400 | 74 | 3260 | 711 | 0 | 1 | 2447 | 376 |
| 1997 | 57 | 0 | 0 | 0 | 2952 | 159 | 4900 | 118 | 0 | 440 | 2020 | 476 |
| 1998 | 92 | 0 | 0 | 0 | 2435 | 82 | 4300 | 0 | 0 | 46 | 3997 | 369 |
| 1999 | 100 | 0 | 0 | 4 | 1584 | 155 | 3800 | 0 | 0 | 45 | 3588 | 619 |
| 2000 | 0 | 0 | 0 | 0 | 178 | 111 | 3800 | 184 | 0 | 182 | 2140 | 913 |
| 2001 | 7 | 0 | 0 | 0 | 17 | 61 | 3353 | 517 | 0 | 224 | 2614 | 395 |
| 2002 | 55 | 0 | 0 | 0 | 2500 | 71 | 698 | 503 | 0 | 56 | 6241 | 91 |
| 2003 | 15 | 0 | 0 | 1 | 4050 | 68 | 325 | 295 | 0 | 62 | 5500 | 149 |
| 2004 | 34 | 0 | 0 | 9 | 2867 | 78 | 2428 | 65 | 0 | 62 | 14834 | 159 |
| 2005 | 10 | 0 | 0 | 3 | 2908 | 60 | 511 | 288 | 0 | 87 | 12153 | 161 |
| Y89/95 | 0 | 0 | 0 | 2 | 4083 | 740 | 874 | 100 | 0 | 64 | 4394 | 46 |
| Y96/05 | 38 | 0 | 0 | 2 | 2089 | 92 | 2738 | 268 | 0 | 121 | 5553 | 371 |
| Y00/05 | 20 | 0 | 0 | 2 | 2087 | 75 | 1853 | 268 | 0 | 112 | 7247 | 311 |
In Turkey, harvesting of sea snail is greatly increased for the recent two years. Analysis of fisheries along the eastern coast of Turkey (Samsun Province) showed that number of vessels using drags for sea snail harvesting in 2000 ����� 2005 increased by large rates, especially in the vessel group 33 ����� 149 Hp, typically boats that combine sea snail dredging, bottom trawling and net fıshing (Knudsen and Zengin, 2006). The small boat non-trawler engine power has increased at a much greater extent (468%), which are also used for sea snail harvesting. Although resources of this mollusk are still withstanding such high intensity of fisheries, large-scale implementation of drags has a destructive effect on bottom biocenosis and the ecosystem as a whole.
Until the early 1990s along the Ukrainian coast sea snail was harvested in an amateurish way for a fine shell used as souvenirs. The distribution and the stock assessment of sea snail in the Ukrainian territorial waters in the area from Takil Cape to Chauda Cape were undertaken in 1990, 1994 and 1999. Stocks of this mollusk were, respectively, assessed as 2.8 thousand tons, 1.5 thousand tons and 1.3 thousand tons. The former two assessments belonged to the initial commercial exploitation of this ground, the latter to the period of the intensive fisheries. Reduction in sea snail stocks from 1.5 ����� 2.8 thousand tons (virgin population) to 1.3 thousand tons (exploited population) is the evidence of drag fisheries impact. The use of knife-edge drags adversely affected the bottom biocenoses.
In 1994 sea snail stocks were assessed along the southern and western coasts of the Crimea from Cape Ilya to the Cape Evpatoriisky as 14 thousand tons, and the limit for its harvesting in the waters of Ukraine begin to be established as 3 thousand tons. Maximum sea snail harvest reached the amount of 913 tons in 2000. After 2000 small-sized sea snail of 50-60 mm long was predominant in the catches from this ground. The causes of present rejuvenation of sea snail population was most probably overfishing, accompanied by the intensive harvesting of individuals of older ages (more than 75 mm long). Therefore since 2002, the annual limit for sea snail harvesting in the Ukrainian waters was reduced to 400 tons. After this limit, snail harvests reduced greatly. By mid-2000s, an increase in abundance and individual size of this mollusk was noted along the coast of the Crimea.
9.5.3. Сlams
Striped venus (Chamelea gallina L., 1758) is a small-sized bivalve mollusk, inhabiting sandy ground at depths up to 35 m. It maturates at the second year of life. It reproduces during the warm period of the year (July ����� September); larvae are pelagic. Adult mollusk is a filtrator and seston-eater. Biocenoses of striped venus are characterized by abundant biomass. In northwestern Black Sea the largest abundance of clam is observed at 7 ����� 8 m depth on sands and sandy-shells up to 600 ����� 800 individuals/m2 and even higher in southern areas of the sea.
Among Black Sea countries Turkey is the only one to conduct regular striped venus harvesting. Dynamics of its harvesting is characterized by rapid growth for the first three years after beginning of harvesting and subsequent five-year period of decline (Fig. 9.20). In 1996 �����2005 increase in landings was observed; mean annual catches made up 9459 tons.
Due to its non-consumption within the country, it is exported to EU countries as frozen or canned food. According to Dalgı�� and Okumuş (2006), the hydraulic dredge boats operated in clams fishing was 39 in 2006, the majority of which were concentrated along the southwestern coast of the Black Sea. Fishing season begins with 1st of September and ends at 30th of April. Pressure on different sites of the coast is regulated by means of their opening or closure from season to season. Its sustainable production requires standardizing the sieves, freezing the fishing license of striped venus, putting quotas and sharing out the fishing grounds between the boats.
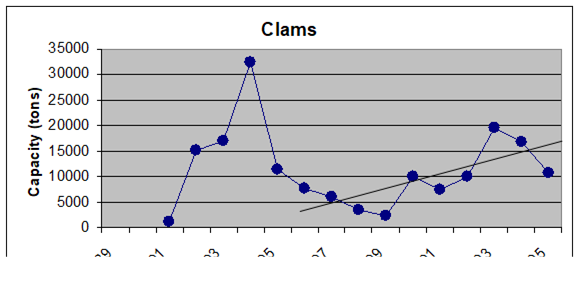 ��
��Fig. 9.20. Harvesting of striped venus in the Black Sea along the Turkish coasts.
9.6. Water plants
Water plants have commercial value only in the Ukrainian sector of the Black Sea. They are red algae, represented mainly by species Phyllophora�� nervoza, one species of brown algae (Cystoseira barbata), and eel-grass (Zostera marina). The share of water plants in the regional value of MLR capture was never high, and for the last 10 years after ceasing red algae capture it became insignificant. (Fig. 9.21).
In the Black Sea, Ukraine is the only country conducting harvesting red algae (Phyllophora nervosa, Ph. brodia) and sea grass (Zostera spp.). For the last 10 years, their harvesting had no regular character and no significant commercial value. Phyllophora harvesting ceased after 1996. The primary cause was economic problems that resulted in bankruptcy and suspension of plant for phyllophora processing and agar production (Odessa). The second cause was the rise in the cost of production due to the reduced productivity of phyllophora harvesting. In 1960s, the area of phyllophora field occupied about 12 thousand km2 with total biomass of 9 million tons (Kaminer, 1971). Since the early 1970s with the deterioration of environmental conditions in the northwestern Black Sea, the size of this unique biocenosis and stock began to reduce quickly. In the mid-1980s, the area of its settlements reduced to 4 thousand km2 and the total biomass to 0.3 million tons (Zaitsev, 1989). Reduction in phyllophora field likely took place as a combination of increased chemical pollution of the marine environment and eutrophication, reduced transparency including lifting of mud particles in the water column during bottom trawling, hypoxia and subsequent mass mortalities.
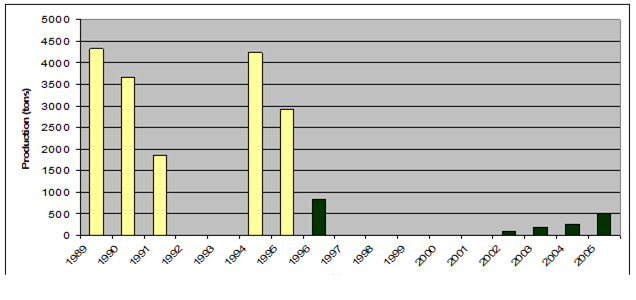
Fig. 9.21. Total capture production of main water plants in the Black Sea in 1989 -2005.
According to the data from the YugNIRO�����s survey in 2000, the area of the northwestern part of the sea was covered by 1.5 thousand square kilometers that was the densest commercial phyllophora aggregations observed during the last years. Its stock was assessed to be around 8 thousand tons which used to be 121 thousand tons in 1993.
9.7. Conclusions
Historically, the main factors leading to stock collapses and great losses in fisheries were eutrophication-induced changes in the food web, overfishing and the invasion of the comb-jelly M. leidyi. In the recent period 2000-2005, the major threat for the fish resources appear to be the illegal fishing and the use of destructive harvest techniques as well as the lack of regional cooperative management of fisheries and eutrophication. At present, no recovery of the spawning and nursery habitat for sturgeons took place in rivers and lagoons. The amounts of restocking of the Dnieper sturgeon populations reduced considerably and the state of sturgeon stocks after 1999 deteriorated definitely with collapse not being excluded. The state of Danube shad stocks did not improve; nevertheless the situation is less disastrous as compared to sturgeons. The sprat, anchovy, picked dogfish, and mullet stocks partially recovered in 1995 ����� 2005, but the current level of relatively high fishing efforts and catches impose a risk of deterioration of their stocks. On the other hand, the horse mackerel stock continues to be in a depressed state with low stock size and there is no sign of its recovery. The whiting and turbot stocks are exploited rather intensively and declining. In 2000 �����2005, mussel catch had a negative trend in the Ukrainian sector but as a whole the state of mussels improved in the Black Sea. The total state of water plant resources continues to be in deteriorated state.
The summary table describing the current status of MLRs with respect to the previous phases (Table 9.13) in general suggests an improvement in the state of MLR during 2000 ����� 2005 with respect to the collapse period (1989 ����� 1992) but the overall situation is still inferior when compared with the baseline state (1970 ����� 1988). The highly variable stock dynamics and the lack of effective control measures for the fisheries quite likely may lead to sharp stock declines in the future. In order to avoid this risk and to achieve sustainable development of fisheries in the Black Sea, implementation of a regional fisheries management strategy is necessary.
Table 9.13. Indicators for the fisheries in the Black Sea for 1970 ����� 2005 (Caddy�����s method) .
| Category/Species | Baseline (1970-1988) | ���œCollapse years����(1989-1992) | ���œPost-collapse���� years (1993-2005) | Present decade(2000 - 2005) | |||||
| Trend | Averagetons/year | Trend | Averagetons/year | Trend | Trend | Averagetons/year | Landings as % of baseline | Landings as % of ���œcollapse years���� | |
| Resident pelagic species | |||||||||
| Anchovy | + | 341060 | - | 131100 | 0 | - | 280757 | 82% | 214% |
| Horse mackerel | + | 52684 | - | 50048 | 0 | - | 13323 | 25% | 27% |
| Sprat | + | 40042 | - | 49412 | + | 0 | 60537 | 151% | 123% |
| Migrants | |||||||||
| Bluefish | + | 8250 | - | 6501 | + | + | 10120 | 123% | 156% |
| Bonito | 0 | 8303 | + | 9275 | + | + | 16137 | 194% | 174% |
| Demersal | |||||||||
| Turbot | - | 2807 | - | 1045 | - | - | 1250 | 45% | 120% |
| Whiting | + | 13737 | - | 20059 | - | - | 9091 | 66% | 45% |
| Spiny dogfish | + | 4633 | - | 3684 | - | - | 1132 | 24% | 31% |
| Барабули | - | 1119 | + | 1198 | - | - | 1770 | 158% | 148% |
| Mullets (Mugilidae) | 0 | 2401 | + | 2765 | - | - | 6538 | 272% | 236% |
| Rapana | N/A | N/A | - | 5918 | + | + | 9832 | 122%of 1993-2005 | 166% |
| Ratio (trends)��+ve/-ve | 6/3 | 3/8 | 4/5 | 3/7 | |||||
| =2.00 | =0.38 | =0,80 | =0.43 | ||||||
References
Acara A. (1985) The Black Sea turbot. State Planning Organization, Ankara, Turkey.
Ambroz A. M., Kirilluk M. M. (1979) Sturgeons (in Russian). In: ���œFisheries resources of the Black Sea����, Tkacheva K. S. and Yu. K. Benko (eds). USSR, Moscow: Pishchevaja Promyshlennost, 242-247 (in Russian).
Anon. (1997) Black Sea transboundary diagnostic analysis. UNDP, New York, 142pp.
Arkhipov A. G. (1993) Estimation of abundance and peculiarities of distribution of the commercial fishes in the early ontogeny. Journal of Ichthyology, USSR, 33 (4), 511-522 (in Russian).
Bingel F., G��g�� A. C., Stepnovski A., Niermann U., Mutlu E., Avşar D., Kideyş A. E., Uysal Z., İşmen A., Gen�� Y., Okur H., Zengin M. (1996) Stock assessment study for Turkish Black Sea cost. METU IMS Erdemli and FRI Trabzon, T�œBİTAK, Final Report, 159pp.
Bryantsev V. A., Serobaba I. I., Shlyakhov V. A., Yakovlev V. N. (1994) Biological resources of the Black Sea in the present ecological conditions,�� Proceeding of the Black Sea Symposium Ecological Problems and Economical Prospects (Ed. K. C. Guven). Istanbul, Acar Matbaacilik A.S, 293-296.
Caddy J.F. (2006) The potential use of indicators, reference points and the traffic lights convention for managing Black Sea fisheries. In: Selected papers presented at the Workshop on biological reference points , 20-21 April 2004. G. Lembo (Ed.). Studies and Reviews. GFCM. 83, 1-24.
Chashchin A. K. (1998) The anchovy and other pelagic fish stock transformations in the Azov-Black Sea basin under environmental and fisheries impact. The proceedings of the First International Symposium on Fisheries and Ecology, 1-10.
Dalgı�� G., Okumuş İ. (2006) Clam fisheries with hydraulic dredges in the Black Sea. 1st Bilateral Scientific Conference ���œBlack Sea Ecosystem 2005 and Beyond���� 8-10 May 2006, Istanbul, Turkey.
Daskalov G. (1998) P��cheries et changement environmental �� long-term en mer Noire. PhD thesis. Centre d�����oc��anologie de Marseille, Univ. Aix-Marseille II (in French).
Daskalov G. (1999) Relating fish recruitment to stock biomass and physical environment in the Black Sea using generalised additive models. Fish Res., 41, 1-23.
Daskalov G. M. (2002) Overfishing drives a trophic cascade in the Black Sea. Mar Ecol Prog Ser., 225, 53-63.
Daskalov G. M. (2003) Long-term changes in fish abundance and environmental indices in the Black Sea. Mar. Ecol. Prog. Ser., 255, 259-270.
Daskalov, G. and Prodanov, K. (1994) Variability in growth of sprat Sprattus sprattus L. off Bulgarian Black Sea coast with reference to the environmental changes in the sea.. In: Proceedings of the International Conference with a Workshop on regional cooperation project for integrated research and -monitoring of the Black Sea (Black Sea'94), 12 - 17 Sep. 1994, Varna, 81-85.
Daskalov G., Prodanov K. Shlyakhov A. and K. Maxim (1996) Stock assessment of sprat Sprattus sprattus L. in the Black Sea during 1945-1993 using international fishery and research data. Izv.IRR, Varna, 24, 67-93.
Daskalov, G. M., Prodanov, K. and Zengin, M. (2007) The Black Seas fisheries and ecosystem change: discriminating between natural variability and human-related effects. In: Proceedings of the Fourth World Fisheries Congress: Reconciling Fisheries with Conservation (ed�� J. Nielsen, J. Dodson, K. Friedland, T. Hamon, N. Hughes, J. Musick and E. Verspoor). American Fisheries Society Symposium 49, 587�����602.
Duzgunes E. (2006) TDA TTT National Report Turkey. UNDP/GEF Black Sea Ecosystem Recovery Project Phase II, 29 pp.
FAO Fisheries Department, Fishery Information, Data and Statistics Unit. FISHSTAT Plus: Universal software for fishery statistics time series. Version 2.3. 2000 ����� 2005. FAO, 2007.
Fashchuk D.Ya., Samyshev E.Z., Sebakh L.K., Shlyakhov V.A. (1991) Forms of anthropogenic impact on the Black Sea ecosystem and its state under modern conditions. J. Ecology of the sea, 38, Ukraine, Kiev: Naukova dumka, 19-28 (in Russian).
Gen�� Y., Mutlu C., Zengın M., Aynın İ., Zengın B., Tabak İ. (2002) Doğu Karadeniz�����deki Av G��c��n��n Demersal Balık Stokları �œzerine Ektisinim Tesbiti. Tarım K��yişleri Bakanlıgi, TAGEM, Trabzon Su �œr��leri Mekez Araştırma Enstit��s��, Sonu�� Raporu Proje No: TAGEM/IY/97/17/03/006, ss:114 (in Turkish).
Grishin A. N. (1994) Dietary daily regime and food spectrum of ctenophore M. leidyi in the conditions of the Black Sea. In: Proceedings of the Southern Scientific Research Institute of Marine Fisheries &. Oceanography, 40, 45-47 (in Russian).
Grishin A., Daskalov G., Shlyakhov V., Mihneva V. (2007) Influence of gelatinous zooplankton on fish stocs in the Black Sea: analysis of biological time-series. Marine Ecological Journal, 6(2), Sevastopol, 5-24.
Gucu, A. C. (1997) Role of fishing in the Black Sea ecosystem. Pages 149-162 in E., ���zsoy, and A., Mikaelyan, editors. Sensitivity to change: Black Sea, Baltic Sea and North sea. NATO ASI Series, 2. Environment, vol. 27. Kluwer Academic Publishers, Dordrecht, Netherlands.
Ivanov L. and Beverton R.J.H. (1985) The fisheries resources of the Mediterranean. Part two: Black Sea. FAO studies and reviews, 60, 135.
İşmen A. (2003) The whiting (Merlangius merlangus euxinus L.) in the Turkish Black Sea coast. In: Workshop on Demersal Resources in the Black & Azov Sea, B. ���ztűk and S. Karakulak (Eds.). Published by Turkish Marine Research Foundation, Istanbul, Turkey, 27-34.
Kaminer K. M. (1971) Distribution and stocks of Phyllophora in the northwestern Black Sea according to the data of survey in 1969. In: Prospects of development of fisheries in the Black Sea. USSR, Odessa, 108-109 (in Russian).
Kirnosova I. P. (1990) Growth parameters and mortality of spiny dogfish from the Black Sea. In: Biological resources of the Black Sea. Collected papers. USSR, Moscow: VNIRO, 113-123 (in Russian).
Kirnosova I. P., Lushnicova V. P. (1990) Feeding and food requirements of spiny dogfish (Squalus acanthias L.). ����� Biological resources of the Black Sea. Collected papers. USSR, Moscow: VNIRO, 45-57 (in Russian).
Knowler D. (2005) Reassessing the costs of biological invasion: Mnemiopsis leidyi in the Black sea. Ecological Economics, 52, 187����� 199.
Komakhidze A., Diasamidze R., Guchmanidze A. (2003) State of the Georgian Black Sea demersal ichthioresources and strategy for their rehabilitation and management. In: Workshop on Demersal Resources in the Black & Azov Sea, B. ���ztűk and S. Karakulak (Eds.). Published by Turkish Marine Research Foundation, Istanbul, Turkey, 93 ����� 103.
Knudsen S. and Zengin M. (2006) Multidisciplinary modeling of Black Sea fisheries: a case study of trawl and sea snail fisheries in Samsun. 1 st Bilateral Scientific Conference ���œBlack Sea Ecosystem 2005 and Beyond���� 8-10 May 2006, Istanbul, Turkey.
Lipskaya N. Ya., Luchinskaya T.N. (1990) Biology of ctenophore M. leidyi. Journal Rybnoye Khozyaystvo, 9, 36-38 (in Russian).
Maklakova I.P., Taranenko N.F. (1974) Some information on biology and distribution of picked dogfish and Raja rays in the Black Sea and recommendations for their fisheries. USSR, Moscow: VNIRO Proceedings, 104, 27-37 (in Russian).
Maximov V., Nicolaev S., Staicu I., Radu G.,Anton E., Radu E. (2006)�� Contributions a la connaissance des caraceristiques certaines especes de poisons demersaux de la zone marine roumane de la mer Noire. Cercetari marine I.N.C.D.M. 36, 271-297 (in French).
Mikhajlyuk, A.N. (1985) Factors determining the abundance of young Black sea scad. In: Oceanographic and fisheries investigations of the Black Sea, Coll. reprints of VNIRO, Moskow, 81-86 (In Russian).
Mikhailov, K. and Prodanov, K. (2002) Early sex maturation of the anchovy Engraulis encrasicolus (L.) in the northwestern part of the Black Sea. Page 34 in National Centre for Marine Research, Athens (Greece), 3rd EuroGOOS Conference: Building the European capacity in operational oceanography.
Navodaru I., Staraş M., Banks R. (1999) Management of sturgeon stocks of the lower Danube River system. In: ���œThe Delta�����s: State-of-the-art protection and management����, Romulus Stiuca and Iulian Nuchersu (eds). Conference Proceedings, Tulcea, Romania, 26-31 July 1999, 229-237.
Nicolaev S., Maximov V., Anton E. (2003) Actual state of Romanian marine demersal fisheries In: Workshop on Demersal Resources in the Black & Azov Sea, B. ���ztűk and S. Karakulak (Eds.). Published by Turkish Marine Research Foundation, Istanbul, Turkey , 104 ����� 114.
���zdamar E., Samsun O., Kihara K. and Sakuramoto K. (1996) Stock assessment of whiting, MERLANGIUS MERLANGUS EUXINUS along the Turkish coast of the Black sea. Journal of Tokyo University of Fisheries, v. 82 (2), 135-149.
Panayotova M., Todorova, V., Konsulova, Ts., Raykov, V., Yankova, M., Petrova,�� E., Stoykov, S. (2006) Species composition, distribution and stocks of demersal fishes along the Bulgarian Black Sea coast in 2006. Technical report.
Panov, B. N. and Spiridonova, E. O. (1998) Hydrometeorological prerequisites for formation of fishable concentrations and migration of the Black Sea anchovy in the south-eastern part of the Black Sea. Oceanology, Moskow, 38, 573-584 (in Russian).
Pirogovskiĭ M. I., Sokolov L. I. & Vasil�����ev V. P. (1989) Huso huso (Linnaeus, 1758). ����� In: The Freshwater Fishes of Europe Vol. 1, Part II General Introduction to Fishes/Acipenseriformes, Holčic (Ed.). AULA-Verlag, Weisbaden, 469pp.
Popova V. P. (1967) Methods of evaluation of the state of the turbot stocks in the Black Sea. ����� USSR, Moscow: Proc. VNIRO, 62, 197 ����� 204 (in Russian).
Popova A. A., Shubina T. N. & Vasil�����ev V. P. (1989) Acipenser stellatus Palllas, 1771. ����� In: The Freshwater Fishes of Europe Vol. 1, Part II General Introduction to Fishes/Acipenseriformes, Holčic (Ed.). AULA-Verlag, Weisbaden, 469pp.
Prodanov K, Bradova, N. (2003) Stock Assessment of the Whiting (Merlangius merlangus) in the Western Part of the Black Sea During 1971-1997. Proc. Institute of Oceanology, 4, 149-156.
Prodanov K., Mikhailov, K. (2003) Possibilities for Applying the Jones Methods for Turbot Stocs Assessment and Catch Projection in the Black Sea. In: Workshop on Demersal Resources in the Black & Azov Sea, B. ���ztűk and S. Karakulak (Eds.). Published by Turkish Marine Research Foundation, Istanbul, Turkey, 35 ����� 48.
Prodanov K., Mikhailov K., Daskalov G. M., Maxim K., Chashchin A., Arkhipov A., Shlyakhov V.,�� Ozdamar E. (1997) Environmental management of fish resources in the Black Sea and their rational exploitation. Studies and Reviews. GFCM. 68, FAO, Rome,�� 178pp.
Prodanov K. and Konsulova, (1993) Stock assessment of Sea snail. Rapana thomasiana in front the Bulgarian Black seacoast. IO-BAS Proceedings (in Bulgarian).
Radu G. (2006) The state of main habitats important for Black Sea marine living resources. Romanian second Fishery Report. UNDP/GEF Black Sea Ecosystem Recovery Project Phase II, 29 pp.
Radu G., Nicolaev S., Radu E., Anton E. (2006) Evolution of main indicators of marine living resources from the Romanian Black Sea sector in 2004 and 2005. 1 st Bilateral Scientific Conference ���œBlack Sea Ecosystem 2005 and Beyond���� 8-10 May 2006, Istanbul, Turkey.
Raykov V. (2006) TDA TTT National Fishery Report (first) Bulgaria. UNDP/GEF Black Sea Ecosystem Recovery Project Phase II, 4 pp.
Raykov V. , Schlyakhov Vl , Maximov ,V. , Radu, Gh. , Staicu, I. , Panayotova, M , Yankova, M , Bikarska I. 2008. Limit and target reference points for rational exploitation of the turbot (Psetta maxima L.) and whiting (Merlangius merlangus euxinus Nordm.) in the western part of the Black Sea.Acta Zoologica Bulgarica, Suppl.2, 305-316.
Reinartz R. (2002) Sturgeons in the Danube River, Biology, Status, Conservations. (Literature study). International Association for Danube Research (IAD). Bezirk Oberpfalz, Landesfischereiverband Baern. 150 pp.
Revina N. I. (1964) Biological research of the Black Sea and its fishing resources. On provision of anchovy and horse mackerel larvae with feed in the Black Sea. Proceedings of AzCherNIRO, Kerch, 23, 105-114 (in Russian).
Serobaba I.I., Domashenko G.P., Yuriev G.S., Malyshev I.I., Gapishko A.I., Shlykhov V.A., Kirillyuk M.M., Kaminer K.M., Domashenko Yu.G., Vinarik T.V., Timoshek N.G., Kirnosova I.P., Mikhailyuk A.N., Korkosh N.I., Akselev O.I., Chashchin A.K., Zhigunenko A.V., Litvinenko N.M. (1988) Commerical Fishery Description of the Black Sea (section: "Characteristics of the commercial species", "Description of fishing grounds"). AzcherNIRO, Publishing House of the Chief Department of Navigation and Oceanography of the Ministry of Defense for the Ministry of Fisheries of the USSR, 48-96 (in Russian).
Shlyakhov V. A. (1983) Biology, distribution and fishery of whiting (Odontogadus merlangus euxinus (Nordmann) in the Black Sea. USSR, Moscow, Proceedings of VNIRO "Biological resources and prospects of fishery of new species ����� fishes and invertebrates", 104-125 (in Russian).
Shlyakhov V. A. (1994) Estimation of Dnieper sturgeon population abundance in the North-Western Black Sea�� In: The main results of YugNIRO complex researches in the Azov-Black Sea Basin and the World Ocean in 1993. Ukraine, Kerch: YugNIRO, 40, 50-55 (in Russian).
Shlyakhov, V. (2003) Management of Fisheries and Other Living Marine Resources, National Report and Data Sheets in Ukraine. Workshop on Responsible Fisheries in the Black Sea and the Azov Sea, and Case of Demersal Fish Resources, April 15-17 2003, Şile, İstanbul, BSEP Programme, Country Report, T�œDAV/BSEP/ UNDP/GEF. 11 pp.
Shlyakhov V. A., Akselev O. I. (1993) Stock�����s state and reproduction efficiency of Russian sturgeon in the Black Sea Norht-Western part. Ukraine, Kerch, Proc. YugNIRO, 39, 78 ����� 84 (in Russian).
Shlyakhov, V., Charova, I. (2003) The Status of the Demersal Fish Population along the Black Sea Cost of�� Ukraine. In: Workshop on Demersal Resources in the Black & Azov Sea, B. ���ztűk and S. Karakulak (Eds.). Published by Turkish Marine Research Foundation, Istanbul, Turkey, 65 ����� 74.
Shlyakhov, V., Charova, I. (2006) Scientific data on the state of the fisheries resources of Ukraine in the Black Sea in 1992 ����� 2005. 1 st Bilateral Scientific Conference ���œBlack Sea Ecosystem 2005 and Beyond���� 8-10 May 2006, Istanbul, Turkey, 131-134.
Shlyakhov V.A., Chashchin A.K., Korkosh N.I. (1990) Intensity of fisheries and dynamics of the Black Sea anchovy stocks. In: Biological resources of the Black Sea, USSR, Moscow: VNIRO, 93-102 (in Russian).
Shlyakhov V.A., Goubanov E.P., Demyanenko K.V. (2005) On state of stocks and unreported catches of Azov sturgeons. In: Materials of the scientific practical Conference ��Problems and solutions of the modern fisheries in the Azov Sea basin��, Izergin L.V. (Ed.), Ukraine, Mariupol: Publishing House ��Renata��, 59 ����� 61 (in Russian).
Shul'man, GE; Chashchin, AK; Minyuk, GS; Shchepkin, VYa; Nikol'skij, VN; Dobrovolov, IS; Dobrovolova, SG; Zhigunenko, A.S. (1994) Long-term monitoring of the Black Sea sprat condition. DOKL. RAN, Moscow, 335(1), 124-126.
Shushkina E. A., Musaeva E. I. (1990) Structure of the plankton communities in the epipelagic zone of the Black Sea. Oceanology, 30(2), 306-310 (in Russian).
Simonov AI, Ryabinin AI, Gershanovitch DE (eds 1992). Project ���œThe USSR seas����. Hydrometheorology and hydrochemistry of the USSR seas. Vol. 4: Black Sea, no. 1: Hydrometheorological conditions and oceanological bases of the biological productivity. Hydrometheoizdat, Sankt Peterbourg (in Russian).
Sorokin Yu.I. (1982) The Black Sea: Nature, resources. USSR, Moscow: Nauka, 216pp (in Russian).
Svetovidov A. N. (1964) The Black Sea fish. Moscow-Leningrad: USSR, Moscow:Nauka,�� 546 pp (in Russian).
Tkatcheva KS, Benko YuK (eds) (1979). Resources and raw materials in the Black Sea, AzTcherNIRO, USSR, Moscow: Pishtchevaya promishlenist, 323 pp (in Russian).
Toje H. and Knudsen S. (2006)�� Post-Soviet transformations in Russian and Ukrainian Black Sea fisheries: socio-economic dynamics and property relations. 1 st Bilateral Scientific Conference ���œBlack Sea Ecosystem 2005 and Beyond����, 8-10 May 2006, Istanbul, Turkey.
Tonay A. M., ���zt��rk B. (2003) Cetacean Bycatch ����� Turbut fisheries interaction in the western Black Sea. In: Workshop on Demersal Resources in the Black & Azov Sea, B. ���ztűk and S. Karakulak (Eds.). Published by Turkish Marine Research Foundation, Istanbul, Turkey, 1-8.
Tsikhon-Lukonina E.A., Reznichenko O.G., Lukasheva T.A. (1991) Quantitative regularities in the diet of the Black Sea ctenophore M. leidiy. Oceanology, 31(2), 272-276 (in Russian).
��Vlasenko A. D., Pavlov A. V. & Vasil�����ev V. P. (1989) Acipenser gueldenstaeti Brant, 1833. ����� In: The Freshwater Fishes of Europe Vol. 1, Part II General Introduction to Fishes/Acipenseriformes, Holčic (Ed.). AULA-Verlag Weisbaden, 469pp.
Vinogradov M. E., Shushkina E. A., Nikolaeva G. G. (1993) State of zoocenoses in the open areas of the Black Sea in late summer 1992. Oceanology, 33(3), 382-387 (in Russian).
Volovik S. P., Agapov S. A. (2003) Composition, state and stocks of the demersal fish community of the Azov-Black Seas relating to the development of Russian sustainable fisheries. In: Workshop on Demersal Resources in the Black & Azov Sea, B. ���ztűk and S. Karakulak (Eds.). Published by Turkish Marine Research Foundation, Istanbul, Turkey, 82-92.
Zaitsev Yu. P. (1989) ����� The state and tendency of development of the Black Sea ecosystem. In: Southern Seas of the USSR: Geographical problems of research and exploration. Leningrad: Geographical Society of the USSR, 59-71.
Zaitsev Yu. P. (1992) The ecological state of the shelf zone of the Black Sea near Ukrainian costs. Journal of Hydrobiology, 28 (4), 3-18 (in Russian).
Zengin M. (2000) T��rkiye�����nin Doğu Karadeniz Kıyılarındaki Kalkan (Scopthalmus maeoticus) Balığının Biyoekolojik�� ���zelikleri ve Populasyon Parametleri, Doktora Tezi, KT�œ Fen Bilimleri Estit��s��, Balık��ılık Teknolojisi M��hendisliği Anabilim Dalı, 225pp (in Turkish).
Zengin, M. (2003) The Current Status of Turkey's Black Sea Fisheries and Suggestions on the Use of Those Fisheries, Workshop on Responsible Fisheries in the Black Sea and the Azov Sea, and Case of Demersal Fish Resources, April 15-17 2003, Şile, Istanbul, BSEP Black Sea Environmental Programme Country Report, 34pp.
Zolotarev P. N., Shlyakhov V. A., Akselev O. I (1996) The food supply and feeding of Russian sturgeon Acipenser gueldenstaedti and the starred stuggeon A. stellatus on the Nordwestern part of the Black Sea under modern ecological conditions. Journal of Ichthyology, 36(4), 317�����322 (in Russian).
CHAPTER 10 THE STATE OF CETACEAN POPULATIONS (A. Birkun)
Brema Laboratory, Simferopol, Ukraine
10.1. Introduction
There are only few taxonomic groups of marine mammals in the Black Sea fauna that include three cetacean (odontocete) species/subspecies ����� the harbour porpoise (Phocoena phocoena relicta), the short-beaked common dolphin (Delphinus delphis ponticus) and the common bottlenose dolphin (Tursiops truncatus ponticus) ����� and one pinniped species, the Mediterranean monk seal (Monachus monachus). The quality of the Black Sea ecosystem is dependent, in particular, on the survival and welfare of these top predator populations. It is difficult to foresee all negative consequences for the regional biodiversity, if cetaceans disappear as it has almost happened with the monk seal (���zt��rk, 1992, 1996; Kıra�� and Savaş, 1996; G����l��soy et al., 2004).
The present state of Black Sea cetacean populations is not quite clear or encouraging in spite of certain research and conservation progress achieved during last decade, since the two essential instruments have been adopted in 1996 ����� the Agreement on the Conservation of Cetaceans of the Black Sea, Mediterranean Sea and Contiguous Atlantic Area (ACCOBAMS), and the Strategic Action Plan for the Rehabilitation and Protection of the Black Sea (BS SAP). The insufficiency of scientific information includes population abundance, distribution, migrations, critical habitats, anthropogenic and natural threats as well as some basic aspects of life history and pathology.
In the past, the most important factor for the depletion of cetacean populations was commercial dolphin fishery. Mass legal killing (= devastating overexploitation) of Black Sea dolphins and porpoises peaked in the 1930s and 1950s; it was banned in 1966 in the USSR, Bulgaria and Romania, and in 1983 in Turkey. Currently, the most obvious threats affecting Black Sea cetacean populations are accidental mortality in fishing gear; habitat degradation causing the reduction of prey resources; water pollution and epizootics resulting in cetacean mass mortality events. All these factors are directly or indirectly dependent on enhanced (and poorly managed) human activities in the sea and in the entire Black Sea Basin.
The present chapter describes the state of Cetacean populations and emphasizes the need for multidisciplinary research that, with adequate financial and technical support, provides a reliable basis for developing and implementing efficient conservation and management strategies. Cetaceans do not know state borders as they are migratory species, so regional efforts are necessary and all the Black Sea countries need to be in co-operation.
10.2. Harbour porpoise (Phocoena phocoena relicta Abel, 1905)
10.2.1. Taxonomy and genetics
The Black Sea harbour porpoise is the sole representative of the family Phocoenidae and genus Phocoena in the Black Sea fauna (Table 10.1). It is recognized as a subspecies possessing morphological and genetic () differences from other P. phocoena subspecies and populations elsewhere in the world (e.g., Tzalkin, 1938; Rosel et al., 1995, 2003; Fontaine et al., 2005), except the Aegean Sea in the northeastern Mediterranean (Rosel et al., 1995). Black Sea and Aegean harbour porpoises have identical mtDNA sequence in the hypervariable control region (Rosel et al., 2003) and may constitute separate subpopulations of this subspecies (P. p. relicta). At the same time, no fine population structure was indicated so far within the Black Sea proper despite the fact that genetic polymorphism at 11 microsatellite loci was examined in 61 individuals sampled in the western (Bulgaria), eastern (Georgia) and northern (Ukraine) areas of the basin. According to Fontaine et al. (2005), the Black Sea population displays a lower genetic diversity compared to those of Atlantic.
Table 10.1. Taxonomic status of Black Sea marine mammals
| Taxonomic categories | English common names of Black Sea marine mammals | |||
| Harbour porpoise | Short-beaked common dolphin | Common bottlenose dolphin | Mediterranean monk seal | |
| Class | mammalia | |||
| Order | Cetacea | Carnivora | ||
| Sub-order | Odontoceti | Pinnipedia | ||
| Family | Phocoenidae | Delphinidae | Phocidae | |
| Genus | Phocoena | Delphinus | Tursiops | Monachus |
| Species | P. phocoena | D. delphis | T. truncatus | M. monachus |
| Subspecies | P. p. relicta | D. d. ponticus (?) | T. t. ponticus | ����� |
10.2.2. Distribution
Geographic range of the Black Sea harbour porpoise includes the Black Sea proper, Azov Sea, Kerch Strait (e.g., Tzalkin, 1938), Marmara Sea, Bosporus Strait (���zt��rk and ���zt��rk, 1997), northern Aegean Sea (Frantzis et al., 2001; Rosel et al., 2003) and also, very likely, the Dardanelles Straits connecting the Marmara Sea and Aegean Sea (however, no solid information is available until now from the Dardanelles) (Table 10.2). The Black Sea population is completely isolated from the nearest conspecific population in the northeastern Atlantic by wide range hiatus in the Mediterranean Sea (Frantzis et al., 2001).
One hypothesis is that harbour porpoises entered the Black Sea basin in the Pleistocene, after the Mindel glaciation (about 400�����500 thousand years ago), when the Black and Mediterranean Seas were connected for the first time (Kleinenberg, 1956). Another hypothesis is that they entered the Black Sea much later, in the Holocene, approximately 7,000 years ago, when the last (present) connection between the two seas was established (Frantzis et al., 2001). Either way, the species came to the Black Sea via the Mediterranean which, therefore, must have had its own harbour porpoise population in remote times (although now extinct).
Table 10.2. Geographic range of Black Sea cetaceans
| Water body���������� (sea or strait) | Country | Cetacean species (subspecies) | ||
| P. p. relicta | D. d. ponticus | T. t. ponticus | ||
| Black Sea | Bulgaria | + | + | + |
| Georgia | + | + | + | |
| Romania | + | + | + | |
| Russia | + | + | + | |
| Turkey | + | + | + | |
| Ukraine | + | + | + | |
| Kerch Strait | Russia | + | +?1 | + |
| Ukraine | + | ��1 | + | |
| Azov Sea | Russia | + | ����� | �� |
| Ukraine | + | ����� | �� | |
| Bosporus | Turkey | + | + | + |
| Marmara Sea | Turkey | + | + | + |
| Dardanelles | Turkey | +?2 | Nd | +?3 |
| Aegean Sea (NE Mediterranean) | Greece | ��2 | Nd | +?3 |
| Turkey | +?2 | Nd | +?3 | |
| Other parts of the Mediterranean Sea | ����� | Nd | ��3 | |
���œ+�������� ����� regular occurrence (numerous reiterated records);
���œ���������� ����� rare or casual occurrence (several records are known);��������
���œ������������� ����� no records available in spite of considerable observation effort undertaken over a long period of time;
���œ+?���� ����� suspected occurrence (solid scientific data are required to prove this assumption based on indirect evidence);
���œNd���� ����� no data (there are no any direct or indirect research data suggesting penetration of Black Sea common dolphins into the Mediterranean through the Dardanelles, although, in theory, such probability exists);
1 - a live stranding of D. d. ponticus was recorded in Kerch city, Ukraine, in August 1994 (Birkun et al., 1999); similar cases could happen in the Russian Kerch Strait also, but no respective study was conducted there;����
2 - according to the genetics (Rosel et al., 1995, 2003), P. p. relicta occurs in the Greek Aegean Sea, i.e. beyond the Dardanelles Straits and the northern part of the Turkish Aegean Sea; however, its presence in these ���œintermediate���� waters was not confirmed yet by reliable observations;
3 - bottlenose dolphins (T. truncatus) were recorded in the Dardanelles (���zt��rk and ���zt��rk, 1997), they are also known in the Greek and Turkish Aegean Sea (Beaubrun, 1995; Frantzis et al., 2003). However, the genetics of bottlenose dolphins from these localities were not studied yet and, thus, the suspected presence of T. t. ponticus individuals among them is not confirmed. At the same time, one individual from the western Mediterranean was found to be a possible immigrant from the Black Sea population (Natoli et al., 2005).
The range of the Black Sea subspecies covers territorial waters and exclusive economic zones of Bulgaria, Georgia, Romania, Russia, Turkey and Ukraine in the Black Sea; internal waters of Ukraine in the Black Sea (including the Dnieper-and-Boug Liman and Karkinitsky Bay); internal waters of Russia and Ukraine in the Azov Sea and Kerch Strait; internal waters of Turkey including the Bosporus Strait, the Marmara Sea and, probably, the Dardanelles Straits; territorial waters of Greece and, as expected, Turkey in the northern Aegean Sea. Sometimes, harbour porpoises can be sighted in the Danube, Dnieper, Don and Kuban Rivers, their estuaries, deltas and tributaries (e.g., in the Danube in 1984-1989 and 2003 or in the Ingulets, a confluent of the Dnieper, in 1999) as well as in coastal freshwater, brackish and saline lakes and lagoons connected with the sea, including the Yalpug and Sivash lakes, Berezansky and Grigorievsky lagoons, Tendrovsky, Yagorlytsky and Jarylgachsky bays, and the Gulf of Taganrog (Tzalkin, 1940a; Geptner et al., 1976; Birkun, 2006a). All these sites are situated in Ukraine and Russia, on the northern and northwestern coasts of the Black Sea and round the Azov Sea.
It might be assumed that the population of P. p. relicta consists of three or more subpopulations (which are not confirmed by means of genetic study yet) including those which spend the most part of year in geographically and ecologically different areas including the Azov Sea, northwestern Black Sea, and the Turkish Straits System (including the Sea of Marmara, the Bosporus and, possibly, the Dardanelles). Another subpopulation is thought to be resident in the northern Aegean Sea of the Mediterranean.
10.2.3. Abundance
The total population size is unknown. Past Black Sea region-wide estimates of harbour porpoise absolute abundance, based on strip transect cetacean surveys carried out in the USSR in 1967-1974 (Zemsky and Yablokov, 1974) and in Turkey in 1987 (���elikkale et al., 1989) have been discredited by the Scientific Committee of the International Whaling Commission (IWC) due to irremediable methodological and interpretative problems (Smith, 1982; IWC, 1983, 1992; Klinowska, 1991; Buckland et al., 1992). Some other estimates, conducted in 1975-1993 (Mikhalev et al., 1978; Yukhov et al., 1986; Sokolov et al., 1990; Mikhalev, 1996; Yaskin and Yukhov, 1997), also suffered from inadequacies of survey design, record keeping and statistical analysis. Nevertheless, it was generally recognized that during most of the 20th century the abundance of harbour porpoises in the Black Sea was higher than that of bottlenose dolphins and less than that of common dolphins; besides, before the mid 1990s the harbour porpoise was considered the predominant cetacean in coastal waters of the northern and eastern Black Sea (Tzalkin, 1940a; Kleinenberg, 1956; Geptner et al., 1976; Yaskin and Yukhov, 1997).
More recently, however, the bottlenose dolphin has become prevalent in inshore waters of the northern Black Sea (Birkun et al., 2004c). It was estimated that sighting score of bottlenose dolphins increased five times in 1997 and 1998 in comparison with 1995 (see Section 10.4.3 for details), whereas the number of harbour porpoises on record declined dramatically. Mass incidental mortality in bottom-set gill nets was the most likely cause of the marked decrease in harbour porpoise abundance (Birkun et al., 2004b,c; Birkun, 2005).
A series of line transect cetacean surveys have been conducted recently to estimate harbour porpoise absolute abundance in different regions (Birkun et al., 2002, 2003, 2004a, 2006b; Krivokhizhin et al., 2006). In particular, aerial surveys were conducted in the Azov Sea, Kerch Strait (July 2001 and August 2002) and northeastern shelf area (August 2002); vessel-based surveys were performed in the Kerch Strait (August 2003), the entire 12-miles zone of the Ukrainian and Russian Black Sea (September�����October 2003), the southern portion of Georgian territorial waters (January 2005), and central part of the Black Sea between the Crimea peninsula, Ukraine, and Sinop province of Turkey (September�����October 2005). Results of those surveys (Table 10.3) suggest that present population size of P. p. relicta is at least several 1000s or, rather, some 10,000s. Very low concentrations of harbour porpoises (too scanty for customary statistic analysis) were determined at the height of summer in the Kerch Strait and over the northeastern Black Sea shelf area (Birkun et al., 2002, 2003).
10.2.4. Habitat and ecology
Harbour porpoises inhabit mainly shallow waters (0�����200 m deep) over the continental shelf around the entire perimeter of the Black Sea, although they may also expend quite far offshore in deep water area (e.g., Mikhalev, 2004b). For instance, in late September ����� early October 2005, sizeable groups were recorded in the central Black Sea, beyond the shelf edge some 38�����215 km from the nearest coast over depths of 450�����2,170 m (Krivokhizhin et al., 2006). During warm periods they are present in the Azov Sea and Kerch Strait (Tzalkin, 1940a; Kleinenberg, 1956; Birkun et al., 2002) and in the Marmara Sea and Bosporus (���zt��rk and ���zt��rk, 1997). Both of these small seas as well as the northwestern Black Sea shelf zone represent geographically disjunctive breeding-calving-feeding areas while the straits (the Kerch Strait and Bosporus) serve as migration corridors.
Harbour porpoises undertake penduliform annual migrations, leaving the Azov Sea (Tzalkin, 1938) and northwestern Black Sea (Birkun, 2006a) before winter and returning in spring. These animals have never been recorded along the Bosporus in January, February and March (���zt��rk and ���zt��rk, 1997). The primary overwintering area of Black Sea harbour porpoises is the southeastern Black Sea (Birkun et al., 2006b) that covers southern territorial waters of Georgia between Cape Anaklia to the north and the Turkish border near Sarp to the south, and eastern Turkish territorial waters. These are also well-known overwintering grounds of the Black Sea and Azov Sea anchovy populations (Engraulis encrasicolus ponticus) ����� a principal prey species for harbour porpoises during the cold season (Kleinenberg, 1956). It is possible that most of the Black Sea porpoise population congregates there every year. In January 2005, the density estimated in Georgian waters was 1.54 porpoises per km2 (CV = 26.5%; Birkun et al., 2006b), i.e. 6�����39 times higher densities reported for any other Black/Azov Sea area surveyed in summer or autumn (Table 10.3).
The ecology of Black Sea harbour porpoises and other cetaceans residing in this basin is rather peculiar owing to the high degree of geographical isolation of their habitat, relatively low water salinity, significant seasonal fluctuations of water temperature, as well as a large amount of anoxic waters below 100-250 m.
Table 10.3. Estimates of Black Sea cetaceans density (individuals per 1 km2) and absolute abundance in the selected maritime areas�� (values of 95% confidence interval are enclosed in brackets)
| Surveyed area and���� observation effort | Survey platform | Research period | Estimates uncorrected for availability or detection bias | References | |||||
| harbour porpoises | common dolphins | bottlenose dolphins | |||||||
| density | abundance | density | abundance | density | abundance | ||||
| Turkish Straits System (Bosphorus, Marmara Sea and Dardanelles) | vessel | October 1997 | na | na | 773(292�����2,059) | na | 495(203�����1,197) | Dede (1999), cited after: IWC (2004) | |
| August 1998 | na | na | 994(390�����2,531) | na | 468(184�����1,186) | ||||
| Azov Sea in whole;���� 40,280 km2 / 2,735 km | aircraft | July 2001 | 0.07�� (0.03�����0.16) | 2,922(1,333�����6,403) | 0 no sightings | 0 no sightings | Birkun et al. (2002) | ||
| Southern Azov Sea (within above area); 7,560 km2 / 413 km | aircraft | July 2001 | 0.12 (0.04�����0.36) | 871(277�����2,735) | 0 no sightings | 0 no sightings | Birkun et al. (2003) | ||
| Southern Azov Sea (the same area); 7,560 km2 / 716 km | aircraft | August 2002 | 0.12�� (0.06�����0.27) | 936(436�����2,009) | 0 no sightings | 0 no sightings | Birkun et al. (2003) | ||
| Kerch Strait in total;������ 890 km2 / 353 km | aircraft | July 2001 | nasmall sample size: 5 sightings / 12 animals | 0 no sightings | 0.09 (0.03�����0.22) | 76 (30�����192) | Birkun et al. (2002) | ||
| August 2002 | na small sample size: 4 sightings / 4 animals | 0 no sightings | 0.10 (0.04�����0.27) | 88 (31�����243) | Birkun et al. (2003) | ||||
| Kerch Strait;�� 862 km2 / 310 km | vessel | August 2003 | 0.06 (0.01�����0.28) | 54 (12�����245) | 0 no sightings | 0.15 (0.08�����0.28) | 127 (67�����238) | Birkun et al. (2004a) | |
| NE shelf area of the Black Sea; 7,960 km2 / 791 km | aircraft | August 2002 | na small sample size: 8 sightings / 15 animals | na small sample size: 1 sighting /���� 1 animal | 0.10 (0.04�����0.26) | 823 (329�����2,057) | Birkun et al. (2003) | ||
| NW, N and NE Black Sea (Ukrainian and Russian territorial waters); 31,780 km2 / 2,230 km | vessel | September�����October 2003 | 0.04 (0.02�����0.09) | 1,215 (492�����3,002) | 0.17 (0.09�����0.31) | 5,376 (2,898�����9,972) | 0.13 (0.08�����0.22) | 4,193 (2,527�����6,956) | Birkun et al. (2004a) |
| SE Black Sea withinGeorgian territorial waters;������ 2,320 km2 / 211 km | vessel | January 2005 | 1.54 (0.89�����2.65) | 3,565 (2,071�����6,137) | 4.18 (2.16�����10.11) | 9,708 (5,009�����18,814) | 0 no sightings | Birkun et al. (2006b) | |
| Central Black Sea beyond territorial waters of Ukraine and Turkey; 31,200 km2 / 660 km | vessel | September�����October 2005 | 0.26 (0.06�����1.27) | 8,240 (1,714�����39,605) | 0.15�������� (0.05�����0.51) | 4,779 (1,433�����15,945) | 0 no sightings | Krivokhizhin et al. (2006) | |
�� ���œna���� ����� not available.
The mean group size varies from 1.4 to 10.7 in different areas (Birkun et al., 2002, 2003, 2004a; Krivokhizhin et al., 2006).�� Along paths of seasonal migration, harbour porpoises may remain for a few days in different sites (usually bays abundant in fish), forming dense aggregations consisting of some hundreds of individuals. Such accumulations were recorded off the southern coast of Crimea in December�����January 1994 (Laspi Bay), March 1995 (near Cape Meganom) and April 2005 (between Cape Aya and Cape Fiolent) (A. Birkun, Jr. and S. Krivokhizhin, unpubl. data). Sometimes, early and rapid ice formation arising immediately after warm ���œindian summer���� puts obstacle on the way of their evacuation from the Azov Sea and, thus the ice entrapment causes mass mortality events (Kleinenberg, 1956). Such die-off has happened in November 1993 (Birkun and Krivokhizhin, 1997). Black Sea harbour porpoises do not avoid waters with low salinity and transparency; they may occur in the estuarine and fluvial environment represented by brackish bays, lagoons, rivers and their estuaries (see Section 10.2.2; all records belong to warm season and northern half of the basin).
Table 10.4. Target fish species of Black Sea cetaceans (+ ����� prey species confirmed by identification of food residues in stomach contents of the cetaceans; �� ����� suspected prey species listed on base of indirect evidences)
| Fishes | Cetaceans | ||
| P. p. relicta | D. d. ponticus | T. t. ponticus | |
| Thornback ray, Raja clavata | ����� | ����� | + c,g,h |
| Black Sea sprat, Sprattus sprattus phalaericus | + l,m | + c,d,e,g,h,i,j,m | ����� |
| Black/Azov Sea shad, Alosa spp. | + f,g,m | + h | ����� |
| Black Sea anchovy, Engraulis encrasicolus ponticus | + c,f,g,h,i,m | + c,d,e,g,h,i,m | + c,g,h,i |
| Black Sea garfish, Belone belone euxini | ����� | + m | ����� |
| Black Sea whiting, Merlangius merlangus euxinus | + f,g,l,m | + c,d,e,g,h,m | + c,g,h |
| Pipefish, Syngnathus schmidti | ����� | + c,h | ����� |
| Pipefish, Syngnathus typhle | ����� | + c,h | ����� |
| Pelagic pipefishes unidentified, Syngnathidae gen. sp. | ����� | + c,d,g,h | ����� |
| Striped mullet, Mugil cephalus | ����� | ����� | + c,g,i |
| Golden mullet, Liza aurata | + f | ����� | ����� |
| Far-east mullet, Liza haematocheila syn. Mugil so-iuy | + m | ����� | �� k,m |
| Black Sea mullets, Liza spp. (other than L. haematocheila) | + g | �� b | + c,g,h,i |
| Black Sea silverside, Atherina boyeri syn. A. pontica | + f,g | ����� | ����� |
| Bluefish, Pomatomus saltatrix | ����� | + g,h | ����� |
a, ������� Meyer (1794);, b, ������� Malm (1933);, c, ������� Kleinenberg (1936); d, ������� Tzalkin (1937);, e, ������� Malm (1938);, f, ������� Tzalkin (1940a); g, ������� Tzalkin (1940b);, h, ������� Kleinenberg (1956);, i, ������� Tomilin (1957); j, ������� Tarasevich (1958);, k, ������� Birkun and Krivokhizhin (1996);, l, ������� Tonay and ���z (1999); m, ������� Krivokhizhin et al.�� (2000); , n, ������� Bel�����kovich (2001).,
Table 10.5. Life history parameters of Black Sea cetaceans
| Parameters | Cetaceans | ||||||
| P. p. Relicta | D. d. ponticus | T. t. ponticus | |||||
| raw original data | Defaults for porpoise a | raw original data | defaults for long-lived odontocete a | raw original data | defaults for long-lived odontocete a | ||
| Sexual maturity Age�� / first reproduction, years | female | 3�����4 b | 4 | 2�����4 c,d | 7 | 12 e | 7 |
| male | 3.5�����4 b | 3 c,d | 11 e | ||||
| Longevity (max agef), years | at least 12 b | 20 | 20�����22 d | 70 | 25�����30 g | 70 | |
| Percentage of the population that is reproductively mature, % | na | 52�����55 | na | 68�����90 | na | 68�����90 | |
| Average age of parents in the popu-lation (generation time), years | 6♀ and 6.7♂ b | 9�����10 | 15♀ d | 21�����33 | 26♀ and 19♂ e | 21�����33 | |
| Gestation time, months | 9�����10 | Na | 10�����11 c | na | 12 i | Na | |
| Average interbirth interval, years | 1 g | Na | 1.3�����2.3 j | na | from 2-3 to 6 g | na | |
| Maximum potential annual rate of popula-tion increase, % | na | 2 | na | 2 | na | 2 | |
| Birth rate k | na | 0.4 | na | 0.1 | na | 0.1 | |
| Non-calf survival rate (SA) l | na | 0.89 | na | 0.99 | na | 0.99 | |
| Survival rate in the first year of life (S0)m | na | 0.62 | na | 0.84 | na | 0.84 | |
a ����� The ACCOBAMS and IUCN Workshop on Red List Assessment of Cetaceans in the ACCOBAMS Area (Monaco, 5-7 March 2006; Reeves and Notarbartolo di Sciara, 2006) noted that reliable data and analyses of vital rates are unavailable for the populations of cetaceans in the Black Sea. Therefore, Philip S. Hammond (Sea Mammal Research Unit, St. Andrews, UK), based on the unpublished draft by Barbara L. Taylor (Southwest Fisheries Science Center, La Jolla, USA), has prepared a table of ���œdefaults���� for key parameters which are quoted here as ���œdefaults for porpoise���� and ���œdefaults for long-lived odontocete����; ��
b ����� BLASDOL (1999);������ c ����� Kleinenberg (1956);������ d ����� Kleinenberg and Klevezal����� (1962);������ e ����� Klinowska (1991);������ f ����� maximum age at which 1% of a population remains alive;
g ����� Tomilin (1957);������ h ����� Tzalkin (1940a);������ i ����� Geptner et al. (1976);������ j ����� Perrin and ��
���������� Reilly (1984);
k ����� Birth rate is defined as the number of female births per female per year: 1 female per female every 2.5 years for porpoise, 1 female per female every 10 years for long-lived odontocete (including D. d. ponticus and T. t. truncatus); it is assumed that for long-lived odontocete reproductive senescence begins (no reproduction occurs) after age 50;
l ����� SA is defined as survival rate of all ages after the first birthday, and calculated to give 1% survival at maximum age;
m ����� S0 is calculated as a multiplier of SA (0.7 for porpoise and 0.85 for long-lived odontocete);
���œna���� ����� not available.
According to the data presented in Table 10.4, at least 18 fish species have been recorded in the stomach contents of P. p. relicta (Kleinenberg, 1936, 1956; Tzalkin, 1940a,b; Tomilin, 1957; Tonay and ���z, 1999; Krivokhizhin et al., 2000) . They included four fishes which could be recognized as the most important prey: the anchovy (E. e. ponticus), sprat (Sprattus sprattus phalaericus), whiting (Merlangius merlangus euxinus) and gobies (Gobiidae).
10.2.5. Life history
In general terms, the Black Sea harbour porpoise is a relatively short-lived animal with the highest reproduction ability in comparison with other Black Sea cetacean species (Table 10.5).
Table 10.6. Known (documented) threats to Black Sea cetaceans1
| Threat | Cetaceans | |||
| P. p. relicta | D. d. ponticus | T. t. ponticus | ||
| Harvesting (dolphin fishery) for fuel, materials, medicine and food | past | past | past | |
| Harvesting (live capture) for scientific, military and leisure activities | past | past | ongoing | |
| Accidental mortality caused by fisheries-related bycatch (mainly entanglement) | ongoing | ongoing | ongoing | |
| Accidental mortality caused by explosion of gas-output platform | past, future (?) | unknown | unknown | |
| Persecution (frightening and killing) by fishermen with fire-arms and pyrotechnics | unknown | unknown | ongoing | |
| Unregulated release of captive animals and spontaneous escapes from captivity | unknown | unknown | past, future (?) | |
| Habitat degradation (reduction of prey resources) caused by fisheries | ongoing | ongoing | ongoing | |
| Habitat degradation (reduction of prey resources) caused by invasive alien species | ongoing | ongoing | ongoing | |
| Water pollution (agricultural, domestic, industrial, etc.) affecting habitat and cetaceans | ongoing | ongoing | ongoing | |
| Pathogens and parasites including those which cause cetacean mass mortality events | ongoing | ongoing | ongoing | |
| Natural disasters (temperature extremes) causing cetacean die-offs by ice entrapment | past, future (?) | unknown | unknown | |
| Intrinsic factors: | restricted range of the subspecies | ongoing | ongoing | ongoing |
| relatively low reproduction ability | no | no | Ongoing | |
| 1 ����� Besides threats listed in this table, there are some other threats suspected to be essential factors affecting Black Sea cetacean populations (e.g., disturbance/ noise caused by marine traffic and other human activities, collisions with shipping, habitat degradation caused by man-made modification of the seabed and coasts, global warming, etc.). However, these factors were not investigated yet in the Black Sea region, and their study represents important task in view of further application of the results for cetacean conservation. | ||||
The life span is not studied well; perhaps, it is similar to conspecifics in the North Atlantic, estimated as long as 24 years (Read, 1999). Based on the counts of dentinal growth layers, maximum age of the bycaught Black Sea harbour porpoises was found as 10-12 years, whereas gross and histological signs suggested sexual maturity in males and females at the earliest age of 3.5�����4 and 3�����4 years, respectively (BLASDOL, 1999). In conformity with these data, the mean age of parental individuals comes to 6.7 years in males and 6.0 years in females. However, these values seem to be influenced (shortened) by past and ongoing threats and, thus, do not reflect natural generation length, which is probably similar to the generic generation time of about 9-10 years estimated for Phocoena spp. (Table 10.5). According to data collected during the period of extensive Black Sea cetacean fishery (when thousands of P. p. relicta individuals and hundreds of their embryos/foetuses have been examined), the mating occurs mainly in summer; mature females become pregnant almost annually, with a gestation period of 9�����10 months and usual birth of one calf between May and early August; the nursing/lactation period lasts 4�����6 months (Tzalkin, 1940a; Kleinenberg, 1956; Tomilin, 1957; Geptner et al., 1976). Somewhat different terms are known for the harbour porpoise, P. phocoena, from other areas: gestation ����� 10�����11 months, lactation ����� at least 8 months (Read, 1999).
10.2.6. Past and ongoing threats
Up to 1983, the uncontrolled directed takes were primary threat to the population. Large numbers of harbour porpoises, as well as other Black Sea cetaceans, were taken during the 20th century by all Black Sea countries for manufacturing the lamp-oil, currier's oil, engine and lubricating oils, vitamin-D-containing medicines, paints, varnishes, soap, cosmetics, tinned meat and sausages, leather-shoe wares, ���œfish���� meal for poultry, bone fertilizer and glue (Silantyev, 1903; Kleinenberg, 1956; Berkes, 1977; Buckland et al., 1992; Birkun, 2002a). A total number of killed individuals is unknown. However, it is generally acknowledged that all Black Sea cetacean populations including the harbour porpoise were badly reduced by the dolphin fishery (IWC, 1983, 1992, 2004). Catches of harbour porpoises were numerically less than common dolphins until 1964 when they became dominant (Smith, 1982). From 1976 to 1981, harbour porpoises were believed to account for 80% of the total catch of cetacean fisheries in Turkey, with 34,000 to 44,000 taken annually (IWC, 1983). During last 15 years, since 1991, there was no evidence of illegal directed takes which were reported formerly (IWC, 1992). Nevertheless, it could be suspected that the population which did not recover till now continues to be depressed due to other, ongoing, threats.
At present, incidental catch in fishing nets is the most important threat and major source of human-induced mortality of P. p. relicta (e.g., Birkun, 2002c). All three Black Sea cetacean species are known to be taken as bycatch, but incidental takes of harbour porpoises evoke the greatest concern. Harbour porpoise bycatches represent the majority (95%) of cetacean entanglements on record; however, absolute numbers of population losses caused by fishing operations were not estimated. Preliminary indications suggest that annual level of harbour porpoise bycatches is hardly sustainable and can be numbered by thousands of individuals. The porpoises are caught in a variety of fisheries, although 99-100% of bycatches occur in the bottom-set gillnets for turbot (Psetta maxima maeotica), spiny dogfish (Squalus acanthias) and sturgeon (Acipenser spp.) with a peak in April�����June during the turbot fishing season. The bycatches occur in the Azov Sea and Kerch Strait and throughout shelf area of the Black Sea including territorial waters of riparian countries. Almost all (910.9%) recorded bycatches are lethal (BLASDOL, 1999). Illegal, unreported or unregulated (IUU) fishing is widespread in the Black and Azov Seas suggesting that significant share of bycatches takes place due to this human activity.
Large-scale pelagic and small-scale coastal fisheries affect Black Sea harbour porpoises also indirectly, by force of excessive exploitation of those fish species which represent the basic prey. First of all, this concerns anchovies in the Black Sea and gobies in the Azov Sea. In particular, the overfishing combined with the eutrophication and population explosion of alien raptorial ctenophore Mnemiopsis leidyi led to dramatic decline of anchovy abundance in the late 1980s and early 1990s (Prodanov et al., 1997; Zaitsev and Mamaev, 1997; Birkun, 2002b,c). The reduced prey availability concurred with two mass mortality events (in 1989 and 1990) impacted on all three Black Sea cetacean species but mostly on P. p. relicta (Birkun, 2002e). Severe pulmonary nematodosis, caused by Halocercus spp. and complicated by bacterial super-infection, was recognized as a primary cause of deaths that eliminated mainly young animals. The malnutrition along with bioaccumulation of POPs could provoke those epizootics, suppressing the resistance of porpoises to pathogens. High concentrations of organochlorines and relatively low concentrations of toxic trace elements have been detected in P. p. relicta by different authors (Birkun et al., 1993 ; Madhusree et al., 1997; Tanabe et al., 1997a,b; Glazov and Zhulidov, 2001; Joiris et al., 2001; Das et al., 2004). The contamination of Black Sea harbour porpoises by DDTs and HCHs in the 1990s was higher than that reported for this species elsewhere in the world (Tanabe et al., 1997a); thus water pollution could be considered as a major problem on its own.
Black Sea harbor porpoises were also threatened by ice entrapment in the Azov Sea (see Section 10.2.4). Besides, in August 1982, the explosion of drilling platform in the Azov Sea caused mortality of over 2,000 porpoises (Birkun, 2002d). Another potential threat is the morbillivirus infection. Serological examination of bycaught animals revealed positive morbillivirus-neutralizing antibody titers in harbour porpoises from Bulgarian, Georgian and Ukrainian waters (M��ller et al., 2002). This suggests the persistence of morbilliviruses in the population, with possible outbreaks of devastating epizootics in future.
The cumulative data on past and ongoing threats to Black Sea harbour porpoises can be found in Table 10.6.
10.2.7. Population trend
In the 20th century, abundance of Black Sea harbour porpoises was considerably reduced by massive direct killing for the cetacean-processing industry which continued till 1983 (see section 10.2.6). However, the number of animals taken was not recorded accurately; much of the catch data was recorded as numbers of animals undifferentiated to species level (all three Black Sea cetacean species were targeted) and in the form of wet weight aggregates (e.g. pounds or tons of dolphin/porpoise landed). Nevertheless, it could be inferred from the available data that the population size of P. p. relicta was reduced due to the direct kills by some hundreds of thousands when the total ban on dolphin fishery has been introduced in the Black Sea. It could be suspected also that the population did not recover during the subsequent period (1983-2006) and, most likely its state became much worse and its size even diminished owing to the escalation of ongoing major threats, such as the fisheries-related bycatch, human induced habitat degradation, etc. These threats, including the bycatch in bottom-set gillnets, are poorly managed in most Black Sea countries; so, further decline of the population seems to be highly likely.
10.3. Short-beaked common dolphin (Delphinus delphis ponticus)
10.3.1. Taxonomy and genetics
The Black Sea common dolphins are recognized as a well isolated discrete population possessing clear genetic differences from D. delphis in the eastern and western Mediterranean (Natoli, 2003, cited after: IWC, 2004; Natoli, 2004). This cetacean is the sole representative of the genus Delphinus and one of two Delphinidae species in the Black Sea fauna (Table 10.1). The subspecies name, D. d. ponticus, was given based on some morphological features (Barabasch, 1935) which were criticized at least as inessential (e.g., Kleinenberg, 1956). Subsequent comparative skull morphometrics (Amaha, 1994; Amaha et al., 1996) and genetic analysis of nine microsatellite DNA loci (Natoli 2003, cited after: IWC, 2004) suggested differences between Black Sea and Mediterranean common dolphins, although no significant differentiation was revealed at the mitochondrial level, probably, owing to small sample size (Natoli, 2004). Thus, clear conclusion on taxonomic (subspecies) status of Black Sea common dolphins is still unfeasible (A. Natoli, pers. comm.). However, according to available data, it is likely that gene flow between the Black Sea and Mediterranean Sea is rare or non-existent, and the Black Sea population deserves to be treated as a discrete unit for conservation purposes (IWC, 2004).��������
10.3.2. Distribution
The range of the Black Sea common dolphin population is represented by the almost entire Black Sea (Table 10.2) including territorial waters and exclusive economic zones of Bulgaria, Georgia, Romania, Russia, Turkey and Ukraine, and internal waters of Ukraine in Karkinitsky Bay (Kleinenberg, 1956; Geptner et al., 1976; Birkun, 2006a); and by internal waters of Turkey including the Bosporus Strait and Marmara Sea (���zt��rk and ���zt��rk, 1997). Common dolphins do not occur in the Azov Sea and normally avoid the Kerch Strait, although a single live stranding was recorded there in 1994 at the time of morbillivirus epizootic (Birkun et al., 1999). There is no reliable information on D. delphis presence on possible two-way transit between the Black Sea and Mediterranean Sea through the Turkish Straits System.
10.3.3. Abundance
The population size of Black Sea common dolphins is still unknown. Previous estimates, based on strip transect aerial and boat surveys conducted in 1960s�����1980s, have been grimly criticized by the IWC Scientific Committee owing to methodological and interpretative imperfections (see Section 10.2.3 for references). However, it was widely acknowledged that originally and during almost two thirds of the 20th century the abundance of common dolphins in the Black Sea was by far higher than the abundance of bottlenose dolphins and harbour porpoises (Tzalkin, 1940b; Kleinenberg, 1956; Geptner et al., 1976). During last decade (1997-2006) several line transect surveys have been conducted to estimate common dolphin abundance in the Turkish Straits System (Dede, 1999, cited after: IWC, 2004); northern, northwestern and northeastern Black Sea within the bounds of Russian and Ukrainian territorial waters (Birkun et al., 2004a); southeastern Black Sea within Georgian territorial waters (Birkun et al., 2006b); and central Black Sea between territorial waters of Ukraine and Turkey (Krivokhizhin et al., 2006). These abundance estimates (Table 10.3) suggested that current population size of D. d. ponticus is at least several 10,000s. The highest density of common dolphins (4.18 animals/km2; CV = 31.4%) was revealed in the Georgian Black Sea in January 2005 (Birkun et al., 2006b).
10.3.4. Habitat and ecology
Common dolphins are distributed mainly offshore and visit shallow coastal waters following seasonal aggregations and regular mass migrations of the preferred prey, small pelagic fishes, first of all, the Black Sea anchovy (E. e. ponticus) and Black Sea sprat (S. s. phalaericus) (Tzalkin, 1940b; Kleinenberg, 1956; Geptner et al., 1976; Bushuyev, 2000; Bushuyev and Savusin, 2004; Mikhalev et al., 2004). However, a full list of fishes consumed by D. d. ponticus contains not less than 11 species (Table 10.4). Winter aggregation of anchovies in the southeastern Black Sea and, to a lesser degree, to the south of Crimea sets suitable conditions for overwintering accumulations of these cetaceans. Summer concentrations of sprats in the northwestern, northeastern and central Black Sea also attract common dolphins to different feeding grounds. The cetaceans avoid waters with low salinity, and this can be a reason why they never occur in the Sea of Azov and, normally, in the Kerch Strait. The mean size of common dolphin groups recorded in 2003-2005 varied from 2.9 to 5.4 (S. Krivokhizhin, pers. comm.), and many such groups can be observed in places very close to each other.
10.3.5. Life history
Some original data regarding the life history of Black Sea common dolphins and relevant default estimates for long-lived odontocetes are present in Table 10.5. Given the small sample size (17 individuals), the estimated life span (20 years) and average age (15 years) of sexually mature females (Kleinenberg and Klevezal�����, 1962) can be considered as tentative parameters for preliminary analysis only. Besides, these parameters as well as the age of sexual maturity in females (2-4 years) (Kleinenberg, 1956; Kleinenberg and Klevezal�����, 1962) are likely biased because of convenience (unrepresentative) sample affected by ���œschooling segregation���� of Black Sea common dolphins (Perrin and Reilly, 1984).
10.3.6. Past and ongoing threats
Known threats affected Black Sea common dolphins are listed in Table 10.6. Last century, the population was collapsed by the directed takes. A total number of killed animals is unknown, but it was estimated that before the mid-1950s the share of common dolphins killed and processed in the former Soviet Union reached 94.8% of all Black Sea cetaceans taken (Tzalkin, 1940b; Kleinenberg, 1956). Based on this value, it was calculated that USSR and Bulgaria have caught and landed about 179,000 common dolphins during the last six years of cetacean fishery (1961-1966), while this number was as high as 1,392,000 (Zemsky, 1996) or probably more during the preceding 30 years (1931-1960). Between 1976 and 1981, D. d. ponticus was believed to account for 15-16% of the Turkish catch, estimated as 250,000 of all three species (IWC, 1983).����
The reduced prey availability has been considered as ongoing major threat affecting the Black Sea common dolphins since the late 1980s (Bushuyev, 2000). Of two mass mortality events eliminated unknown but certainly large numbers of common dolphins in winter�����spring 1990 and summer�����autumn 1994 (Krivokhizhin and Birkun, 1999), the latter was considered to be due to the result of a morbillivirus epizootic (Birkun et al., 1999). However, both die-offs concurred with drastic decline in abundance of both principal prey species, the anchovy (E. e. ponticus) and sprat (S. s. phalaericus), severely affected by overfishing combined with the consequences of water pollution (e.g., eutrophication and water hypoxia) and population explosion of alien raptorial ctenophore M. leidyi (Zaitsev and Mamaev, 1997). This may suggest a cause-effect relationship between prey scarcity and common dolphin mass mortality.
Other known threats, including bycatch in pelagic trawls, parasitic invasions, accumulation of xenobiotics and live-capture for dolphinaria (Birkun, 2002a,b,c,e) are of secondary importance (at least for the present).
10.3.7. Population trend
According to the data described in Section 10.3.6, the population collapsed due to long-term dolphin fishery overexploitation in all Black Sea countries by the mid-1960s. However, the extermination continued until 1983 when cetacean hunting has been ceased finally in Turkey. The numbers of animals taken were not recorded properly, thus the overall population losses were not estimated. Nevertheless, it could be inferred that the population size of Black Sea common dolphins was reduced by the directed kills at least in half. Besides, it could be suspected that during the subsequent period (1983-2006) the population might have a tendency to increase but, possibly, with low success owing to mass mortality events (in 1990 and 1994) and pronounced depletion of common dolphin�����s primary prey within the same period. No doubt that the population has not fully or even substantially recovered from the survived stress till now, and further decline could be predicted if degradation of the Black Sea environment goes worse.
10.4. Common bottlenose dolphin (Tursiops truncatus ponticus)
10.4.1. Taxonomy and genetics
The Black Sea bottlenose dolphin is the sole representative of the genus Tursiops and one of two Delphinidae species in the Black Sea fauna (Table 10.1). It was recognized as a subspecies on the basis of morphological differences from Atlantic and Pacific conspecifics (Barabasch-Nikiforov, 1960; Geptner et al., 1976). The genetic data support the subspecies status of T. t. ponticus based on clear differentiation of the Black Sea population from other bottlenose dolphin populations and subpopulations in the eastern Mediterranean, western Mediterranean, southern and northern parts of the northeastern Atlantic (Natoli et al., 2005; A. Natoli, 2006, pers. comm.). According to those data, the Black Sea population is effectively isolated from the Mediterranean ones by ecological barrier in the Turkish Straits System, although limited gene flow between the both seas is probable, and possible vagrant from the Black Sea population was detected in the western Mediterranean (Natoli et al., 2005).
10.4.2. Distribution
The range of Black Sea bottlenose dolphins (Table 10.2) includes the entire Black Sea; Kerch Strait along with adjoining southern part of the Azov Sea (Tzalkin, 1940b; Birkun et al., 1997; Sokolov, 1997) and the Turkish Straits System (Kleinenberg, 1956; Beaubrun, 1995; ���zt��rk and ���zt��rk, 1997). In view of political geography, the range of this subspecies includes territorial waters and exclusive economic zones of Bulgaria, Georgia, Romania, Russia, Turkey and Ukraine in the Black Sea; internal waters of Ukraine in the Black Sea (including the Dnieper-and-Boug Liman, Karkinitsky Bay and Donuzlav Lake); internal waters of Russia and Ukraine in the Kerch Strait and Azov Sea; internal waters of Turkey including the Bosporus Strait, Marmara Sea and Dardanelles. There are a few records of bottlenose dolphins entering rivers, e.g. the Danube in Romania (Police, 1930, cited after: Tomilin, 1957) and Dnieper in Ukraine (Birkun, 2006a).
Population structure within the Black Sea is likely (Bel�����kovich, 1996) with several sub-subpopulations or ���œsemi-resident���� communities including those that spend most part of the year in geographically and ecologically different areas, e.g. northwestern Black Sea, coastal waters off the southern Crimea, Kerch Strait and adjoining portions of the Black Sea and Azov Sea, shelf waters off the Caucasian coast, Turkish Black Sea, and Turkish Straits System.
10.4.3. Abundance
The population size of T. t. truncatus is unclear in spite of numerous (but imperfect in view of the applied methodology and thus unreliable) estimates accomplished in the former USSR and Turkey before the mid-1990s (see more information in Section 10.2.3). Nevertheless, the abundance of bottlenose dolphins was considered as the smallest of the three cetacean populations in the Black Sea during most of the 20th century (Tzalkin, 1940b; Kleinenberg, 1956; Geptner et al., 1976; Yaskin and Yukhov, 1997). However, bottlenose dolphins became relatively prevalent in coastal waters of the northern Black Sea round the Crimea peninsula in the last quarter of the 1990s.
Over the period from 1990-1999, a total of 397 primary cetacean sightings were recorded in a coastal (20-60-km-wide) area surrounding the Crimean peninsula from the Karkinitsky Bay to Kerch Strait (Birkun et al., 2004c). The surveys were carried out in 1995, 1997 and 1998 by means of sailing and motor yachts covering distances from 255 to 934 km (10,371 km of observation effort in total). It was estimated that sighting score of T. t. ponticus individuals increased in five times in 1997 and 1998 in comparison with 1995, whereas numbers of harbour porpoises on record have declined. Relative abundance of the both coastal species, evaluated as a Tursiops/Phocoena ratio, suggested clear trend towards the predominance of bottlenose dolphins: June 1995 ����� 0.8/1; June 1997 ����� 0.9/1; June�����July 1998 ����� 6.8/1; September 1998 ����� 12.9/1. The difference between the last two figures could be explained by autumn accumulation of bottlenose dolphins in the waters closed to the southern extremity of the Crimea (between Cape Fiolent and Cape Sarych). Almost daily patrolling in that area in September�����October 1997 and August�����December 1998 confirmed the predominance of bottlenose dolphin abundance in comparison with harbour porpoises by 7-26 times. Bottlenose dolphin herds numbering hundreds of animals migrate every autumn to this relatively small area from the northeastern and, probably, other parts of the Black Sea (Birkun et al., 2004c; Birkun, 2006a).
A series of line transect surveys, supported by the ���œDistance���� sampling and analysis (Buckland et al., 1993), have been conducted since 1997 to estimate bottlenose dolphin (and other cetaceans) density and absolute abundance in different parts of the range, including the Turkish Straits System (Dede, 1999, cited after: IWC, 2004), Kerch Strait, and Russian and Ukrainian territorial waters in the Black Sea (Birkun et al., 2002, 2003, 2004a). These estimates, summarized in Table 10.3, suggested that the population size at present is not less than several 1000s.����
10.4.4. Habitat and ecology
Bottlenose dolphins are distributed across the Black Sea shelf area and far offshore (Beaubrun, 1995; Yaskin and Yukhov, 1997; Mikhalev, 2004a). In the northern Black Sea, they form scattered communities of some tens to approximately 1.5 hundred animals in different places round Crimea including the Kerch Strait and coastal waters off the western and southern extremities of the peninsula (Zatevakhin and Bel�����kovich, 1996; Birkun et al., 2004a; Birkun, 2006a). The sizeable accumulations are known also off the Russian Caucasus (O. Shpak and A. Kryukova, pers. comm.) and close to the Turkish coast (S. Krivokhizhin, pers. comm.). Bottlenose dolphins typically aggregate during autumn, winter and spring in relatively small area at the southern Crimea between Cape Sarych and Cape Khersones (Birkun et al., 2006b). According to the results of two-year photo-identification study, this overwintering accumulation consisted of animals from other, ���œsummer����, concentrations. The mean size of bottlenose dolphin groups varied from 2.0 to 2.9 in different surveyed areas (Birkun et al., 2002, 2003, 2004a).��
Bottlenose dolphins are primarily piscivorous in the Black Sea, taking both benthic and pelagic fishes, large and small. At least 13 fish species have been reported as prey of T. t. ponticus off the Crimean and Caucasian coasts (Table 10.4) including several species of mullets (Mugil cephalus, Liza aurata and L. haematocheila) which admittedly represent the most preferable diet. Deliberately introduced far-east mullet, L. haematocheila (syn. Mugil so-iuy), is an example of the influence of aquaculture on Black Sea cetacean forage resources. The introduction of this species, originated from the Sea of Japan, was carried out during 1972-1984 in the lagoons and coastal waters of the northwestern Black Sea and the Sea of Azov (Zaitsev and Mamaev, 1997).�� Since the late 1980s this fish became abundant and widespread throughout the region.�� Bottlenose dolphins and harbour porpoises include this new species in their diet (Krivokhizhin et al., 2000).
10.4.5. Life history
The ACCOBAMS and IUCN Workshop on Red List Assessment of Cetaceans in the ACCOBAMS Area (Monaco, 5-7 March 2006) noted that reliable information on vital rates is unavailable for the populations of cetaceans in the Black Sea (Reeves and Notarbartolo di Sciara, 2006). Thus, the data on wild Black Sea bottlenose dolphins (see Table 10.5 and text below) should be recognized as preliminary and, most likely, biased. Any use of them for scientific and conservation purposes demands meticulous care and verification.
The Black Sea bottlenose dolphin is considered as a cetacean with a life span of 25-30 years or more with relatively low reproduction rate (e.g., Tomilin, 1957). The average age of parents in the population is unknown; but it possibly extends to 26 years in females and 19 years in males (Klinowska, 1991). The interval between births is from two or three to six years (Tomilin, 1957), but in captive females the reproductive cycle can be as short as two years (Ozharovskaya, 1997). It was assumed that one female is unlikely to produce more than eight calves in her lifetime (Tomilin, 1984, cited after: Ozharovskaya, 1997). Sexual behaviour can be observed during the whole year with a peak in spring and early summer. The ovulatory season (maximum five spontaneous ovulations per year) extends from March to October with a peak in June; the highest concentrations of testosterone in captive males were recorded in July and the lowest in January (Ozharovskaya, 1997). Gestation lasts 12 months; twinning was not recorded in Black Sea bottlenose dolphins, thus, litter size is invariably one; lactation can last from four months to more than 1.5 years (e.g., Tomilin, 1957).
10.4.6. Past and ongoing threats
In the past, commercial killing was the main human activity affected the population, although the catch of bottlenose dolphins was usually less than those of common dolphins and harbour porpoises. Bottlenose dolphins were taken by all Black Sea countries for manufacturing various products mentioned in Section 10.2.6. A total number of killed animals is unknown, however, it is generally acknowledged that all Black Sea cetacean populations, including the bottlenose one, were reduced by the dolphin fishery (IWC, 1983, 1992, 2004). It was roughly estimated that a share of bottlenose dolphins constituted 0.5% of aggregate numbers of Black Sea cetaceans killed and processed in the USSR between the early 1930s and mid 1950s (Tzalkin, 1940b; Kleinenberg, 1956). At the same time, the statistics of Black Sea cetacean fishery were commonly expressed as total weight or total numbers of animals in the catch without species differentiation. Later on, this value (0.5%) was applied (with groundless extension of temporal and spatial frames of its use) for the re-computation of the recorded annual numbers of pooled cetacean catches/landings into the absolute numbers of T. t. ponticus directed catches in the Soviet Union (1931�����1966) along with Bulgaria (1958�����1966) (Zemsky, 1996). As a result, a total of 8,327 bottlenose dolphins were estimated during that 36-year period, with yearly variation from two (in 1944) to 738 (in 1938) individuals. In particular, the derived annual rates in 1946, 1961 and 1966 were 79, 304, and 30 bottlenose dolphins, respectively (Zemsky, 1996).
All these figures seem very dubious (i.e. utterly underestimated) given the three known facts: (a) more than 3,000 bottlenose dolphins were caught during a single day in one location close to the southern Crimea in spring 1946 (Kleinenberg, 1956); (b) the Bulgarian cetacean fishery was concentrated almost exclusively on T. t. ponticus and about 13,000 individuals of this subspecies were taken in 1961 (Nikolov, 1963, cited after: Sal�����nikov, 1967); (c) only one dolphin processing factory in Novorossiysk, Russia, processed 53 bottlenose dolphins (27 males and 26 females including 63% of pregnant and 10.4% of lactating animals) in April 1966 (Danilevsky and Tyutyunnikov, 1968).
Thus, taking into consideration the unknown but presumably significant levels of the Romanian and Turkish catch, it could be inferred that the number of bottlenose dolphins killed before the mid 1960s was very high, in some periods even exceeding the kills of the other two species. From 1976 to 1981, bottlenose dolphins were believed to account for 2-3% of the total catch of cetacean fisheries in Turkey with 34,000 to 44,000 taken annually (IWC, 1983; Klinowska, 1991). That makes up between 680�����1,320 individuals per year or between 4,080�����7,920 individuals during those six years alltogether. No reliable information on illegal commercial killing of Black Sea bottlenose dolphins is available after the ban on cetacean fisheries in 1983. The isolated cases of deliberate killing and harassment (frightening by pyrotechnic means and fire-arms) occurred as a result of adverse interaction between dolphins and coastal fisheries. For instance, at least two bottlenose dolphins were recorded shot in Balaklava, Ukraine, in 2004 (S. Popov, pers. comm.).��
Since the mid 1960s, hundreds (probably over one thousand) of bottlenose dolphins have been live-captured in the former USSR, Russia, Ukraine and Romania for military, commercial and scientific purposes (Birkun, 2002a). The capture operations sometimes were accompanied by the accidental death (usually unreported) of additional individuals. In recent years, up to 2002, the live-capture of 10-20 animals took place annually in May�����June in the Kerch Strait, Russia. During the 1980s�����2000s the number of facilities for dolphin show and ���œswimming with dolphins���� programs has vastly increased in Black Sea countries. The export of bottlenose dolphins from Russia and Ukraine for permanent and seasonal shows has also expanded, for example, to Argentina, Bahrain, Byelorus, Chile, Cyprus, Egypt, Georgia, Hungary, Iran, Israel, Kuwait, Lebanon, Lithuania, Morocco, Oman, Romania, Saudi Arabia, Syria, Turkey, United Arab Emirates, Vietnam, and former Yugoslavia countries. A few captive animals were exported from Georgia to Yugoslavia and then re-exported to Malta. According to CITES statistics, at least 92 individuals were removed from the Black Sea region within 1990-1999 period (Reeves et al., 2003).
At present, incidental catch in fishing gear is probably the major threat to T. t. ponticus, although these animals have never been the predominant species in national bycatch statistics, and their share in cetacean bycatches recorded in Black Sea countries during the 1990s comes to 3% at the most (Birkun, 2002c). Absolute numbers of the population losses caused by fisheries were not estimated; however, it was supposed that at least 200-300 individuals are taken annually as bycatch in Turkey (���zt��rk, 1999). Bottlenose dolphins are known to be caught in a variety of fishing nets including bottom-set gillnets for turbot (P. m. maeotica), spiny dogfish (S. acanthias), sturgeons (Acipenser spp.) and sole (Solea spp.), purse seines for mullets (Mugil and Lisa spp.) and anchovy (E. e. ponticus), trammel and trap nets. Nevertheless, only bottom-set gillnets pose a primary threat, especially, during the turbot fishing season, between April and June (BLASDOL, 1999).
Small-scale coastal fishery affects Black Sea bottenose dolphins also indirectly by depleting their prey populations. Declining trends have been observed in the abundance of indigenous mullets (M. cephalus and Lisa spp.) (Zaitsev and Mamaev, 1997). At the same time, the suspected deficiency of cetacean forage resources (Bushuyev, 2000) might be compensated at least in part by the introduced far-east mullet, L. haematocheila, which became abundant in the northern Black Sea since 1990s (Zaitsev and Mamaev, 1997) and possibly caused the relocation of bottlenose groups with marked enhancement of their density in coastal waters off the Crimea coasts (see Section 10.4.3).
According to annual compilations of cetacean strandings in Crimea (Krivokhizhin and Birkun, 1999), there was a prominent peak of T. t. ponticus strandings in 1990 (20 dead animals, representing 44% of all bottlenose dolphin strandings reported from 1989-1996). The initial cause and magnitude of that spike in bottlenose dolphin mortality remains unclear, although severe purulent pneumonia was revealed in many cases. The multi-microbial pollution originated from untreated sewage contaminating coastal waters constitutes a permanent risk of opportunistic bacterial infections in both the bottlenose dolphin and harbour porpoise populations. Besides, there are certain evidences that bottlenose dolphins as well as other Black Sea cetaceans are exposed to morbillivirus infection (Birkun, 2002e). Another ongoing threat (as a potential source of exotic infections and genetic ���œpollution����) is represented by poorly managed intentional releases and spontaneous escapes of captive bottlenose dolphins and other marine mammals from coastal dolphinaria/oceanaria. The releases of two Black Sea bottlenose dolphins returned to the Black Sea after their long-term residence in the Red Sea environment happened in 1996 and 2004 (Veit et al., 1997; ACCOBAMS/SC, 2005).
The further information on major threats impacting T. t. ponticus is shown in Table 10.6.
10.4.7. Population trend
The population size of Black Sea bottlenose dolphins was reduced due to the direct kills by some tens of thousands when the total ban on dolphin fishery has been attained in the Black Sea region in 1983 (see Section 10.4.7). It could be suspected that the population had a tendency to increase during the subsequent period (1983-2006) but still did not recover adequately because of several mass mortality events occurred not long ago, and some persistent anthropogenic influences which show growing trend at present and, most likely, will represent major threats provoking the population decline in the future.
10.5. Conservation tools and strategies
Commercial dolphin fishery was banned in 1966 in the former USSR (present Georgia, Russia and Ukraine), Bulgaria and Romania, and in 1983 in Turkey. Since then a number of substantial improvements of national and international legislation were undertaken in order to protect the Black Sea ecosystem, biodiversity and the cetacean populations, in particular.��
10.5.1. National instruments
On national level, Black Sea cetaceans are protected by environmental laws, governmental decrees and national Red Data Books. The bottlenose dolphin is listed in the Red Data Books in Bulgaria, Georgia, Russia and Ukraine, the harbour porpoise ����� in Bulgaria, Russia and Ukraine, and the common dolphin ����� in Ukraine only. All these national Red Data Books do not use the IUCN scale of categories and criteria, but implies that the species should be monitored and managed by appropriate state/national programs in Russia and Ukraine. Such a program exists in Ukraine since 1999 (���œDelfin����-program adopted by the Ministry of Environment). National action plans for the conservation of Black Sea cetaceans were produced in Ukraine (2001) and Romania (2003) but they still have no legal effect.
1. Dunaysky (Ukrainian Danube Delta) Biosphere Reserve; 2. Odessa Center of the Southern Research Institute of Marine Fisheries and Oceanography; 3. Odessa Branch of the Institute of Biology of Southern Seas; 4. Chornomorsky (Black Sea) Biosphere Reserve; 5. Lebedyni Ostrovy (Swan Isles) Branch of the Crimea Nature Reserve; 6. ���œTDC Nazaret���� Ltd.; 10. Brema Laboratory; 10. ���œBiological Station���� PE; 10. NGO ���œOasis����; 10. ���œGamma���� PE; 11. ���œLivadia Dolphinarium���� JE; 12. Cape Martyan Nature Reserve; 13. Karadag Nature Reserve; 14. Opuk Nature Reserve; 15. Southern Research Institute of Marine Fisheries and Oceanography; 16. Kazantip Nature Reserve; 110. Azov and Sivash National Nature Park; 110. ���œGroup for Scientific and Industrial Investigation���� PE; 110. ���œMeotida���� Landscape Park.
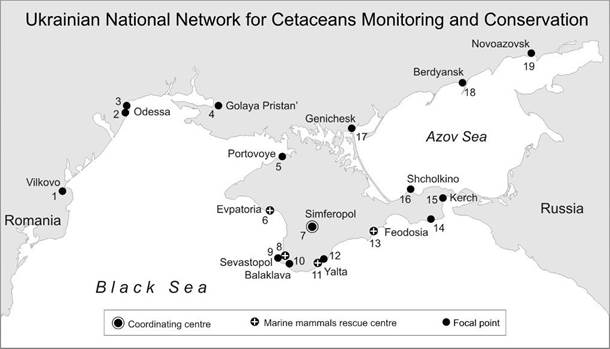
Fig. 10.1. Operational units of the Ukrainian National Network for Cetaceans Monitoring and Conservation (Birkun, 2006b).
Coastal and marine protected areas (PAs) are generally recognized as a primary tool for conservation of the marine environment and biodiversity (Hoyt, 2005). At present, over 60 protected areas and sites are established along the coastline of the Black Sea by the riparian states, and additional 40 areas were suggested for further development (Notarbartolo di Sciara and Birkun, 2002). Some of them contain marine mammal (cetacean and monk seal) habitats within their boundaries, and could thus serve for the monitoring and conservation of marine mammals if appropriate management objectives are set and the personnel is specifically trained. In this context, the most promising PAs are represented by existing biosphere reserves, nature reserves and national parks which have relatively well-developed infrastructure and research capabilities. The Romanian Danube Delta Biosphere Reserve and Vama-Veche ����� 2 Mai Marine Reserve are already involved in cetacean monitoring and conservation in Romania.
In 2003-2005, nine coastal protected areas joined the Ukrainian National Network for Cetaceans Conservation, informal fellowship consisting of 19 institutions (operational units) situated in 17 localities along the seaboard of Ukraine (Fig. 10.1).�� Those protected areas are (from west to east): the Dunaisky [Danube] Biosphere Reserve, Chornomorsky [Black Sea] Biosphere Reserve, Lebedyni Ostrovy [Swan Islands] Branch of the Crimean Nature Reserve, Cape Martyan Nature Reserve, Karadag Nature Reserve, Opuk Nature Reserve, Kazantip Nature Reserve, Azov and Sivash National Nature Park, and Meotida Landscape Park (the latter three PAs are situated in coastal zone of the Azov Sea, while the other six PAs relate to the Black Sea coasts and waters). The inventory of cetacean habitats has been completed and common methodology for cetacean monitoring was introduced in these Ukrainian PAs in 2005. Other Black Sea countries so far do not follow this initiative.
10.5.2. International and regional instruments
The riparian states assumed international obligations to protect Black Sea cetaceans as the contracting parties of the ACCOBAMS, the Convention on Biological Diversity (CBD), the Convention on the Conservation of Migratory Species of Wild Animals (CMS), the Convention on the Conservation of European Wildlife and Natural Habitats (Berne Convention), the Convention on the Protection of the Black Sea Against Pollution (Bucharest Convention), and the Convention on International Trade in Endangered Species of Wild Fauna and Flora (CITES, Appendix II). The harbour porpoise (P. phocoena) and bottlenose dolphin (T. truncatus) are mentioned in Annex II and the common dolphin (D. delphis) is listed in Annex IV of the EC Directive No.92/43/EEC on the conservation of natural habitats of wild fauna and flora. All these instruments should contribute to Black Sea cetacean conservation, especially, the ACCOBAMS and Bucharest Convention.
In 1996, the Ministers of Environment of Black Sea countries adopted some cetacean conservation and research measures in frames of the Strategic Action Plan for the Rehabilitation and Protection of the Black Sea (paragraph 62). In 1999, all three species were included as ���œData Deficient���� (DD) in the regional Black Sea Red Data Book. However, in 2002 they were re-listed as ���œEndangered���� (EN) in the Provisional List of Species of the Black Sea Importance, an annex to the Black Sea Biodiversity and Landscape Conservation Protocol of the Bucharest Convention.
The Berne Convention�����s Recommendation No.86 (2001) and Resolution 1.12,�� adopted by the 1st Meeting of the Parties of ACCOBAMS (Monaco, 2002), are intended to strengthen prohibition measures for deliberate catch, keeping and trade of Black Sea bottlenose dolphins. At the 12th Conference of the Parties to CITES (Santiago, 2002), a quota of zero for mercantile export of live bottlenose dolphins wild-captured in the Black Sea has been secured. This measure prohibits transboundary transport of captive Black Sea bottlenose dolphins for ���œprimarily commercial purposes����.
The ACCOBAMS Implementation Priorities for 2002-2006 (Notarbartolo di Sciara, 2002) envisage the development of a pilot conservation and management project in the well defined area between Cape Sarych and Cape Khersones, southern Crimea (Ukraine; see Sections 6.4.3 and 6.4.4), for the purpose to establish a marine protected area specialized in conservation of bottlenose dolphins and harbour porpoises. The 1st Meeting of the ACCOBAMS Scientific Committee (Tunis, 2002) recommended that more areas be investigated for identification of critical habitats. Particular concern was expressed by the same meeting in view of large and potentially unsustainable bycatches of harbour porpoises in bottom-set gillnet fisheries throughout the Black Sea shelf area. It was concluded (Recommendation 1.2) that the conservation status of these animals would be greatly improved if existing fisheries regulations restricting fishing effort and the use of certain gear types is enforced.
The Sub-Committee on Small Cetaceans of the IWC Scientific Committee (Berlin, 2003) reviewed the status of Black Sea cetaceans in details and concluded that these populations of harbour porpoises, common dolphins and bottlenose dolphins, which are almost completely isolated from their conspecifics in the northeastern Atlantic and Mediterranean Sea, should be considered as the separate and discrete units for conservation purposes (IWC, 2004). At the same time, it turned out impossible to evaluate fully the status of Black Sea cetaceans due to a lack of basic information. In this respect, the Sub-Committee strongly recommended to improve the conservation-related cetacean research in the region by means of developing the region-wide (a) line-transect surveys, (b) photo-identification programme, (c) genetic analyses of population structure, (d) studies on cetacean life history, (e) comprehensive assessments of man-made threats including the incidental captures in fishing activities, disturbance caused by marine traffic, and past cetacean losses due to the directed catches.����������
A tentative list of cetacean research and conservation projects implemented in the Black Sea region in 2002�����2006 is shown in Appendix A.
The 4th Meeting of the ACCOBAMS Scientific Committee (Monaco, 2006) devoted special consideration to the ACCOBAMS Work Programme on Marine PAs. In particular, it was reminded that the 1st Meeting of the Parties to ACCOBAMS (Monaco, 2002) proposed for the development a pilot PA within inshore waters between Cape Sarych and Cape Khersones in the southern Crimea. In addition to this area the Scientific Committee recommended that the Parties give priority to assessing the value of creating marine PAs for the following additional three areas in the Black Sea and adjacent waters:
maritime area from Cape Anaklia to Sarp (Georgia) ����� this represents winter habitat for harbour porpoises and common dolphins; in particular, there is a local problem with pelagic trawling for anchovy, which causes a dolphin bycatch;
the Kerch Strait (Ukraine and Russia) ����� used by semi-resident Black Sea bottlenose dolphins and as a migration corridor for several thousand harbour porpoises moving to and from the Azov Sea; there is intensive marine traffic and coastal fisheries with bycatch in gillnets and live captures of bottlenose dolphins; and
the Turkish Strait System (Turkey) ����� used by all Black Sea cetacean species, including harbour porpoises which are present also in the Northern Aegean Sea.
10.5.3. The IUCN status
In 1996, Black Sea population of the harbour porpoise was included as ���œVulnerable���� (VU) in the IUCN Red List of Threatened Animals. The conservation status of Black Sea common dolphins and bottlenose dolphins is not evaluated by IUCN up to now, although global status, assigned to D. delphis and T. truncatus, is ���œLeast Concern���� (LC) and ���œData Deficient���� (DD), correspondingly.[2] At the same time, all three Black Sea cetacean populations are supported by the IUCN 2002-2010 Conservation Action Plan for the World's Cetaceans (Reeves et al., 2003).
The 3rd Meeting of the ACCOBAMS Scientific Committee (Cairo, 2005) encouraged the initiative proposed by the Cetacean Specialist Group of the IUCN Species Survival Commission (IUCN/SSC/CSG) concerning the development of the IUCN Red List of Mediterranean and Black Sea cetaceans. As a result, the IUCN/ACCOBAMS Workshop on the Red List Assessment of Cetaceans in the ACCOBAMS Area (Monaco, March 2006) assessed the conservation status of Black Sea populations of the harbour porpoise, common dolphin and bottlenose dolphin as ���œEndangered���� (EN) and confirmed their belonging to the Black Sea subspecies P. p. relicta Abel, 1905; D. d. ponticus Barabasch-Nikiforov, 1935; and T. t. ponticus Barabasch, 1940 (Reeves and Notarbartolo di Sciara, 2006). According to the IUCN Red List procedure, these assessments should be further reviewed by independent evaluators from IUCN/SSC/CSG and then submitted to IUCN/SSC for final consideration. Therefore, it may be expected that the new IUCN status of Black Sea cetaceans will be established in 2010. As interim measure, the results of the IUCN/ACCOBAMS Red List assessment of cetaceans in the Mediterranean and Black Seas (2006) were adopted by special resolution of the 3rd Meeting of Parties to ACCOBAMS (Dubrovnik, Croatia, 2007).����
10.5.4. Conservation plan for Black Sea cetaceans
The development of regional activities on cetacean research, monitoring and conservation demands to be well-designed and coordinated. The regional Conservation Plan for Black Sea Cetaceans (Birkun et al., 2006a) has been drafted in accordance with the ACCOBAMS International Implementation Priorities for 2002-2006 (Notarbartolo di Sciara, 2002). This plan was considered and supported by participants of the Round Table on Conservation of Black Sea Cetaceans conducted within the 1st Scientific Conference of the Black Sea Commission (Istanbul, May 2006). The contracting parties to the ACCOBAMS had approved this plan at their 3rd Meeting (Dubrovnik, Croatia, 2007).
The Conservation Plan for Black Sea Cetaceans
is prepared based on a strategy designed by ACCOBAMS and reflected in its Annex 2, the Conservation Plan;
is intended to complement the existing ACCOBAMS Implementation Priorities for 2002-2006, and Priority #6 in the first place, addressing cetacean conservation, management and research in the Black Sea. It is fully corresponds to the ACCOBAMS Working Programme 2005-2007, Resolutions of the 1st and 2nd Meetings of the Paties to ACCOBAMS, Recommendations and decisions of the 1st, 2nd and 3rd Meetings of the ACCOBAMS Scientific Committee;
is aimed to facilitate the co-operation among Black Sea riparian states and enhance their abilities essential for the conservation of cetaceans and their habitats;
envisages common mechanisms aimed to promote cetacean conservation and research actions, as well as capacity building, education and public awareness in the Black Sea subregion under the co-ordination role of ACCOBAMS institutions including the Meeting of the Parties, Permanent Secretariat, Bureau, Scientific Committee and, last but not least, Black Sea Co-ordination Unit represented by the Permanent Secretariat of the Commission on the Protection of the Black Sea Against Pollution (the Black Sea Commission);
expects that it will be adopted and promoted by all Black Sea countries, including those which are still not the Parties of ACCOBAMS, regardless of existing national differences in the available expertise, level of organization, scientific backgrounds and logistical constraints among areas;
expects also that its implementation will derive adequate support from national, regional, European and global agencies, intended for nature protection and sustainable development, and thus, will be provided with various sources to fund collaborative projects focused on the Black Sea cetaceans conservation.
The principal goals of this plan are to provide a framework and priority actions whereby the Black Sea Community (scientists, fishermen, industry, NGOs, local and national governments, and appropriate intergovernmental organizations) can in the short-term (2006-2010) begin to practically improve the conservation status of Black Sea cetaceans, and in particular obtain the necessary scientific information to allow a full long-term conservation plan to be developed at the end of the period and effective management decisions to be made.
The principal objectives of the Conservation Plan for Black Sea Cetaceans wholly correspond with appropriate items of the ACCOBAMS Conservation Plan:
consolidation of international and national legal system (Actions 1-4);
assessment and management of human-cetacean interactions (Actions 5-10);
habitat protection (Actions 11 and 12);
research and monitoring (Actions 13-15);
capacity building, collection and dissemination of information, training and education (Actions 16 and 17); and
responses to emergency situations (Action 18).
All 18 actions proposed are important for the conservation of Black Sea cetaceans (Appendix B). The order of the actions follows above objectives (i.e. corresponds to a format of the ACCOBAMS Conservation Plan) and their numbering does not indicate priorities. These actions consist of 57 smaller actions or sub-actions (activities) which were prioritized according their significance (primary and secondary) in the relation to each other ����� some actions are clearly more urgent or definitely propaedeutic to others (Appendix C). Besides, some actions are already on the way of their implementation and that is also underlined in the descriptions. They are interactive between the various categories of actions and the actions within categories. In particular, the Research and Monitoring section is absolutely crucial to provide the necessary background to almost all of the other groups of actions. In its turn, the Basic Cetacean Surveys action is the most important within the Research and Monitoring category.
The implementation of the Conservation Plan for Black Sea Cetaceans is estimated for a five-year period since the plan is approved by the Black Sea states. This term seems to be realistic under the stipulation that proper planning, coordination and monitoring of the actions proposed is established and adequate methodological, financial and logistical support is provided. This, hopefully, can be ensured under auspices and supervision of the ACCOBAMS, Black Sea Commission and their institutions. Establishing a coordinator position could be helpful for the success of this plan. It may be expected that the plan will serve as a suitable tool for transboundary conservation and management of Black Sea cetacean populations, with an ultimate aim to ensure their survival and welfare in the nearest and remote future.��
10.6. Conclusions
This chapter has briefly described the conservation status of Black Sea cetaceans with clear emphasis on specific activities which were launched, declared or drafted on the national, regional and international levels during last decade. Most these activities require more efficient management procedures established on regular basis within a framework of existing legal and institutional arrangements including such important multilateral instruments like the ACCOBAMS and the Bucharest Convention on the Protection of the Black Sea against Pollution, with particular regard to the observance of the Black Sea Biodiversity and Landscape Conservation Protocol.
To further improve the transboundary management of cetaceans-related protection issues, the Conservation Plan for Black Sea Cetaceans was prepared in 2006 by international team of experts acted under the auspices of the ACCOBAMS����� and Black Sea Commission�����s permanent secretariats. This plan reveals major gaps in the knowledge concerning the populations of Black Sea dolphins and porpoises (e.g., a lack of solid data on the abundance, population structure and threats), sets up relevant regional strategies, and recommends concrete research and conservation actions to fill up the gaps. It is anticipated that correct and concerted implementation of the plan by Black Sea riparian countries improves the conservation status of Black Sea cetaceans to substantial extent during next five years under the stipulation that adequate methodological, financial and logistical support is provided.
Four Black Sea states (Bulgaria, Georgia, Romania and Ukraine), being the contracting parties to ACCOBAMS, are already on the way to put into practice the Conservation Plan owing to the fact that it was approved recently by the 3rd�� Meeting of the Parties to ACCOBAMS (Dubrovnik, Croatia, 2007). Two other Black Sea countries (the Russian Federation and Turkey) have the opportunity to join to implementation of the plan by force of signing the Strategic Action Programme on the Protection and Rehabilitation of the Black Sea. This new instrument of Black Sea regional importance, drafted by the Black Sea Commission, envisages the ad hoc management target on the adoption of the Conservation Plan for Black Sea Cetaceans by the six Black Sea countries without exception.
References
ACCOBAMS/SC. (2005) Report of the 3rd Meeting of the Scientific Committee (Cairo, 15-17 May 2005). ACCOBAMS, 28pp. (unpublished).
Amaha, A. (1994) Geographic variation of the common dolphin, Delphinus delphis (Odontoceti, Delphinidae). PhD thesis, Tokyo University of Fisheries, 211pp.
Amaha, A., Yel, M., ���zdamar, E., Miyazaki, N. (1996) On the cranial morphology of�� Delphinus in the Black Sea. In: B. ���zt��rk (Ed.), Proceedings of the First International Symposium on the Marine Mammals of the Black Sea , pp. 73-74, Istanbul, Turkey, 27-30 Jun 1994. ACAR Matbaacilik A.Ş., Istanbul, 120pp.
Barabasch, I.I. (1935) Delphinus delphis ponticus subsp. n. Bull. Moskovskogo Obshchestva Ispytateley Prirody (Biol. Div.), 44 (5), 246-2410 (in Russian).
Barabasch-Nikiforov, I.I. (1960) Measurements and coloration of bottlenose dolphins (Tursiops truncatus Montagu) as the criterion for their subspecies differentiation. Nauch. Dokl. Vys. Shkoly, Biol. Sci., N1, 35-42, (in Russian).
Beaubrun, P.C. (1995) Atlas Pr��liminaire de Distribution des C��tac��s de M��diterran��e. CIESM & Mus��e Oc��anographique, Monaco, 87pp.
Bel�����kovich, V.M. (1996) The population structure of three species of Black Sea dolphins as an adequate basis of their abundance estimation. In: B. ���zt��rk (Ed.), Proceedings of the First International Symposium on the Marine Mammals of the Black Sea, 27-30 Jun 1994, Istanbul, Turkey. ACAR Matbaacilik A.Ş., Istanbul, 120pp.
Bel�����kovich, V.M. (2001). Orientation of Dolphins. Mechanisms and Models. Publ. House of the Bakulev Scientific Centre, Moscow, 240pp (in Russian).
Berkes, F. (1971) Turkish dolphin fisheries. Oryx, 14(2),163-1610.
Birkun A., Jr. (2002a) Direct killing and live capture: Black Sea. In: G. Notarbartolo di Sciara (Ed.), Cetaceans of the Mediterranean and Black Seas: State of knowledge and conservation strategies, pp.31-38, ACCOBAMS Secretariat, Monaco, 219pp.
Birkun, A., Jr. (2002b) Habitat loss and degradation: Black Sea. In: G. Notarbartolo di Sciara (Ed.), Cetaceans of the Mediterranean and Black Seas: State of knowledge and conservation strategies, pp. 60-77, ACCOBAMS Secretariat, Monaco, 219pp.
Birkun, A., Jr. (2002c) Interaction between cetaceans and fisheries: Black Sea. In: G. Notarbartolo di Sciara (Ed.), Cetaceans of the Mediterranean and Black Seas: State of knowledge and conservation strategies, pp. 98-107, ACCOBAMS Secretariat, Monaco, 219pp.
Birkun, A., Jr. (2002d) Disturbance: Black Sea. In: G. Notarbartolo di Sciara (Ed.), Cetaceans of the Mediterranean and Black Seas: State of knowledge and conservation strategies, pp. 161-166, ACCOBAMS Secretariat, Monaco, 219pp.
Birkun, A., Jr. (2002e) Natural mortality: Black Sea. In: G. Notarbartolo di Sciara (Ed.), Cetaceans of the Mediterranean and Black Seas: State of knowledge and conservation strategies, pp. 181-193, ACCOBAMS Secretariat, Monaco, 219pp.
Birkun, A., Jr. (2005) Bottom-set gillnet fisheries and harbour porpoises in the Black Sea: High-tech against cetaceans. FINS (the Newsletter of ACCOBAMS), 2(1), 10.
Birkun, A., Jr. (2006a) Cetaceans (Cetacea). In: Y.P. Zaitsev et al. (Eds.), The North-Western Black Sea: Biology and Ecology. Naukova Dumka, Kiev, 703pp (in Russian).
Birkun, A., Jr. (2006b) Consolidation of national network for ceaceans monitoring and conservation in Ukraine. FINS (the Newsletter of ACCOBAMS), 2(2), 14-110.
Birkun, A., Jr., Ca��adas, A., Donovan, G., Holcer, D., Lauriano, G., Notarbartolo di Sciara, G., Panigada, S., Radu, G., van Klaveren, M.-C. (2006a) Conservation Plan for Black Sea Cetaceans. ACCOBAMS, Agreement on the Conservation of Cetaceans of the Black Sea, Mediterranean Sea and Contiguous Atlantic Area. 49pp. (unpublished).
Birkun A., Jr., Glazov D., Krivokhizhin S., Mukhametov L. (2002) Distribution and abundance of cetaceans in the Sea of Azov and Kerch Strait: Results of aerial survey (July 2001). P.73 In: Abstr. 16th Annual Conf. of the European Cetacean Society (Liege, 7-11 April 2002),�� 86pp.
Birkun, A., Jr., Glazov, D., Krivokhizhin, S., Nazarenko, E., Mukhametov, L. (2003) Species composition and abundance estimates of cetaceans in the Kerch Strait and adjacent areas of the Black and Azov Seas: The second series of aerial surveys (August 2002). In: Abstr. 17th Annual Conf. of the European Cetacean Society, pp.271-272, Las Palmas de Gran Canaria, 9-13 March 2003, 285pp.
Birkun, A.A., Jr., Krivokhizhin, S.V. (1996) Mammals of the Black Sea. Tavria, Simferopol, 96pp (in Russian).
Birkun, A., Jr., Krivokhizhin, S. (1991) Sudden ice formation ����� a cause of harbour porpoise (Phocoena phocoena) mass mortalities in the Sea of Azov. In: P.G.H. Evans, E.C.M. Parsons, and S.L. Clark (Eds.), European research on cetaceans ����� 11. Proc. 11th Annual Conf. European Cetacean Society, Stralsund, Germany, 10-12 March 1997, Pp. 275-277,�� ECS, Kiel, 314pp.
Birkun, A.A., Jr., Krivokhizhin, S.V., Glazov, D.M., Shpak, O.V., Zanin, A.V., Mukhametov, L.M. (2004a) Abundance estimates of cetaceans in coastal waters of the northern Black Sea: Results of boat surveys in August-October 2003. In: Marine Mammals of the Holarctic: Collection of Scientific Papers after the 3rd Internat. Conf., pp.64-68, Koktebel, Ukraine, 11-17 October 2004, Moscow, 609pp.
Birkun, A.A., Jr.,�� Krivokhizhin, S.V., Gridin, V.Y.,�� Zhbanov, A.V., Zanin, A.V., Masberg, I.V. (2004b) Strandings of neonate Black Sea harbour porpoises (Phocoena phocoena) as a probable consequence of the nursing females����� death in fishing gear. In: Marine Mammals of the Holarctic: Collection of Scientific Papers after the 3rd Internat. Conf., pp. 59-64, Koktebel, Ukraine, 11-17 October 2004, Moscow, 609pp.
Birkun, A., Jr.,�� Krivokhizhin, S., Komakhidze, A.,�� Mukhametov, L., Shpak, O., Goradze, I., Komakhidze, G., Kryukova A. (2006b) Wintering concentration of Black Sea cetaceans off the Crimean and Caucasian coasts. P.203 In: Abstr. 20th Annual Conf. of the European Cetacean Society (Gdynia, 2-7 April 2006). ECS, Gdynia, 244pp.
Birkun, A., Krivokhizhin, S., Kosova, K. (2004c) Bottlenose dolphin (Tursiops truncatus) became prevalent cetacean species in Black Sea coastal waters off the Crimea. P. 409 In: P.G.H. Evans and E. O�����Boyle (Eds.), European research on cetaceans ����� 15 (Proc. 15th Annual Conf. European Cetacean Society, Rome, Italy, 6-10 May 2001). ECS, Kiel, 478pp.
Birkun, A., Jr., Krivokhizhin, S., Pavlov, V. (1997) New data on the existence of bottlenose dolphins in the Sea of Azov. In: P.G.H. Evans (Ed.), European Research on Cetaceans ����� 10. Proc. 10th Annual Conf. European Cetacean Society, pp.200-203, Lisbon, Portugal, 11-13 Mar 1996. ECS, Kiel, 334pp.
Birkun, A., Jr., Kuiken, T., Krivokhizhin, S., Haines, D.M., Osterhaus, A.D.M.E., van de Bildt, M.W., Joiris, C.R., Siebert, U. (1991) Epizootic of morbilliviral disease in common dolphins (Delphinus delphis ponticus) from the Black Sea. Vet. Rec., 144(4), 85-92.
Birkun A., Jr., Nikitina V., Krivokhizhin S., Demchenko V., Davidyuk, E. (1993) Organochlorine pesticides in the blubber of Black Sea cetaceans. Veterinaria (Moscow), N6, 50-52 (in Russian).
BLASDOL. (1991) Estimation of human impact on small cetaceans of the Black Sea and elaboration of appropriate conservation measures: Final report for EC Inco-Copernicus (contract No. ERBIC15CT960104). C.R. Joiris (Coord.), Free University of Brussels, Belgium; BREMA Laboratory, Ukraine; Justus Liebig University of Giessen, Germany; Institute of Fisheries, Bulgaria; and Institute of Marine Ecology and Fisheries, Georgia. Brussels, 113pp.
Buckland, S.T., Anderson, D.R., Burham, K.P., Laake, J.L. (1993) Distance sampling: Estimating abundance of biological populations. Chapman and Hall, New York�����London, 446pp.
Buckland, S.T., Smith, T.D., Cattanach, K.L. (1992) Status of small cetacean populations in the Black Sea: Review of current information and suggestions for future research. Rep. int. Whal. Commn, 42, 513-516.
Bushuyev, S.G. (2000) Depletion of forage reserve as a factor limiting population size of Black Sea dolphins. In: Ecological Safety of Coastal and Shelf Areas and a Composite Utilization of Shelf Resources. Proc. Marine Hydrophysical Institute, Sevastopol, pp.437-452, (in Russian).
Bushuyev, S.G., Savusin, V.P. (2004) Observations of dolphins from fishing boats in the course of sprat trawling in the northwestern Black Sea. In: Marine Mammals of the Holarctic: Collection of Scientific Papers after the 3rd Internat. Conf., pp. 113-116, Koktebel, Ukraine, 11-17 October 2004. Moscow, 609pp.
���elikkale, M.S., Kara��am, H., D��zg��nes, E., �œnsal, S. and Durukanoglu, H.F. (1981) Size and distribution of dolphin populations in the Black Sea. Doga Turk. Zool. Derg., 13(3), 189-96 (in Turkish).
Danilevsky, N.N., Tyutyunnikov, V.P. (1961) Some data on the current state of dolphins stock in the Black Sea. Rybnoye Khozyaystvo, N11, 25-210 (in Russian).
Das, K., Holsbeek, L., Browning, J., Siebert, U., Birkun, A., Jr., Bouquegneau, J.-M. (2004) Trace metal and stable isotope measurements (d13C and d15N) in the harbour porpoise Phocoena phocoena relicta from the Black Sea. Environmental Pollution, 131, 197-204.
Fontaine, M.C., Tolley, K.A., Ridoux, V., Jauniaux, T., Sequeira, M., Addink, M., Smeenk, C., Siebert, U., Birkun, A., L��pez, A., Bouquegneau, J.M., Michaux, J.R. (2005) Phylogeography of harbour porpoise (Phocoena phocoena) in the southeastern North Atlantic and in the Black Sea explored by the analyses of nuclear and mitochondrial DNA. P.26 In: Abstr. 19th Annual Conf. of the European Cetacean Society (La Rochelle, 2-7 April 2005), 130pp.
Frantzis, A., Alexiadou, P., Paximadis, G., Politi, E., Gannier, A., Corsini-Foka, M. (2003) Current knowledge of the cetacean fauna of the Greek seas. J. Cetacean Res. Manage., 5(3), 219-232.
Frantzis, A., Gordon, J., Hassidis, G., Komnenou, A. (2001) The enigma of harbor porpoise presence in the Mediterranean Sea. Mar. Mammal Sci., 17(4), 937-943.
Geptner, V.G., Chapsky, K.K., Arsenyev, V.A., Sokolov, V.E. (1976) Mammals of the Soviet Union. Volume 2, Part 3: Pinnipeds and Toothed Whales. Vysshaya Shkola, Moscow, 718pp (in Russian).
Glazov, D.M, Zhulidov, A.V. (2001) Heavy metals, methyl-mercury and selenium in organs and tissues of two species of Black Sea dolphins (Tursiops truncatus, Phocoena phocoena). In: Abstr. 14th Bien. Conf. on Biology of Marine Mammals, pp. 83-84, Vancouver, Canada, 28 November - 3 December 2001.
G����l��soy, H., Kıra��, C.O., Veryeri, N.O., Savaş, Y. (2004) Status of the Mediterranean monk seal, Monachus monachus (Hermann, 1779), in the coastal waters of Turkey. E.U. Journal of Fisheries and Aquatic Sciences, 21(3-4), 201-210.
Hoyt, E. (2005) Marine Protected Areas for Whales, Dolphins and Porpoises: A World Handbook for Cetacean Habitat Conservation. Earthscan, London and Sterling, 492pp.
IWC. (1983) Report of the Sub-Committee on Small Cetaceans. Rep. Int. Whal. Commn., 33,152-170.
IWC. (1992) Report of the Sub-Committee on Small Cetaceans. Rep. Int. Whal. Commn., 42,178-234.
IWC. (2004) Report of the Sub-Committee on Small Cetaceans. J. Cetacean Res. Manage. 6(Suppl.), 315-334.
Joiris, C.R., Holsbeek, L., Bolba, D., Gascard, C., Stanev, T., Komakhidze, A., Baumg��rtner, W., Birkun, A. (2001) Total and organic mercury in the Black Sea harbour porpoise Phocoena phocoena relicta. Mar. Pollut. Bull., 42(10), 905-911.
Kıra��, C., Savaş, Y. (1996) Status of the monk seal (Monachus monachus) in the neighbourhood of Ereğli, Black Sea coast of Turkey. Zoology in the Middle East (Mammalia), 12, 5-12.
Kleinenberg, S.E. (1936) The data on studying the nutrition of dolphins of the Black Sea. Bull. Moskovskogo Obshchestva Ispytateley Prirody (Biol. Div.), 45(5), 338-3410 (in Russian).
Kleinenberg, S.E. (19569 Mammals of the Black and Azov Seas: Research Experience for Biology and Hunting. USSR Acad. Science Publ. House, Moscow, 288pp (in Russian).
Kleinenberg, S.E., Klevezal����� G.A. (1962) On the method of determining the age of toothed whales. Doklady AN SSSR, 145(2): 460-462 (in Russian).
Klinowska, M. (1991) Dolphins, Porpoises and Whales of the World. The IUCN Red Data Book. IUCN, Gland and Cambridge, 429pp.
Krivokhizhin, S.V., Birkun, A.A., Jr. (1991) Strandings of cetaceans along the coasts of Crimean peninsula in 1989-1996. In: P.G.H. Evans and E.C.M. Parsons (Eds.), European Research on Cetaceans ����� 12. Proc. 12th Annual Conf. European Cetacean Society, pp.59-62, Monaco, 20-24 Jan 1998. ECS, Valencia, 436pp.
Krivokhizhin, S.V., Birkun, A.A., Jr., Nessonova, J.V. (2000) Prey species of Black Sea cetaceans. P. 229 In: P.G.H. Evans, R. Pitt-Aiken and E. Rogan (Eds.), European research on cetaceans ����� 14 (Proc. 14th Annual Conf. European Cetacean Society, Cork, Ireland, 2-5 April 2000). ECS, Rome, 400pp.
Krivokhizhin, S., Birkun, A., Jr., Shpak, O., Mukhametov, L. (2006) ���œOffshore���� harbour porpoises in the central Black Sea. P.210 In: Abstr. 20th Annual Conf. of the European Cetacean Society (Gdynia, 2-7 April 2006). ECS, Gdynia, 244pp.
Madhusree, B., Tanabe, S., ���zt��rk, A.A., Tatsukawa, R., Miyazaki, N., ���zdamar, E., Aral, O., Samsun, O., ���zt��rk, B. (1991) Contamination by butyltin compounds in harbour porpoise (Phocoena phocoena) from the Black Sea. Fresenius J. Anal. Chem., 359: 244-2410.
Malm, E.N. (933)Dolphins of the Black Sea. Priroda (Nature), N2:31-310 (in Russian).
Malm, E.N. (131) ketches on biology of Black Sea dolphins. Priroda (Nature), №5: 55-71 (in Russian).
Meyer, A. (1794) Description of the Ochakov Lands. St. Peterburg. [Cited after: Kleinenberg, 1956] (in Russian).
Mikhalev, Y.A. (1996) Experience of the abundance estimation of the Black Sea dolphins based on the aerial survey. In: B. ���zt��rk (Ed.), Proceedings of the First International Symposium on the Marine Mammals of the Black Sea, pp. 77-78, Istanbul, Turkey, 27-30 June 1994, Istanbul, 120pp.
Mikhalev, Y.A. (2004a) The Black Sea bottlenose dolphin (Tursiops truncatus Montagu, 1821) distribution pattern according to aerial survey data. In: Marine Mammals of the Holarctic: Collection of Scientific Papers after the 3rd Internat. Conf., Pp. 397-402, Koktebel, Ukraine, 11-17 October 2004. Moscow, 609pp.
Mikhalev, Y.A. (2004b) Distribution peculiarities of harbour porpoises (Phocoena phocoena relicta Abel, 1905) in the Black Sea. In: Marine Mammals of the Holarctic: Collection of Scientific Papers after the 3rd Internat. Conf., pp. 403-407, Koktebel, Ukraine, 11-17 October 2004. Moscow, 609pp.
Mikhalev, Y.A., Savusin, V.P.,�� Bushuyev, S.G. (2004) Associated connection between the accumulations of fishes and dolphins in the Black Sea according to the data of aerial surveys. In: Marine Mammals of the Holarctic: Collection of Scientific Papers after the 3rd Internat. Conf., pp. 393-397,�� Koktebel, Ukraine, 11-17 October 2004. Moscow, 609pp.
Mikhalev, Y.A., Savusin, V.P., Zelyonaya, F.E. (1971) On the numbers of Black Sea dolphins. In:�� Marine Mammals (Proc. 7th All-Union Conf. on Research, Conservation and Rational Use of Marine Mammals, pp. 226-227, Moscow, 1978 (in Russian).
M��ller, G., W��nschmann, A., Baumg��rtner, W., Birkun, A., Komakhidze, A., Stanev, T., Joiris, C.R. (2002) Immunohistological and serological investigations of morbillivirus infection in Black Sea harbour porpoises (Phocoena phocoena). Vet. Microbiol., 87(2): 183-190.
Natoli, A. (2004) Molecular ecology of bottlenose (Tursiops sp.) and common (Delphinus sp.) dolphins. PhD thesis, University of Durham, UK.
Natoli, A., Birkun, A., Aguilar, A., Lopez, A., Hoezel, A.R. (2005) Habitat structure and dispersal of male and female bottlenose dolphins (Tursiops truncatus). Proc. R. Soc. B, 272: 1217-1226.
Notarbartolo di Sciara, G. (2002) International Implementation Priorities for 2002-2006. In: Proc. 1st Session of the Meeting of the Parties to ACCOBAMS, pp.51-62, Monaco, 28 February ����� 2 March 2002. ACCOBAMS Permanent Secretariat, Monaco, 124pp.
Notarbartolo di Sciara, G., Birkun, A., Jr. (2002) Conservation needs and strategies. In: G. Notarbartolo di Sciara (Ed.), Cetaceans of the Mediterranean and Black Seas: State of knowledge and conservation strategies, pp. 197-214, ACCOBAMS Secretariat, Monaco, 219pp.
Ozharovskaya, L.V. (1991) Reproduction of the Black Sea bottlenose dolphin. In: V.E. Sokolov and E.V. Romanenko (Eds.), The Black Sea Bottlenose Dolphin Tursiops truncatus ponticus: Morphology, Physiology, Acoustics, Hydrodynamics, pp.114-45,�� Nauka, Moscow, 672pp (in Russian).
���zt��rk, B. (1992) The Mediterranean Monk Seal Monachus monachus. Anahtar Kitaplar Yayınevi, Istanbul, 215pp (in Turkish).
���zt��rk, B., (1996) Past, present and future of the Mediterranean monk seal, Monachus monachus (Hermann, 1779) in the Black Sea. In: B. ���zt��rk (Ed.), Proceedings of the First International Symposium on the Marine Mammals of the Black Sea, pp. 96-101, Istanbul, Turkey, 27-30 June 1994. ACAR Matbaacilik A.Ş., Istanbul, 120pp.
���zt��rk, B. (Comp.) (1991) Black Sea Biological Diversity: Turkey. UN Publ., New York, 144pp.
���zt��rk, B., ���zt��rk, A.A. (1991) Preliminary study on dolphin occurrence in Turkish straits system. In: P.G.H. Evans, E.C.M. Parsons and S.L. Clark (Eds.), European research on cetaceans ����� 11. Proc. 11th Annual Conf. European Cetacean Society, pp. 79-82, Stralsund, Germany, 10-12 March 1997. ECS, Kiel, 314pp.
Perrin, W.F., Reilly, S.B. (1984) Reproductive parameters of dolphins and small whales of the family Delphinidae. Rep. Int. Whal. Commn., Sp. Issue 6: 97-133.
Prodanov, K., Mikhailov, K., Daskalov, G., Maxim, C., Chashchin, A., Arkhipov, A., Shlyakhov, V., Ozdamar, E. (1991) Environmental management of fish resources in the Black Sea and their rational exploitation. General Fisheries Council for the Mediterranean, Studies and Reviews, No. 68, FAO, Rome, 178pp.
Read, A.J. (1991) Harbour porpoise Phocoena phocoena (Linnaeus, 1758). In: S.H. Ridgway and R. Harrison (Eds.), Handbook of marine mammals. Vol. 6, 323-355,Academic Press, San Diego.
Reeves, R.R., Notarbartolo di Sciara, G. (2006) Report of the Red List Workshop on Black Sea and Mediterranean Sea Cetaceans (Monaco, 5-7 March 2006) (in press).
Reeves, R.R., Smith, B.D., Crespo, E., Notarbartolo di Sciara, G. (2003) Dolphins, Whales, and Porpoises: 2000-2010 Conservation Action Plan for the World's Cetaceans. IUCN, Gland, Switzerland, 139pp.
Rosel, P.E., Dizon, A.E., Haygood, M.G. (1995) Variability of the mitochondrial control region in populations of the harbour porpoise, Phocoena phocoena, on interoceanic and regional scales. Can. J. Fish. Aquat. Sci., 52(6): 1210-12110.
Rosel, P.E., Frantzis, A., Lockyer, C., Komnenou, A. (2003) Source of Aegean Sea harbour porpoises. Mar. Ecol. Prog. Ser., 247: 257-261.
Sal�����nikov, N.E. (1961) Cetaceans (Сetacea). In: K.A. Vinogradov (Ed.), Biology of the Northwest Part of the Black Sea, pp.235-240, Naukova Dumka, Kiev, 268pp (in Russian).
Silantyev, A.A. (1903) Black Sea Coast of the Caucasus in Agricultural and Commercial Respects. Issue 1. Dolphins Fishery off the Caucasian Coasts. Department of Agriculture, St. Peterburg, 61pp (in Russian).
Smith, T.D. (1982) Current understanding of the status of the porpoise populations in the Black Sea. Mammals in the Seas, Vol. 4, FAO Fisheries Series, 5(4): 121-130.
Sokolov, V.E. (1991) Overview of research on the Black Sea bottlenose dolphin. In: V.E. Sokolov and E.V. Romanenko (Eds.), The Black Sea Bottlenose Dolphin Tursiops truncatus ponticus: Morphology, Physiology, Acoustics, Hydrodynamics, pp.9-18, Nauka, Moscow, 672pp (in Russian).
Sokolov, V.E., Yaskin, V.A., Yukhov, V.L. (1990) Distribution and numbers of Black Sea dolphins. In: Proc. 5th Congr. of All-Union Teriological Soc., (Moscow, 1990), Vol. 3, 178-179�� (in Russian).
Tanabe, S., Madhusree, B., ���zt��rk, A.A., Tatsukawa, R., Miyazaki, N., ���zdamar, E., Aral, O., Samsun, O., ���zt��rk, B. (1997a) Persistent organochlorine residues in harbour porpoise (Phocoena phocoena) from the Black Sea. Mar. Pollut. Bull., 34(5): 338-3410.
Tanabe, S., Madhusree, B., ���zt��rk, A.A., Tatsukawa, R., Miyazaki, N., ���zdamar, E., Aral, O., Samsun, O., ���zt��rk, B. (1997b) Isomer-specific analysis of polychlorinated biphenyls in harbour porpoise (Phocoena phocoena) from the Black Sea. Mar. Pollut. Bull., 34(9): 712-720.
Tarasevich, M.N. (1951) Nutrition of the common dolphin in the Black Sea during warm period. VNIRO Collected Articles, №3. [Cited after: Geptner et al., 1976] (in Russian).
Tomilin, A.G. (1951) Mammals of the USSR and Adjacent Countries. Vol. IV. Cetaceans. USSR Acad. Science Publ. House, Moscow, 717pp (in Russian).
Tonay, M.A., ���z, M.I. (1991) Stomach contents of harbour porpoises entangled in the fishing nets in the western Black Sea. In: Proc. Annual Conf. on Underwater Science and Technology (SBT�����99 9, Turkey, 1999, pp. 92-98,�� (in Turkish).
Tzalkin, V.I. (1931) On the distribution of the common dolphin (D. delphis L.) in the Black Sea. Doklady AN SSSR (Reports of the USSR Academy of Science), 16(2): 133-135.�� (in Russian).
Tzalkin, V.I. (1931) Morphological characteristics, systematical status and zoogeographic significance of the harbour porpoise from the Azov and Black Seas. Zoologichesky Zhurnal, 17(4):706-733 (in Russian).
Tzalkin, V.I. (1940a) The data on biology of the Azov and Black Sea harbour porpoise (Phocaena phocaena relicta Abel). Zoologichesky Zhurnal, 19(1): 160-171 (in Russian).
Tzalkin, V.I. (1940b) Certain observations on biology of Azov and Black Sea dolphins. Bull. Moskovskogo Obshchestva Ispytateley Prirody (Biol. Div.), 49(1): 61-70 (in Russian).
Veit, F., Bojanowski, E., Todt, D., Zilber, R., Supin, A.Y., Mukhametov, L.M. (1991) Back to the Black: Release of a male bottlenose dolphin into the Black Sea after six years in a semi-free enclosure on the Red Sea. In: P.G.H. Evans, E.C.M. Parsons and S.L. Clark (Eds.), European Research on Cetaceans ����� 11.�� Proc. 11th Annual Conf. European Cetacean Society, pp.72-75. Stralsund, Germany, 10-12 March 1997. ECS, Kiel, 314pp.
Yaskin, V.A., Yukhov, V.L. (1991) The numbers and distribution of Black Sea bottlenose dolphins. In: V.E. Sokolov and E.V. Romanenko (Eds.), The Black Sea Bottlenose Dolphin Tursiops truncatus ponticus: Morphology, Physiology, Acoustics, Hydrodynamics, pp. 19-26, Nauka, Moscow, 672pp (in Russian).
Yukhov, V.L., Petukhov, A.G., Korkhov, A.I. (1986) Estimation of the abundance of Black Sea dolphins. Biologia Morya (Biology of the Sea), N6:64-610 (in Russian).
Zaitsev, Y., Mamaev, V. (1991) Marine Biological Diversity in the Black Sea: A Study of Change and Decline. United Nations Publ., New-York, 208 p.
Zatevakhin, I.I., Bel�����kovich, V.M. (1996) The structure of the society of bottlenose dolphins of the Tarkhankut peninsula. In: B. ���zt��rk (Ed.), Proceedings of the First International Symposium on the Marine Mammals of the Black Sea, pp.72, Istanbul, Turkey, 27-30 Jun 1994. Istanbul, 120pp.
Zemsky, V.A. (1996) History of the Russian fishery of dolphins in the Black Sea. In: B. ���zt��rk (Ed.), Proceedings of the First International Symposium on the Marine Mammals of the Black Sea, pp.46-48, Istanbul, Turkey, 27-30 June 1994. ACAR Matbaacilik A.Ş., Istanbul, 120pp.
Zemsky, V.A., Yablokov, A.V. (1974) Catch statistics, short history of exploitation and present status of Delphinus delphis, Tursiops truncatus and Phocoena phocoena in the Black Sea. FAO/ACMRR Group II Meeting (La Jolla, USA, 16-19 December 1974).
Appendix A. ��Examples of cetacean research and conservation projects implemented in the Black Sea region in 2002�����2006
| Programme / Initiative | Project (title) | Implementing organizations | Year |
| Programme for Research, Conservation and Restoration of Marine Mammals in the Black and Azov Seas (���˜Delfin�����-program approved by the Ministry of Ecology and Natural Resources of Ukraine,��in August 1999) | Pathological conditions of Black Sea common dolphins | Brema Laboratory (Ukraine) | 2001-2002 |
| Infectious diseases in captive Black Sea bottlenose dolphins | Brema Laboratory (Ukraine) | 2001-2002 | |
| Workshop on conservation problems of Black Sea cetacean populations (Koktebel, 23-24 October 2002) | Brema Laboratory in co-operation with Crimean dolphinaria (Ukraine) | 2002 | |
| Preparation of three issues of the ���˜Black Sea Cetaceans����� Information Base (CD-ROM) | Brema Laboratory (Ukraine) | 2002, 2003, 2004 | |
| Bacteriological aspect of Black Sea bottlenose dolphins adaptation to captivity | Brema Laboratory (Ukraine) | 2002 | |
| Feeding objects of Black Sea cetaceans and state of their forage reserves | Brema Laboratory (Ukraine) | 2002 | |
| Development of national network for the monitoring of Black Sea cetacean strandings and bycatches, formation of a system aimed to render assistance to sick and traumatized cetaceans in Ukraine, conversion of dolphinaria into centres for rescue and rehabilitation of marine mammals (MORECET) | Brema Laboratory, Biological Station PE, Livadia Dolphinarium JE,�� Karadag Nature Reserve and Nazareth Ltd (Ukraine) | 2002-2006 | |
| Pathological conditions of wild Black Sea harbour porpoises | Brema Laboratory (Ukraine) | 2003 | |
| Preparation of draft regulations on conservation-related activities of dolphinaria | Brema Laboratory (Ukraine) | 2003 | |
| Assessment of the state of Black/Azov Sea marine mammal populations listed in the Red Data Book | Brema Laboratory in co-operation with the Ukrainian Danube Delta Biosphere Reserve, Odessa Center of the Southern Research Institute of Marine Fisheries and Oceanography, Odessa Branch of the Institute of Biology of Southern Seas, Chornomorsky [Black Sea] Biosphere Reserve, Lebedyni Ostrovy [Swan Islands] Branch of the Crimean Nature Reserve, Cape Martyan Nature Reserve, Karadag Nature Reserve, Opuk Nature Reserve and Kazantip Nature Reserve (Ukraine). | 2003 | |
| Workshop on conservation problems of Black Sea cetacean populations (Kiev, 25 May 2004) | Ministry of Environment of Ukraine in co-operation with members of national network for monitoring of cetaceans (Ukraine) | 2004 | |
| EU�� LIFE-NATURE Program | Conservation of the dolphins from the Romanian Black Sea waters | Grigore Antipa National Institute for Marine Research and Development, Mare Nostrum NGO, Museum Complex for Nature Sciences in Constantsa (Romania) | 2001-2004 |
| Joint initiative supported by the ACCOBAMS Secretariat | Genetic study of Black Sea bottlenose dolphins�� | University of Durham (UK) in co-operation with Brema Laboratory (Ukraine) | 2002 |
| Joint initiatives supported by the Ministry of Environmental Protection of Ukraine and Russian Academy of Science�� | Aerial survey of distribution, abundance and species composition of cetaceans in the Azov Sea (Azovka-2001). | Brema Laboratory (Ukraine) and Institute of Ecology and Evolution (Russia) | 2001-2002 |
| Aerial survey of distribution, abundance and species composition of cetaceans in the Russian and Ukrainian waters of the Black and Azov Seas (Azovka-2002) | Brema Laboratory (Ukraine) and Institute of Ecology and Evolution (Russia) | 2002-2003 | |
| Study of accumulations, migrations and habitats of the Black Sea bottlenose dolphin in coastal waters of Russia and Ukraine (Afalina-2003) | Institute of Ecology and Evolution (Russia), Brema Laboratory and Karadag Nature Reserve (Ukraine) | 2003-2004 | |
| Distribution, abundance and photo-identification of cetaceans in the northwestern shelf waters of the Black Sea (Afalina-2004) | Institute of Ecology and Evolution (Russia), Brema Laboratory and Karadag Nature Reserve (Ukraine) | 2004-2005 | |
| Distribution and abundance of cetaceans in offshore waters of the central Black Sea (Belobochka-2005) | Brema Laboratory (Ukraine) and Institute of Ecology and Evolution (Russia) | 2005 | |
| Joint Georgian, Ukrainian and Russian initiative | Assessment of cetacean distribution and abundance in coastal waters of the southeastern Black Sea (Afalina-2005) | Brema Laboratory (Ukraine), Marine Ecology and Fisheries Research Institute (Georgia) and Institute of Ecology and Evolution (Russia) | 2005 |
| EUROPHLUKES�������� | Photo-identification of Black Sea cetaceans (Black Sea Fins)������ | Brema Laboratory (Ukraine) and Institute of Ecology and Evolution (Russia) with initiating support derived from the Permanent Secretariat of ACCOBAMS, and the training provided by Tethys Research Institute (Italy) | 2003-2004 |
| Small Environmental Projects Scheme (SEPS II) supported by the UK's Department for Environment, Food and Rural Affairs and managed by the British Council�����Ukraine | Improvement of the Ukrainian National Network for Cetaceans Monitoring and Conservation (NNCC-project) | Brema Laboratory in partnership with the Ukrainian Danube Delta Biosphere Reserve, Odessa Center of the Southern Research Institute of Marine Fisheries and Oceanography, Odessa Branch of the Institute of Biology of Southern Seas, Chornomorsky [Black Sea] Biosphere Reserve, ���˜Oasis����� NGO, Cape Martyan Nature Reserve, and Karadag Nature Reserve (Ukraine) | 2004-2005 |
Appendix B. Conservation Plan for Black Sea Cetaceans: aims of actions proposed
| Actions | Aims | |
| 1 | Broadening the ACCOBAMS scope | Achieve that all six Black Sea riparian states are the Contracting Parties to ACCOBAMS; disseminate the ACCOBAMS process in the countries which have indirect outlet to the Black Sea through the rivers and exert their influence on the Black Sea environment and biota (including cetaceans) by means of fluvial discharges and marine-riverine traffic. |
| 2 | Proper conservation status of cetacean populations | Ensure that Black Sea cetacean species ����� the harbour porpoise, the short-beaked common dolphin and the common bottlenose dolphin ����� are properly classified in the international documents aimed to protect the Black Sea environment, ecosystems, living resources and biodiversity. |
| 3 | Cetacean conservation approach in fishery regulations | Ensure that Black Sea intergovernmental agreements and national regulations, purposed to manage Black Sea living resources and their exploitation, include items concerned in the conservation of cetaceans |
| 4 | Improvement and harmonization of national legislation | Ensure that in the Black Sea states their laws intended to regulate conservation activities, sustainable use and management of marine environment and resources are brought in accordance with international legislation standards related to cetacean conservation. |
| 5 | Retrospective analysis of human-induced cetacean mortality | Investigate the feasibility of obtaining meaningful estimates of human-induced cetacean mortality over the 20th century with the view of historical reconstruction of the 'initial' population sizes and, thereby, more clear evaluation of present status and trends of Black Sea cetacean populations. |
| 6 | Strategy for reducing cetacean bycatches | Develop a system of concordant measures able to decrease cetacean mortality in fishing gear at least to sustainable levels, with ultimate long-term goal of reducing it to zero if possible. |
| 7 | Mitigation of conflicts between cetaceans and fishery | Address the problem of adverse cetacean/fisheries interactions (other than bycatches) and develop measures for this problem solution. |
| 8 | Elimination of live capture of Black Sea cetaceans | Restrain intentional removal of live cetaceans from the wild. |
| 9 | Mitigation of disturbance caused by shipping | Address the problem of adverse impact of heavy marine traffic on Black Sea cetacean populations and develop appropriate conservation/management measures. |
| 10 | Management of threats from gas-and-oil producing industry | Address the problem of potential threats to cetaceans from gas and oil industry operating at sea, and develop pertinent management measures. |
| 11 | Network of existing protected areas eligible for cetaceans | Develop regional network of already operating protected areas containing cetacean habitats within their boundaries, taking into account the ACCOBAMS 2010 targets and the ACCOBAMS Criteria for Protected Areas of Importance for Cetacean Conservation. |
| 12 | Special marine protected areas for cetacean conservation | Set up particular cetacean protection modes in well- defined key areas containing cetacean habitats which are vitally important, first of all, for harbour porpoises and bottlenose dolphins, taking into account the ACCOBAMS 2010 targets and the ACCOBAMS Criteria for Protected Areas of Importance for Cetacean Conservation. |
| 13 | Basic cetacean surveys | Obtain and periodically refresh reliable basin-wide information on cetacean abundance and distribution.�� |
| 14 | Cetacean photo-identification programme | Consolidation of cetacean photo-identification studies in order to provide information on population structure, seasonal movements and ranging patterns of Black Sea cetaceans, mostly, bottlenose dolphins and common dolphins. |
| 15 | Regional cetacean stranding network | Basin-wide systematic study of cetacean strandings in order to monitor mortality levels in cetacean populations, and to provide samples for research of cetacean genetics, life history, ecology, pathology, parasitology, ecotoxicology, etc. |
| 16 | Strategies for capacity building and raising awareness | Develop long-term capacity building and public awareness strategies in order to provide explicit improvement of cetacean research, conservation and management in the Black Sea region on basis of consolidated educational activities. |
| 17 | Access to information and cetacean libraries | Provide unimpeded access to the results of cetacean research and conservation activities implemented in the Black Sea region and beyond; accumulate, systematize, store and make available relevant published information by means of proper data carriers. |
| 18 | Measures for responding to emergency situations | Develop regional strategy, guidelines and operational network able to provide urgent and competent assistance to Black Sea cetaceans involved in emergencies. |
Appendix C. Conservation Plan for Black Sea Cetaceans: actions and activities of high priority
URG ����� activities addressed as a matter of urgency (Istanbul Round Table, May 2006)
| Actions | Activities (sub-actions) | |
| 1 | Broadening the ACCOBAMS scope | (a) promotion of accession of the Russian Federation and Turkey to ACCOBAMS |
| 2 | Proper conservation status of cetacean populations | (a) proper listing Black Sea cetaceans in the IUCN Red List of Threatened Animals(b) providing correct references to the IUCN status of Black Sea cetaceans in relevant international instruments |
| 3 | Cetacean conservation approach in fishery regulations | (a) adopting the Black Sea legally binding document for fisheries and conservation of marine living resources |
| 4 | Improvement and harmonization of national legislation | (a) improvement of national legislation in respect of international requirements on the conservation of cetaceans |
| 6 | Strategy for reducing cetacean bycatches | (a) establishment of a regional bycatch network�� URG(b) estimation of bycatch levels and temporal and geographical distribution of bycatches(c) evaluation of sustainable bycatch levels for each cetacean species(d) investigation of effects causing by mitigation measures includig pingers and acoustically reflective nets(f) developing management objectives for reducing bycatches in the Black Sea region |
| 8 | Elimination of live capture of Black Sea cetaceans | (a) improvement of control assigned to eliminate live capture of cetaceans(b) preparation and adoption of national legal acts banning any intentonal capture of Black Sea cetaceans |
| 11 | Network of existing protected areas eligible for cetaceans | (a) assessment of existing protected areas with regard to their relevance to cetacean conservation�� (b) developing the regional network of eligible protected areas�� URG (с) preparation of the network�����s cetaceans-oriented strategy, action plan and guidelines(d) protected areas involved in the network should restrain human activities potentially harmful for cetaceans |
| 12 | Special marine protected areas for cetacean conservation | (a) developing management plans and creating ad hoc marine protection areas in the defined localities |
| 13 | Basic cetacean surveys | (a) carrying out region-wide survey and assessment of cetacean abundance, distribution and hot spots�� URG(b) carrying out cetacean survey in the Turkish Straits System |
| 15 | Regional cetacean stranding network | (a) developing the existing national CSNs with their functional fusion into the basin-wide network�� URG (b) developing a Black Sea regional database of cetacean strandings(c) establishing cetacean tissue bank(s) accumulating samples from stranded and bycaught cetaceans(d) multidisciplinary study of samples collected from stranded and bycaught animals |
| 18 | Measures for responding to emergency situations | (a) assessment of emergency situations demanding special response (e.g. rescue-and-release operations)(b) developing guidelines on how to respond to emergency situations affecting Black Sea cetaceans(c) developing regional strategy (contingency plan) and national teams for responding to emergency situations |
CHAPTER 11 SOCIO-ECONOMIC PRESSURES AND IMPACTS (D. Knowler)
School of Resource and Environmental Management
Simon Fraser University, Burnaby, British Columbia, Canada
11.1. Introduction
For several decades, the Black Sea has exhibited signs of being one of the most polluted and mismanaged inland or semi-enclosed seas in the world. Outbreaks of cholera, reduced recreational opportunities and degraded life support systems for both wildlife and humans have hindered the development of the region (Mee, 1992). Yet the Black Sea is an important European resource, with its watershed accounting for over half the area of the continent and its productivity rated at several times that of the adjoining Mediterranean Sea. However, these very characteristics make it more vulnerable to the environmental degradation that has occurred.
Environmental degradation in the Black Sea Region has had social and economic costs in a number of sectors. One of the hardest hit is the fisheries sector, where catches of the most lucrative fish species fell dramatically in the 1980s and 1990s. The costs of environmental degradation have manifested themselves in many other sectors as well. Along with fisheries costs, the World Bank (2000) and more recent Tranboundary Diagnostic Analysis (Black Sea Commission, 2007a) document extensive tourism, agricultural and health costs that have resulted from degradation of the Black Sea.
The extensive pollution loads discharged by the Danube, by other major rivers and by the Black Sea states themselves, together with over-fishing, dumping of toxic wastes, intensive shipping activity, mineral exploitation, the introduction of non-native species and the damming of tributaries, have been recognized as the proximate causes of severe environmental degradation in the Black Sea (Duda and LaRoche, 1997). Nutrient pollution is among the most important environmental problems affecting the Black Sea. As a result of 30 years of heavy nutrient pollution, the Black Sea (which was once oligotrophic) is now critically eutrophic (ICPDR, 1999). The northwestern portion has been transformed from a diverse ecosystem to a eutrophic plankton culture (Middleton, 1999).�� Other important contaminants in the Black Sea include oil, synthetic organic compounds and radio nuclides deposited by the Chernobyl accident (Stanners and Bourdeau, 1995). This has had a major impact on the biodiversity and ecological integrity of the Black Sea (CEC, 2001).
However, underlying these more proximate causes of degradation has been a number of social and economic pressures. Poor initial conditions or rapid changes in social and economic pressures, serve as drivers of environmental change. In this chapter, these social and economic pressures are reviewed, together with the impact that the environmental degradation of the Black Sea has had on its dependent human population. The approach taken is to compare conditions during the 1995 to 2000 period with those of the more recent period (2001 to 2005). These periods correspond to the periods reviewed during two Transboundary Diagnostic Analyses. The emphasis here is on the social and economic pressures driving environmental change as well as the impacts of change on human populations. In addition to the standard methods employed for such analyses, consideration is also given to ecological economics perspectives by including a discussion of changes in non-market values due to environmental degradation, as well as a brief review of progress towards sustainability in the six Black Sea nations.
11.2. Valuing the Environmental Goods and Services Provided by the Black Sea
���������� The Black Sea ecosystem generates a large number of environmental goods and services, some of which pass through markets, while others do not. Assessing the value of these environmental goods and services is a useful first step in understanding the human impacts of changes in the Black Sea marine system. However, to carry out such an assessment requires a framework for distinguishing and grouping these values. The concept of total economic value (TEV) provides such a framework. TEV makes a distinction between use values and non-use values, the former being further divided into direct and indirect use values. Direct uses refer to those uses which are most familiar, such as harvesting of fish and shellfish, collection of commercially valued marine products and use of the marine zone for recreation. Marine systems also perform ecological functions that support economic activity. These ecosystem services are referred to as indirect use values since it is not the functions themselves but their contribution to production that is valued. For example, marine systems can assimilate nutrients and other pollution to some extent, while coastal wetlands provide habitat for nursing and rearing of marine species.
Non-use value is often thought of as coinciding with the concept of existence value; individuals may be concerned about the continued existence of some environmental resource, such as a marine ecosystem or species, even though they have no plans to visit it. Non-use values are typically not commercially expressed since they are unrelated to use. As an example, marine biodiversity may be valued by persons living in distant countries. Due to their nature, non-use values are very difficult to measure.
For cases where values can be measured, we start with the economist�����s concept of willingness-to-pay, whether or not we actually make any payment. From this amount we then subtract what it costs to supply the good or service, recognizing that in situations where environmental goods and services are free gifts of nature this cost is zero. Measuring economic values for the environment relies on a number of valuation techniques. These techniques can be divided into those that use market prices to directly measure the economic value of environmental goods and services, and those that do not. The latter group constitutes methods for non-market valuation, and these can be subdivided into a several further groupings.[3]
What are the main values associated with the environmental goods and services provided by the Black Sea? Relatively little non-market valuation of ecosystem goods and services has been carried out involving the Black Sea marine ecosystem. Clearly, the Black Sea marine system supports a range of use and non-use values. For example, there are numerous values associated with the Black Sea�����s coastal zone and wetlands. Gren (1996) carried out a valuation study of the Black Sea wetlands, using data for 35 wetlands. She considers the fish, reed harvesting, grazing and nutrient retention values. She found that these values totaled from US$314 million to 514 million per year. These values correspond to US$ 190 and 312 per ha, respectively. Studies of other coastal systems can be instructive for putting Gren's estimates in context. For example, Brander et al. (2003) reviewed several dozen coastal valuation studies and found that the median values for coastal goods and services such as recreation, water quality, commercial fisheries and biodiversity ranged from $200 to $500 per ha per year (Table 11.1). Thus, Gren's estimates would seem quite reasonable.
In addition to the values associated with the coastal areas, the living marine resources of the Black Sea provide direct, indirect and non-use values (Table 11.2). While no estimate is available of the aggregate magnitude of these values, they certainly amount to tens or perhaps even hundreds of millions of dollars per year (see below, for an estimate covering the anchovy fishery). Aside from these values, there are a number of other specific biochemical and hydrological functions that are performed by marine systems and these should be included as well.
Degradation of the Black Sea marine system has resulted in the loss of all or some of the values referred to above. In the next section, the social and economic forces driving this unfortunate situation is explored, and then an assessment of the impacts on social and economic systems is made, keeping in mind the general trends over the last decade or so.
Table 11.1. Estimated Value of Black Sea Coastal Wetlands (US$/ha/yr)
| Wetlands | Area(ha) | FishValue | Harvest of Reeds & Grazing | Nutrient Retention | Total |
| Danube R. Delta | 592,000 | 25 | 76 | 62 | 163 |
| Dniestr R. Delta | 200,000 | 8 | 26 | 22 | 56 |
| Lower Dniepr R. | 150,000 | - | 19 | 16 | 35 |
| Don R. Delta | 55,000 | 2 | 7 | 6 | 15 |
| Others | 653,000 | 19 | 26 | - | 45 |
| Total | 1,650,000 | 54 | 154 | 106 | 314 |
Source:�� Gren (1996)
Note; figures are rounded and adjusted for rounding error. Lower values for nutrient retention from Gren (1996) are used in these calculations. Based on studies for 35 wetlands in the Black Sea region.
Table 11.2. Living Marine Resources of the Black Sea and their Values
| Living Marine Resource | �� Direct, Indirect and Non Use Values |
| Fish stocks (e.g. anchovy, sprat, shad, whiting, horse mackerel) | fresh, frozen, salted, canned and reduced products for local consumption or export (direct use)commercial and non-commercial species serve as food for higher level predators (indirect use) |
| Molluscs, crustaceans, etc. (e.g. clams, mussels, crabs, sea snails, etc.) | commercially important as seafood (direct use)serve as biofilters for reducing pollution (indirect use) |
| Bottom plants (e.g. red algae,seaweed beds, etc.) | source of agar and sodium alginate (direct use)critical habitat/food for many fish species (indirect use) |
| Marine mammals(e.g. monk seals, dolphins) | previously harvested commercially (direct use)important ecological function as top predators (indirect use);�� may have high intrinsic value as rare or endemic,�� species (non use) |
11.3. Socio-economic and Institutional Pressures
To understand the social and economic driving forces behind environmental change it is useful to employ a conceptual framework. Typically, the D-P-S-I-R model is used for this purpose (Fig. 11. 1). In this model, socio-economic drivers (D), environmental pressures (P), environmental state changes (S), social and economic impacts (I) and, finally, policy responses (R) work in sequence and through feedback mechanisms to describe the process of environmental change (Mee, 2005).
The main environmental pressures of human origin affecting the Black Sea marine systems living resources and habitats have been described in the 2007 transboundary diagnostic analysis as:
inflows of nutrients, resulting in eutrophication;
the loss of higher trophic level predator species, which has altered food chain structure;
the introduction of exotic species, especially the jellyfish Mnemiopsis leidyi;
modifications in river flow regimes, which have affected the salinity of the Black Sea and had other effects;
declines in populations of various living marine resources as a result of over harvesting; and,
inflows of chemical and toxic pollutants and erosion of coastlines.
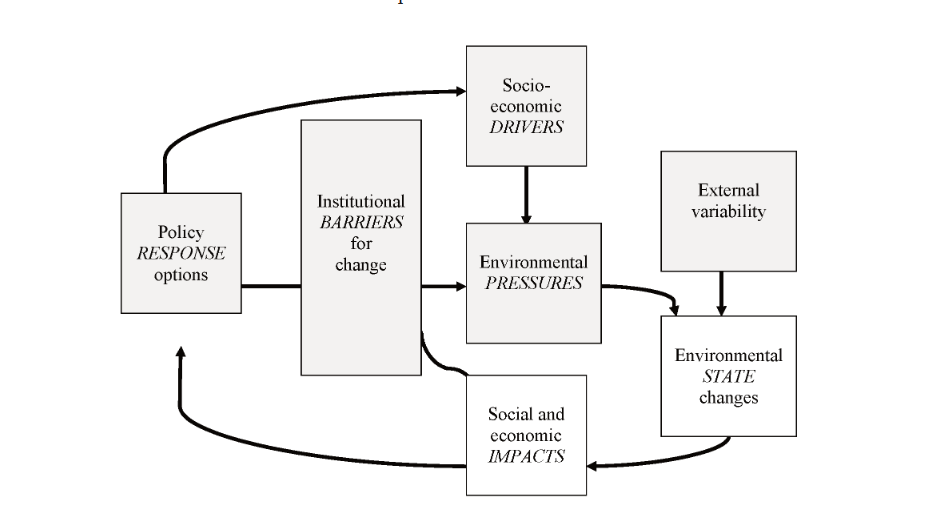
Fig. 11.1. Modified D-P-S-I-R model showing the Relationship between Drivers (D), Pressures (P), State Changes (S), Impacts (I) and Responses (R), with the Addition of Institutional Barriers. Source: Mee (2005).
Further details concerning the extent and severity of these environmental pressures can be found in other reports. Here, we examine the underlying causes or drivers behind these problems and these are largely social, economic and policy or institutionally related. However, the situation is not obvious. Unlike many rapidly growing regions of the world, the population of the Black Sea countries (except Turkey) has been contracting over the last decade (Table 11.3). Population growth rates have been consistently between zero and -1% per year (Fig. 11.2). This situation presents complex challenges for environmental management: while a declining population might be expected to put less pressure on the resource base, it may also lead to difficulties with mustering the necessary resources to address existing environmental problems. Our data does not indicate whether the coastal zone itself is experiencing a decline in population, but this may be the case where fisheries have historically been important (versus tourism) or where population density in this zone is much lower than the country as a whole (Table 11.3).
The trend is much more positive with respect to economic performance over the last decade (Table 11.4). This suggests that declining population may be a lagging indicator of national performance, since economic growth was significantly higher during 2001 ����� 2005, in comparison to 1995 ����� 2000. The exception is Turkey, where there was no significant change in the economic growth rate.�� However, Turkey and all other Black Sea countries experienced much lower consumer price inflation during the latter period, an indication of more stable macroeconomic conditions (Table 11.4). The main trend has been the reduction of importance of agriculture and the increasing significance of the service sector (Black Sea Commission, 2007a), a development that is typical of emerging economies.
Table 11.3. Demographic Data for the Black Sea Countries and their Coastal Zones, Selected Years
| Countries | Population(million) | Country Data, 2005 | Coastal Zone, 2005 | |||
| 1995 | 2005 | Population10-14 years(%) | Population density(per km2) | Population 1/(million) | Population density 2/(per km2) | |
| Bulgaria | 8.30 | 7.72 | 14.1 | 70 | 2.1 | 60 |
| Georgia | 4.79 | 4.32 | 19.5 | 64 | 1.7 | 76 |
| Romania | 22.68 | 21.71 | 15.9 | 94 | 0.97 | 62 |
| Russia | 148.40 | 142.70 | 15.7 | 9 | 0.89 | 100 |
| Turkey | 60.64 | 71.61 | 29.5 | 94 | 7.6 | 74 |
| Ukraine | 51.50 | 46.93 | 15.4 | 81 | 6.7 | 60 |
Source: World Bank. 2007. Key Development Data & Statistics. Data and Statistics. World Bank staff estimates from various sources including census reports, the United Nations Population Division's World Population Prospects, national statistical offices, household surveys conducted by national agencies, and Macro International. Accessed November 28, 2007.
http://web.worldbank.org/WBSITE/EXTERNAL/DATASTATISTICS/0,,contentMDK:20535285~menuPK:1192694~pagePK:64133150~piPK:64133175~theSitePK:239419,00.html.
1/ Georgia excludes Abkhazia; Russian population is only for Krasnodar Krai; Turkey excludes Istanbul.
2/ Turkey excludes Istanbul.
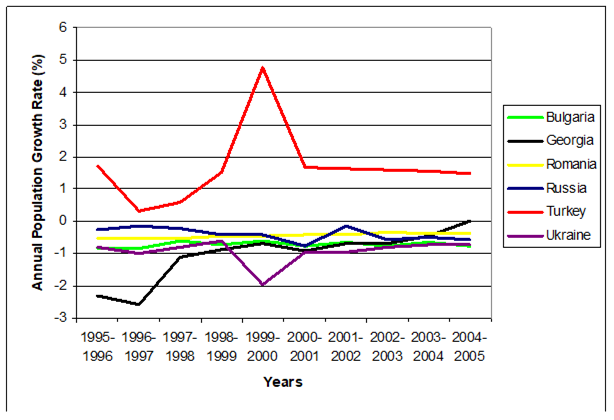 ��
��Fig. 11.2. Annual Population Growth in the Black Sea Countries, 1995 to 2005. data source: World Bank Development Indicators website (accessed November 27, 2007) at http://web.worldbank.org
What is the significance of improving economic conditions in the Black Sea countries for the marine environment? One theory holds that as countries stabilize and their per capita income increases, there is a general improvement in environmental conditions, but only after a threshold is surpassed.[4] Given that some Black Sea countries may be at or near this threshold it is possible that we could expect conditions to improve in response to higher per capita incomes. However, this is not certain and there may be a period of further deterioration before income levels are sufficient to stimulate more expenditure on environmental improvement. Further study of this phenomenon, as it affects the Black Sea region, is clearly required.
Table 11.4. Selected Economic Data for the Black Sea Countries, 1995 to 2000 and 2001 to 2005.
| Countries | GDP, Per Capita(US$ current prices) | GDP, Growth(% change/year) | Consumer Prices(% change/year) | |||
| Average1995-2000 | Average2001-2005 | Average1995-2000 | Average2001-2005 | Average1995-2000 | Average2001-2005 | |
| Bulgaria | 1471.72 | 2565.74 | -0.6 | 4.9 | 213.0 | 5.3 |
| Georgia | 655.88 | 1018.96 | 5.3 | 7.3 | 39.3 | 5.8 |
| Romania | 1644.38 | 2927.60 | 0.2 | 5.7 | 62.8 | 18.6 |
| Russia | 2074.24 | 3387.92 | 0.8 | 6.1 | 65.7 | 14.9 |
| Turkey | 2947.62 | 3523.07 | 4.6 | 4.5 | 75.9 | 28.1 |
| Ukraine | 781.48 | 1171.70 | -3.6 | 7.7 | 89.0 | 8.1 |
Sources: International Monetary Fund, World Economic Outlook Database, October 2007. Data and Statistics. http://www.imf.org/external/pubs/ft/weo/2007/02/weodata/ weoselgr.aspx. Accessed November 28, 2007.
���������� Another factor driving economic growth and potential environmental change in the region is petroleum development. Asmus and Jackson (2004, p23) describe the situation concerning this sector of the regional economy as follows: ���œThe wider Black Sea region straddles and indeed dominates the entire Euro-Asian energy corridor from trans-Ukrainian oil and gas pipelines running to the markets in Europe�����s north to the Baku-Tbilis-Ceyhan pipeline running to the Mediterranean. A new Euro-Atlantic strategy geared towards anchoring and stabilizing the region can potentially bring the vast energy reserves of the Caspian Basin and Central Asia to European markets on multiple, secure, and environmentally safe routes. Not only will these energy supplies secure the prosperity of a politically independent Europe for decades to come, but the construction and maintenance of these routes will provide an important economic stimulus to the economies that were left behind in the revolution of 1989.����
���������� It seems obvious that the possibilities for harmful impacts on the environment are substantial. Progress in ensuring this development does not harm the Black Sea will need to be monitored.
Finally, policy and institutional factors also play a role and can inhibit progress in addressing the problems of degradation (Fig. 11.1). For example, most living marine resources are not owned but shared, and therefore can be referred to as common property or ���œcommon pool���� resources. There has been relatively little control of commercial harvesting of fish and other species -- thus, there is at best "regulated open access" to the resource and this results in over harvesting.[5] Use of the Black Sea and its tributaries for the disposal of wastes is free (un-priced) and so this ecosystem service is overused, imposing external costs on the commercial fisheries. Meanwhile, the diversion of water flows from tributaries for power generation or irrigation is done without taking account of their value in maintaining suitable fish habitat and salinity levels in the Black Sea; this is another example of an external cost. On the policy side, general public policy failures include an inadequate regulatory framework, poorly coordinated planning mechanisms and a lack of enforcement of existing laws and regulations. Finally, insufficient international coordination, given the transboundary nature of most living marine resource stocks, contributes further to the problem.
11.4. Consequences of Environmental Change in the Black Sea
The pressures cited above have led to changes in the environmental state of the Black sea marine system, but these are intermediate effects, as they have further impacts in social and economic terms. Impacts on the key sectors of fisheries and tourism are reviewed below, along with a brief overview of the impact of environmental conditions on human health. Sufficient information for other sectors to consider the environmental impacts of Black Sea degradation was not available.
11.4.1�� Fisheries
One of the key industries of the Black Sea is its fisheries. Only five of the 26 commercial fish species once abundant in the Black Sea in 1970 remained commercially viable in the mid 1990s (Stanners and Bourdeau, 1995), a result of pollution and the introduction of non-native species, most notably the comb jelly Mnemiopsis leidyi. The Black Sea�����s fisheries, which supported approximately two million fishers and dependents, suffered almost total collapse (Mee, 1992; Travis, 1993). Some rough estimates were made of the losses incurred by the Black Sea commercial fisheries during this period (Caddy 1992, Campbell 1993):
Catch values from the mid 1980s to early 1990s declined by about US$240 million, using total Black Sea landings values of 900,000 t and 100,000 t, respectively, and a unit catch value of $300/t.
Separate estimates for Turkey alone suggest even higher losses, totalling $300 million annually.
Processing plant losses were roughly estimated at about $10 million for the 50 plants in the Black Sea region, on the basis of the costs of switching over to an alternative production line.
Using the more extreme replacement cost approach, the estimate for Turkish processing plants alone suggests losses of $20 to 30 million.
Up to 150,000 people were estimated to depend directly on the Black Sea fisheries. Income losses have been more difficult to estimate. Wages lost in processing plants alone totalled approximately $10 million annually.
The most comprehensive economic valuation of the decline in Black Sea fisheries is provided by Knowler (2005), who modeled nutrient-induced eutrophication and its impact on the commercial anchovy fishery in the Black Sea. While increasing nutrient loads reduced the quality of fish habitat for many benthic species (e.g. turbot), it had the reverse effect on anchovy, since these species are not much affected by algal blooms and other eutrophication-related events, and benefit from increased marine system productivity (Caddy et al. 1995). As a result, the role of nutrients as an environmental influence was modeled as a positive effect on anchovy recruitment. Complicating the picture was the shift in environmental conditions in the Black Sea in the mid 1980s due to the introduction of Mnemiopsis leidyi. Since Mnemiopsis preys on anchovy juveniles, this reduces the anchovy�����s potential stock size, offsetting the perceived benefits from increasing nutrient loads.
For this reason, two historical periods were modeled, a pre-Mnemiopsis period (1971-86) and a subsequent period with Mnemiopsis present (1987-93).[6]�� Just considering the prevailing nutrient conditions (with no abatement), Knowler (2005) estimated that the comb jelly reduced the profits available in the Black Sea anchovy fishery from over $17 million per year to under $300,000 per year, a decline of 98% (Table 11.5). Similarly, the sustainable harvest of anchovy declines from almost 400,000 t per year to only 40,000 t per year and the optimal number of industrial purse seine fishing vessels goes from 72 to 13. In contrast, the fishery had been characterized by hundreds of vessels historically, many of these vessels representing overcapitalization and leading to overexploitation.
Table 11.5. Potential Long Run Profits in the Black Sea Anchovy Fishery for the Pre-Mnemiopsis and Mnemiopsis Periods (US$ thousands, 1989/90 prices)
| HistoricalPeriod | No PollutionControl | 50% Reductionin Phosphates | Welfare Changedue toPollution Abatement |
| Pre-Mnemiopsis(1971-86) | 17,080 | 14,336 | ‑2744 |
| With Mnemiopsis(1987-93) | 290 | 138 | ‑152 |
| Welfare Changedue to Mnemiopsis | ‑16,790 | ‑14,198 | - |
Source:���� Knowler, 2005
The long run economic welfare change induced by nutrient abatement was calculated as the difference in available profits earned with and without the change in environmental quality but allowing for separate effects from nutrient abatement and the introduction of Mnemiopsis. The resulting values calculated for both scenarios show that: (i) nutrient abatement would have actually reduced profits in the anchovy fishery, and that (ii) the impact would have been much greater during the period before Mnemiopsis entered the Black Sea (Table 11.5). With the establishment of the invader, the productivity of the anchovy stock declines so significantly (as do fishery profits) that the effect of nutrient abatement is relatively small.
The recent recovery in some Black Sea countries����� fisheries through the early part of this decade indicate there may be hope for restoring the fisheries to some desired level (Table 11.6). Compared to maximum production figures for the 1972 ����� 1992 period (Stamatopoulos, 1995), only Georgia and Ukraine exceeded this performance in the 2001 ����� 2005 period.�� Other countries (especially Romania and Bulgaria) show much lower production more recently, while even resurgence in the Turkish Black Sea fishery still leaves the harvest at 100,000 t per year below the maximum attained in 1988.
Recovery in the fisheries will depend on management improvements that reduce the risk of further collapses in the future. Thus, the increases in harvest need to be sustainable and not just an expansion in national fishing fleets that generate illusory gains, only to be lost as environmental conditions change or stock dynamics respond negatively. Data on fishing fleets suggest a mixed experience across countries (Table 11.6). While Georgia and the Ukraine have managed to increase harvest with a significant reduction in their fleets, Bulgaria�����s performance is the reverse and is suggestive of worsening conditions.
Table 11.6. Fishery Statistics for the Black Sea during 1995-2000 and 2001-2005
| Country | Total Catch (t) | Number of Vessels (> 12m) | ||||
| 1995-2000 | 2001-2005 | % Change | 1995-2000 | 2001-2005 | % Change | |
| Bulgaria | 7743 | 6024 | (22) | 34 | 47 | 39 |
| Georgia | 4326 | 9468 | 119 | 35 | 31 | (12) |
| Romania | 3223 | 1964 | (39) | 12 | 9 | (28) |
| Russia | 6233 | 14148 | 127 | 26 | 26 | 0 |
| Turkey | 348636 | 374708 | 7 | 1048 | 1236 | 18 |
| Ukraine | 34955 | 48914 | 40 | 160 | 112 | (30) |
| Total | 405116 | 455225 | 12 | 1315 | 1461 | 11 |
Source:�� Black Sea Commission, 2007a
11.4.2�� Tourism
Tourism in the Black Sea region is an important industry. It benefits from general trends in world tourism, that have seen global tourism receipts grow an average of 8% per year from 1980 to 2000, while world economic growth averaged 3% (Lanza et al. 2005). Nonetheless, even at the national level, tourism in the Black Sea countries involves a relatively small number of visitors and expenditures. For example, Bulgaria, Russia, Turkey and Ukraine (no data for Georgia and Romania) accounted for only 13.7% of international tourist arrivals in Europe in 2006. For receipts, the share is even smaller: the same four countries received only 8% of total European tourism receipts and only Turkey indicates a share of receipts greater than its share of international arrivals (4.1% and 4.5%, respectively).[7]
Tourism can be both a source of environmental impact as well as being highly sensitive to the effects of degradation. According to Rudneva (2003), over 4 million persons visit the Black Sea coastline in summer but by the 1990s this had declined, compared to the 1980s, particularly in Romania where amenity values deteriorated significantly due to pollution and eutrophication. Beaches and coastal tourism resources are apparently of higher quality in Russia, Ukraine and the Caucuses but the region struggles to attract international destination tourists: Brown (1996) indicates that only 8% of tourists using the Black Sea region are from abroad.
Despite the localized nature of Black Sea tourism, international tourism trends offer insights into the general situation. Recent international travel trends suggest some improvements in visitation, comparing international arrivals for the Black Sea countries in 2001-2005 with 1995-2000 (Table 11.7). However, it is difficult to know how well these national trends reflect the experience in the Black Sea region and to what extent changes in environmental quality may be an influence. The improving trend is most noticeable in Bulgaria and Ukraine, where large increases in arrivals and receipts are noted for the more recent period (2001-2005). The increasing fortunes of tourism in these countries is demonstrated by the large rise in the share of exports attributable to tourism in 2001-2005, compared to 1995-2000, with as much as a doubling in the case of Ukraine (Table 11.7).
Table 11.7.������ General Tourism Statistics for Black Sea Countries
| Country | Number of Arrivals(thousands) | Receipts(millions current US$) | Receipts(% of total exports) | |||
| Average1995-2000 | Average2001-2005 | Average1995-2000 | Average2001-2005 | Average1995-2000 | Average2001-2005 | |
| Bulgaria | 2860.8 | 4026.8 | 903.0 | 2105.6 | 14.3 | 19.0 |
| Georgia | 267.2 | 368.2 | 135.5 | 189.8 | 21.9 | 14.2 |
| Romania | 3031.8 | n.a. | 502.2 | 651.8 | 5.1 | 2.9 |
| Russia | 16689.7 | 22338.0 | n.a. | 6078.8 | n.a. | 3.7 |
| Turkey | 8254.7 | 14802.6 | n.a. | n.a. | n.a. | n.a. |
| Ukraine | 5333.2 | 11958.5 | 506.0 | 1887.4 | 2.7 | 5.4 |
Source: World Bank. World Development Indicators 2007. Accessed at:
http://ddp-ext.worldbank.org/ext/DDPQQ/showReport.do?method=showReport
Assessing the impacts of environmental degradation on tourism requires studying tourists����� attitudes towards possible improvements in environmental quality. Brown (1996) used this approach to determine how tourist visitation would change given fixed improvements in environmental quality in the Black Sea. He used the travel cost technique and pilot studies in Romania to generate values for the entire Black Sea region (Table 11.8). Tourists were asked whether they would still visit the region given prescribed changes in environmental quality (5%, 10% and 20%) and this information was then used to project changes in visitation and the value of gains/losses in consumer welfare associated with these changes, measured as changes in consumers����� surplus.[8]
Tourists responding to the survey interpreted environmental quality with respect to ���œdebris in the water, poor water clarity, oil in the water and on beaches and other dimensions���� (Brown, 1996, p15). Using 1995 visitation and expenditure as a baseline, the annual aggregate willingness to pay for a 5% improvement in environmental quality was $314 million per year (1995 prices). This contrasts with a willingness to pay of $551 million per year for a 20% improvement in environmental quality (Table 11.8).
Table 11.8. Estimated Annual Loss of Tourism Value from Environmental Deterioration of the Black Sea in the Mid-1990s
| Country | Baseline Values | Estimated Value of Quality Change | |||
| Visitors(number) | Estimated value(1995 $millions) | 5%improvement | 10%improvement | 20%improvement | |
| Bulgaria | 800 | 48 | 12 | 14 | 21 |
| Georgia | 250 | 15 | 4 | 4 | 7 |
| Romania | 870 | 52 | 13 | 15 | 23 |
| Russia | 12500 | 750 | 188 | 218 | 330 |
| Turkey | 2200 | 132 | 33 | 38 | 58 |
| Ukraine | 4250 | 255 | 64 | 74 | 112 |
| Total | 20870 | 1852 | 314 | 363 | 551 |
Source:�� Brown, 1996
While conditions have changed somewhat since this study was done, it is likely that the basic conclusions and order of magnitude estimates remain the same. One continuing cause for concern is the presence of large amounts of marine litter. In a recent study of marine litter from the Black Sea Commission high levels of marine litter (ML) on recreational beaches were noted (Black Sea Commission 2007b, p10): ���œGreat numerical predominance of plastic ML (80�����98%) has been determined in comparison with glass ML (2�����20%) on the wild (unmanageable) beaches of Crimea, Ukraine, during different seasons. The density of beachfront pollution by polymeric garbage varied from 333 to 6,250 kg/km2, while the density of glass ML fluctuated between 222 and 1,455 kg/km2. The concentration of ML collected in different places of the Turkish Black Sea coast varied from 58 to 1,395 kg per linear kilometer of the coastline... According to interview data, most visitors of Bulgarian beaches (up to 90%) appreciated local climatic conditions but did not like rubbish on the coast. The opinion of holiday-makers was that ML strongly (or very strongly) affects quality of a beach.������
Clearly, more needs to be done to improve environmental conditions for Black Sea tourism. If these improvements are made, then the opportunities to provide substantial gains to consumer welfare surely exist. Domestic tourism participation is closely tied to economic conditions so that rising incomes will be important as well. A generally increasing global trend in tourist activity will help.
11.4.3�� Health
According to Rudneva (2003), the most important health-related effects of marine degradation are the presence of microorganisms from infected sea water, contact with polluted sea water or beach sand, and consumption of contaminated seafood. In an earlier World Bank cost-benefit study (World Bank n.d.), the main health threats in the Black Sea region were assessed for three locations according to whether they were of a continuous or incidental nature (Table 11.9). Extremely high to large risks were common. In recent decades, the Black Sea countries have experienced several incidents of cholera, E. coli outbreaks, hepatitis A and enterovirus infections. Most such problems stem from direct effluent discharges to the Black Sea near urban areas and beaches or from bioaccumulation of toxics within fish and mollusks harvested for human use.
Progress in addressing the problem of human health impacts has been made since the identification of waste water treatment hot spots in the original 1996 transboundary diagnostic analysis. As part of the investment program initiated since 1996 a number of waste water treatment plants have been funded and contamination problems are considered resolved at these sites. However, the number is not large. Of the 34 municipal hot spots identified in the 1996 Transboundary Diagnostic Analysis,�� upgrades on only 8 have been completed (Tsarevo, Constanta Nord/Sud, Eforie Sud, Mangalia, Gelendzhik, Dzoubga and Pivdenni), while work continues at several additional sites (Black Sea Commission, 2007a). Thus, there is still some progress to be made in addressing this critical environmental problem.
11.5. Sustainability: Progress and Prospects
In this section, we examine general progress towards sustainability in the six Black Sea countries using new indicators of sustainable economic welfare. Conventional indicators of socio-economic progress neglect the progress of countries towards attaining sustainability. Various indicators of sustainability are available to correct this shortcoming but most concern ecological status or are not appropriate at the national level (Bell and Morse 1999). The most appropriate for comparing the performance of whole national economics is the Adjusted Net Savings concept (or Genuine Saving), developed by the World Bank.[9] This sustainability indicator is related to green national accounts by using national accounts data to measure the true savings in an economy. It takes account of investments in human capital, depletion of natural resources and damage caused by pollution via several adjustments to gross savings in the country:
Table 11.9. Degree of Health Risk Associated with Various Aspects of Black Sea Pollution
| Nature of Pollutant | Health Threat | Continuous Risk | Incidental Risk | ||||
| Istanbul | Odessa | Bourgas | Istanbul | Odessa | Bourgas | ||
| Discharges from harbours and ships | Allergic reactions | extremely high | extremely high | extremely high | extremely high | extremely high | extremely high |
| Industrial chemical discharges | Skin and outer mucosa diseases | �� large to very large | extremely high | substantial | Very large | extremely large | substantial |
| Industrial Organic Discharges | Allergic reactions | extremely high | extremely high | large | extremely high | extremely high | large |
| Toxic Industrial Chemical Discharges | Life threatening | insignif. | very small | insignif. | Small | large | small |
| Contaminated Seafood | extremely high | large | average | Large | substantial | very small | |
| Municipal Sewage | Typhoid fever,��dysentery, cholera | extremely high | extremely high | large | large | large | small |
| Contaminated Seafood | extremely high | large | average | large | substantial | very small | |
| Agricultural chemicals | Allergic skin��diseases | average | very high | average | |||
Source : World Bank, 2000. The threat levels are ordered in the following manner:
extremely high > very large > large > substantial> average > small >very small > insignificant.
Depreciation of manufactured capital is deducted to yield net national savings.
Current education expenditures are added to net domestic savings to capture investment in human capital.
Depletion of natural resources is deducted to capture the reduction in asset values resulting from extraction or harvest. The measure of depletion is taken as foregone natural resource rents.[10]
Residual pollution damages are deducted as measured by estimated health damages due to urban air pollution.
If adjusted net savings are negative, then the country�����s total wealth is falling (see http://web.worldbank.org/WBSITE/EXTERNAL/TOPICS/ENVIRONMENT/EXTEEI/0, contentMDK:20487828~menuPK:1187788~pagePK:148956~piPK:216618~theSitePK:408050,00.html). Policies resulting in consistently positive adjusted net savings suggest the country is on a path towards sustainability.
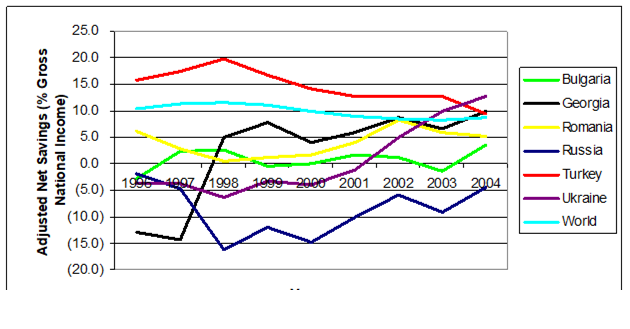
Fig. 11.3. Sustainability Indicators: Adjusted Net Saving in the Six Black Sea Countries, 1996 ����� 2004. Data source: World Bank website (accessed November 27, 2007) at http://web.worldbank.org
For the Black Sea countries the picture is one of widely divergent performance on sustainability during the years 1996 ����� 2000 (Fig. 11.3). Most countries showed a more-or-less constant trend but at quite different levels, while two performed more erratically. Russia indicates a dramatic downturn in sustainability after 1997, mostly due to an increase in energy resource depletion. Conversely, Georgia shows a dramatic increase in sustainability at the same time, resulting from an increase in gross savings and reductions in fixed capital depreciation and particulate matter pollution. Throughout the period, all countries show substantially lower adjusted net savings than the World average, except for Turkey (Fig. 11.3).
In the subsequent period from 2001 ����� 2004 there is a general converging trend in the sustainability performance of the Black Sea countries (Fig. 11.3). The strongest performers are Russia and the Ukraine, while Turkey�����s adjusted net savings decline gradually. For the former two countries, the improvement stems from higher gross savings and lower depreciation of fixed assets. It is of interest that the Black Sea countries seem to be converging around the World average performance.
11.6. Conclusions
The D-P-S-I-R model clearly suggested some progress on socio-economic dimensions of environmental improvement in the 2001-2005 period that may, in part, be tied to enhanced economic fortunes. More stable and prosperous economies are liable to (eventually) lead to improving environmental conditions. There is certainly some evidence that the Black Sea countries are converging on a path towards sustainability (as measured by net adjusted savings). On the other hand, there is more progress to be made: achievements in addressing hot spot investments to eradicate water quality problems have been modest and more is required if threats to human health are to be reduced.
An important element in making further progress is the development of a set of indicators that can measure achievements on social and economic issues. While developing a full set of appropriate indicators would be a substantive undertaking, and one that is not possible here, Table 11.10 provides a preliminary list of possible indicators as a starting point. These suggested indicators include some for which the data may exist now (e.g. national gross domestic product, international tourist arrivals, net adjusted savings), it also contains some for which data may be sparse or non-existent at present (e.g. marine fish stocks, coastal zone population density). Many of the latter are the more detailed indicators that reflect localized conditions within the coastal zone of the Black Sea countries. Thus, a concerted effort with the requisite funding will be required to make progress in this area.
Table 11.11. Preliminary Socio-economic Indicators for the Black Sea
| Type ofindicator | Indicators | Units |
| Population and Demographics | - Administrative units in coastal zone (cities, �� localities, villages, etc)- Population, country and coastal zone[Note: its useful to have country and coastal zone to place latter in national/comparative perspective]- Population density, country and coastal zone- Population growth, country and coastal zone - Net migration rate, country at least | no.thousands pers.inhabitant/km2%% |
| Economic | - Land use change in coastal zone [by land use type]- Average monthly earnings, national- Fishing catch [by species]- Marine fish�� stocks [rare to find this]- Gross domestic product, national and regional - Sectoral distribution of GDP- Changes in value of ecosystem services - Changes in value of natural capital | % Euro/montht/yeartThou Euro%Thou EuroThou Euro |
| Social and��Health | - Population with access to clean water- Population connected to WWTP- Unemployment rate, national | %%% |
| Transport | - Density of the public road network, coastal zone- Number of airports, coastal zone- Length of railways, coastal zone- No. of harbours- Total harbour area- Harbour traffic capacity | km/km2no.kmno.hamil/tons/year |
| Tourism | - Touristic accommodation units in coastal zone- Number of tourist arrivals- Number of tourist overnight stays- Value of tourist expenditures | bed unitsno/yearbed-nightsThou Euro |
| Public Awareness and Sustainability | - Number of�� environmental NGO�����s - Net Adjusted (Genuine) Savings indicator ���� (World Bank)- Ecological Footprint & related (Global Footprint �� Network, Moran et al. 2008) | No. |
References
Asmus, R.D. and Jacksono, B.P. (2004) The Black Sea and the frontiers of freedom. Policy Review, 125, 17-26.
Bell, S. and Morse, S. (1999) Sustainability Indicators: Measuring the Immeasurable? Earthscan Publications, London.
Black Sea Commission (2007a) Black Sea Transboundary Diagnostic Analysis. Black Sea Commission/United Nations Development Programme/Global Environment Facility, Istanbul, Turkey.
Black Sea Commission (2007b) Marine Litter in the Black Sea Region: A Review of the Problem. Black Sea Commission Publication 2007-1, Istanbul, Turkey.
Brander, L.M., Florax, R.J. and Vermaat, J.E. (2003) The empirics of wetland valuation: a comprehensive summary and meta-analysis of the literature. IVM report W-03/30 Institute for Environmental Studies, Vrije Universiteit, Amsterdam, The Netherlands.
Brown, G.M. (1996) Tourism related economic value of environmental quality of the Black Sea. Report prepared for the Black Sea Environment Programme, Istanbul, Turkey.
Caddy, J.F. (1992) Rehabilitation of natural resources. Background Document. Environmental Management and Protection of the Black Sea, Technical Experts Meeting, 20-21 May 1992, Constanta, Romania.
Caddy, J., Refk, R. and Do-Chi, T. (1995) Productivity estimates for the Mediterranean: evidence of accelerating ecological change. Ocean and Coastal Management, 26(1), 1-18.
Campbell, D. (1993) Socio-economic study of the Black Sea fisheries. Report of the Second Technical Consultation on Stock Assessment in the Black Sea, 15-19 February, Ankara, Turkey. General Fisheries Council for the Mediterranean (GFCM)/FAO Fisheries Report No. 495, FAO, Rome.
CEC. (2001) Communication From the Commission: Environmental Co-operation in the Danube - Black Sea Region. Commission of the European Communities, Brussels.
Dasgupta, P., Laplante, B., Wang, H. and Wheeler, D. (2002) Confronting the Environmental Kuznets Curve. Journal of Economic Perspective, 16(1), 147-68.
Duda, A. M. and La Roche, D. (1997) Sustainable development of international waters and their basins: implementing the GEF Operational Strategy. Water Resources Development, 13(3), 383-401.
Freeman, A.M. III. (1993) The Measurement of Environmental and Resource Values. Resources for the Future, Washington, D.C.
Gren, I-M. (1996) Economic Valuation of Black Sea Coastal Wetlands. Draft Report prepared for the Black Sea Environment Programme, Istanbul, Turkey.
International Commission for the Protection of the Danube River and International Commission for the Protection of the Black Sea (ICPDR-ICPBS). 1999. Causes and effects of eutrophication in the Black Sea-Summary Report. Joint Ad-hoc Technical Working Group ICPDR-ICPBS, United Nations Development Programme/Global Environment Facility, New York.
Knowler, D. (2005) Re-assessing the costs of biological invasion: Mnemiopsis leidyi in the Black Sea. Ecological Economics, 52, 187-199.
Lanza, A., Markandya, A. and Pigliaru, F. (eds.) (2005). The Economics of Tourism and Sustainable Development. Edward Elgar, Cheltenham, UK, Northampton, MA.
Mee, L.D. (1992) The Black Sea in crisis: the need for concerted international action. Ambio, 21(3), 278-286.
Mee. L.D. (2005) Assessment and monitoring requirements for the adaptive management of Europe�����s regional seas. In: Managing European Coasts Past, Present and Future, R. Allan, U. Forstner, W. Salomons, J. Vermaat, W. Salomons, L. Bouwers and K. Turner (eds.). Springer, Berlin/Heidelberg.
Middleton, N. (1999) Global Casino, 2nd edn, Arnold, New York.
Rudneva,�� I. (2003) Socio-economic impacts of environmental degradation in the Black Sea.�� In: Proceedings of the Sixth international Conference on the Mediterranean Coastal Environment, MEDCOAST 03, 7-11 October 2003. E Ozhan (ed.), Ravenna, Italy.
Stamatopoulos, C. (1995) Trends in Catches and Landings ����� Mediterranean and Black Sea Fisheries: 1972-92. Fisheries Circular No. 855.4 Supplement (FIDI/C855.4 Suppl.), FAO, Rome.
Stanners, D. and Bourdeau, P. (1995) Europe�����s Environment: The Dobris Assessment, European Environment Agency, Copenhagen.
Travis, J. (1993) Invader threatens Black, Azov Seas. Science, 262, 1366-1367.��
World Bank. (2000) Strategic Partnership for Nutrient Reduction in the Danube River Basin and Black Sea - Benefit-Cost Analysis. Draft Report, ECSSD, World Bank, Washington.
CHAPTER 12 OVERALL ASSESSMENT OF THE PRESENT STATE OF BLACK SEA ECOSYSTEM (T. Oguz et al.)
Institute of Marine Sciences, Middle East Technical University, Erdemli, Turkey
1Inebolu Sokak 29, Kabatas, Istanbul, Turkey
2 Bahcelievler Mahallesi, Aki Sokak, No 11, Uskudar, Istanbul, Turkey
12.1. Introduction
During the last three decades eutrophication has been identified as a key ecological problem for the coastal Black Sea regions and especially for its northwestern part where strong anthropogenic nutrient and pollution loads resulted in dramatic alterations in chemical and biological regimes. Eutrophication refers to undesirable disturbances in ecosystem functioning due to anthropogenic enrichment by nutrients and subsequent accelerated growth of algae and higher life forms. Rapidly intensifying eutrophication in the 1970s and 1980s transformed the formally diverse ecosystem with a rich variety of marine life into a degraded system with marked changes in composition and abundance at species level, and species communities and their interactions at the ecosystem level. A schematic of the transformations in the ecosystem level is depicted in Fig. 12.1.
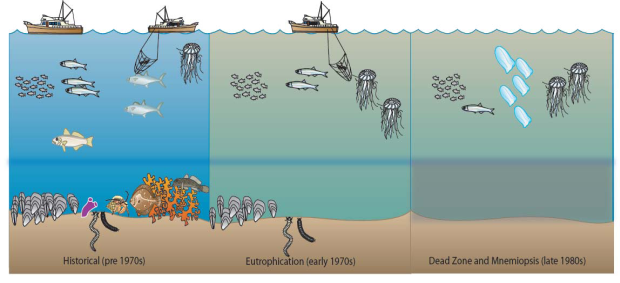
Fig. 12.1. Schematic representation of the Black Sea pelagic and benthic ecosystem transformations along the Black Sea western coast (after Friedrich et al., 2006).
In addition to eutrophication, other high priority transboundary ecological problems are the decline in living resources (mostly fish stocks), chemical pollution, biodiversity change, habitat destruction, alien species invasions, climate-change impacts, and mesoscale variability of the circulation system (TDA, 2007). The present chapter provides an overview of overall assessment for the status of the Black Sea ecosystem and its likely trends of evolution since the implementation of the Black Sea Strategic Plan started with particular emphasis given to 2001-2005. First, the recent state of eutrophication in coastal and shelf waters is assessed in terms of nutrient enrichment levels, limiting nutrients in different water regimes, chlorophyll and dissolved oxygen concentrations. Then, the contribution of chemical pollution is evaluated. It is followed by an assessment of the pelagic and benthic systems and marine living resources. The assessment mainly focuses on the western coastal zone that has been subject to worst environmental degradation with respect to other coastal regions and but it is compared with the interior basin wherever appropriate. Modulation of the ecosystem properties by climate-induced changes is also highlighted.
12.2. Mesoscale variability of the circulation system
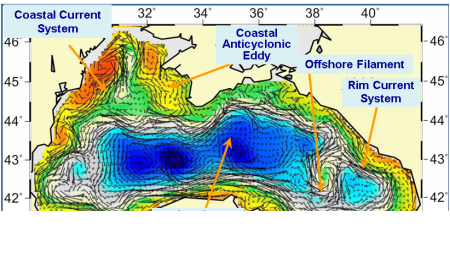
Fig. 12.2. A typical structure of the upper layer circulation field deduced from a circulation model using assimilation of altimeter sea level anomaly data. (after Korotaev et al., 2003).��
Primary feature of the Black Sea circulation system is highly dynamic structural organization of the interior cyclonic cell and the Rim Current. The latter flows along abruptly varying continental slope and margin topography around the basin, whereas the interior circulation, formed by several sub-basin scale cyclonic gyres and eddies, evolve continuously due to interactions among these eddies and meanders and filaments of the Rim Current (Fig. 12. 2). Coastal side of the Rim Current comprises a series of recurrent anticyclones. The overall basin circulation is primarily driven by the curl of wind stress throughout the year and further modulated by seasonal evolution of the surface thermohaline fluxes and mesoscale features arising from the basin�����s internal dynamics. In addition, fresh water discharge from the Danube and other northwestern rivers contributes to buoyancy-driven component of the basin-wide circulation system. Eddies, meanders, filaments, offshore jets of the Rim Current often introduces strong shelf-deep basin exchanges and two-way transports of biota and chemicals between near-shore and offshore regions.
Flow structure in the northwestern shelf is driven by spreading of the Danube outflow under temporally varying wind forcing. The Danube plume can spread northward or southward along the coast, or is expanded offshore depending on winds, internal dynamics, and initial vorticity of the plume. Southerly�� winds cause upwelling along the Romanian ����� Bulgarian coast bringing nutrient-rich deep sea waters into the surface layer and promote biological production. On the other hand, northerly winds trap the freshwater plume along the coast and the southward thin boundary current is separated from offshore waters by a well-defined front (Fig. 12.3a) which sometime displays unstable features, exhibits meanders, extends across the wide topographic slope zone and spawns filaments (Fig. 12.3b).
A branch of the Rim current may occasionally protrude into the NWS through outer branch of the Sevastopol eddy and modulates the shelf circulation system. In the case of alternative upstream deflection of the Danube outflow, the southward coastal current system weakens or may totally loose its identity. The river plume may then occasionally be trapped by the anticyclonic Danube eddy that covers the region between Odessa and Constanta (Fig. 12.3b). Other features of the western coastal flow system are the recurrent Kaliakra and Bosporus anticyclones (Fig. 12.2).
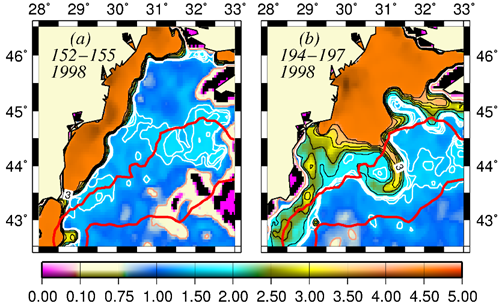
Fig. 12.3. SeaWiFS chlorophyll distributions showing two alternative forms of circulation structure in the northwestern shelf; (a) a southward coastal current system during days 152-155 (early June) and (b) a closed circulation system confined into its northern sector during days 194-197 (mid-July), 1998 (after Oguz et al., 2002).
12.3. Climatic regulation of the Black Sea
The Black Sea ecosystem transformations in the 1980-1990s were accompanied with strong decadal scale climatic perturbations. These climatic changes modulated the ecosystem properties concomitantly with the anthropogenic impacts. As shown in Fig. 12.4 (blue curve), amplitude of decadal-scale fluctuations in the annual-mean basin-averaged SST anomaly since the beginning of 1960s was around 1.0 oC. They were locally even more pronounced as, for example, recorded by about 4oC changes in Galata monitoring site along the Bulgarian coast (Fig. 12.4, red curve). These decadal variations were an order of magnitude greater than the global SST changes of ~0.25oC for 1930-2005 (Fig. 12.4, green curve).����
The annual-mean SST variations indicate a succession of decadal-scale cooling-warming cycles on the order of 1.0oC. The period 1937-1957 was characterized by 0.9 oC cooling followed by 1.0 oC warming during 1957-1978, and subsequently two concomitant cooling and warming cycles of ~1.5oC during 1978-1993 and 1993-2002. The system switched to the cooling cycle during 2002-2005.�� The switch to the warming phase in the 1990s occurred in the western coast as early as 1988 whereas it was disrupted by the 1997-1998 short-term cooling events.�� The strong warming trend in 1993-2002 brought the annual-mean sea surface temperature to the level in the mid-1960s.
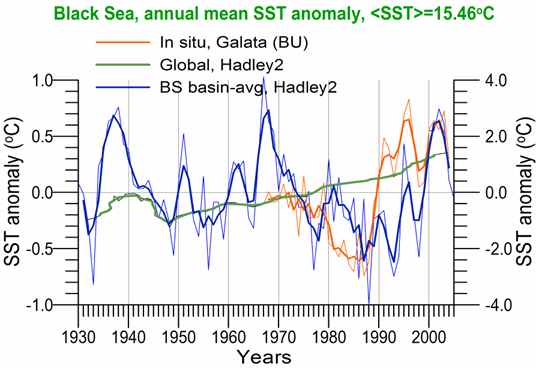
Fig. 12.4. Annual-mean sea surface temperature (SST) anomaly changes obtained by in situ measurements at 3 nm offshore of Cape Galata (Bulgaria, after Kamburska et al., 2006; right axis, in red colour) and the basin averaging (left axis, in blue colour) of the Hadley-2 data, and their comparison with the globally-averaged SST fluctuations based on Hadley-2 data (in green; left axis). The Hadley-2 data is described by Rayner et al. (2003).�� All data show both the unsmoothed and smoothed (by three-year moving averaging) variations.
The North Atlantic Oscillation (NAO) and the East Atlantic-West Russia (EAWR) climatic indices relate the regional hydro-meteorological properties (such as the air and sea surface temperature and surface atmospheric pressure fields) to the surface pressure differences between the anomaly centres over the North Atlantic and the Eurasia. In general, a mild winter climatic cycle is characterized by relatively high sea surface and air temperatures, higher surface atmospheric pressures, and is correlated with decreasing trends of the NAO and EAWR indices and vice versa for the case of a severe winter climatic cycle. The intimate relationship between the local climate and hemispherical atmospheric motions is evident in Fig. 12.5 by the association of 1981-1993 cooling cycle with increasing trends of both the NAO and EAWR indices. The subsequent warming cycle is explained by decreasing mode of both the NAO and EAWR indices up to 2002, after which neither the NAO nor the EAWR climate index explain well the Black Sea SST variations.
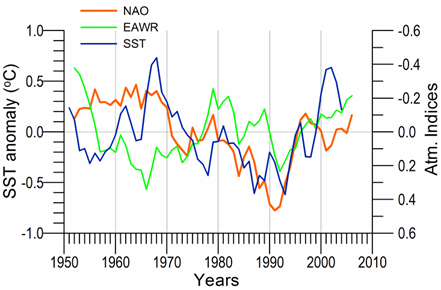
Fig. 12.5. The changes of annual-mean, basin-averaged sea surface temperature (SST) anomaly and the North Atlantic Oscillation and the East Atlantic-West Russia climate indices.
The SST changes are based on the Hadley-2 data set (Rayner et al., 2003), the atmospheric indices are retrieved from NOAA Climate Prediction Centre data base; http://www.cpc.ncep.noaa.gov/�� data/teledoc/telecontents.shtml). All data were smoothed by three-year moving averaging.
12.4. Eutrophication/Nutrient enrichment
River nutrient loads: Following the early 1990s, economical recession in the former eastern block countries indirectly resulted in closure of ecologically ineffective large animal farms (agricultural sources) and of nutrient discharging (e.g. fertilizer) industries. Phosphate content was also reduced in detergents, and nutrient removal from waste water was improved in the countries along the Danube River. Consequently, according to measurements at Reni located 34 km upstream of the Danube delta, the total P-load (TP) experienced a strong reduction from ~60 to 20-30 kt y-1 at the beginning of 1990s and dropped below 20 kt y-1 afterwards as in the case of the 1960�����s. The dissolved inorganic nitrogen (DIN) load, measured at Reni, remained around 400 kt y-1 since the beginning of 1990s without any sign of reduction.
Complementary measurements near the mouth of Sulina branch of the Danube River indicated a major reduction of the DIN load from ~700 kt y-1 during the late 1980s to 100 kt y-1in the present decade (Fig. 12.6). 90% of this DIN load was contributed by N-NO3. A roughly three-fold difference between the Reni and Sulina DIN flux estimations may arise due to methodological differences in the measurement techniques, high nutrient uptake in primary production in the Danube delta region as well as mixing and dilution associated with estuarine-type river-sea water interactions. Alternatively, a likely cause of higher DIN flux at Reni may be continuing emissions accumulated in soil stocks in the Danube catchment basin which continue to support high nitrogen load through ground-water emissions. Whatever the cause and the rate of reduction, their 2000-2005 average value was still roughly twice higher than the pristine level prior to the 1960s. The difference in the PO4 load between Reni and Sulina is small and not critical as in the case of DIN.�� The SiO4 flux at Sulina reveals an opposite trend; it decreased from 500 kt�� y-1 to 100 kt y-1 during the 1980s but increased steadily afterwards up to 500 kt y-1 in 2005 again contrary to considerable silicate retention and decrease in Danube sediment load in response to the construction of reservoirs along the main river and its tributaries after the 1960s (Humborg et al., 1997).�� As described below, these trends may be related to the changes in phytoplankton bloom intensity and community structure.
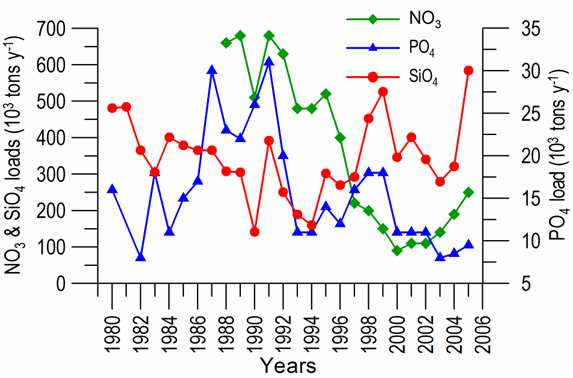
Fig. 12.6. River Danube annual dissolved inorganic nitrogen (DIN), phosphate (P-PO4) and silicate (SiO4) loads into the Black Sea based on the measurements conducted at Sulina. The data are taken from�� Cociasu et al. (2008).
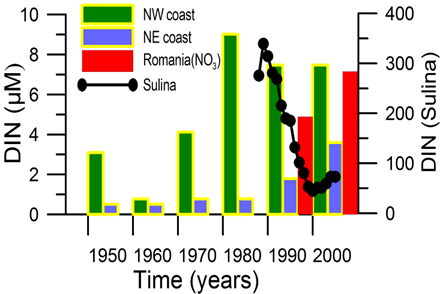
Fig. 12.7a. Decadally-averaged changes of surface dissolved inorganic nitrogen (DIN) concentration along the western and eastern coastal waters of the NWS as well as surface N-NO3 concentration in the Romanian shelf (red bars) and the Sulina exit of the River Danube solid dots). The data except at Sulina are amalgamated from several stations.
Nutrient concentrations: During the present decade, DIN concentration along the northwestern and northeastern coasts of the NWS as well as along the Romanian shelf experienced locally either a rising trend or maintained its level in the 1980s-1990s (Fig. 12.7a). Existence of N-NH4 concentration comparable to N-NO3 indicates high emissions from local point sources along the Romanian and Ukrainian coasts of the NWS. DIN concentration at Sulina varying around 50-70 μM during 2000-2005 was still high although it was declined from 350 μM level during the 1990s (Fig. 12.7a). ��Dissolved organic compounds constituted an important nutrient source for the NWS. Monthly DON and DOP measurements at Sulina discharge point during 2004-2005 suggested DON changes from the range of 60-120 μM during autumn, winter and early spring seasons to 20 μM in summer and DOP changes from 4-5 μM to 1 μM (Cociasu et al., 2008). The northwestern coastal waters of the Ukrainian sector were persistently characterized by high DON concentrations that increased from the decadal-mean value 25 μM in the 1980s to 40 μM in the 1990s and the present decade (Fig. 12.7b). Consequently, the western coastal waters presently continue to suffer from both dissolved inorganic and organic nitrogen enrichment and they do not show an apparent status of improvement during the last 10 years. DIN and P-PO4 concentration levels along other coasts (southern, northeastern and northern) were found to be 3-4 times lower than the western coast. The interior basin water column nitrogen structure responded to the decline in the anthropogenic DIN load by reducing peak subsurface nitrate concentration below 6 ��M in the 1990s and below 5 ��M in the present decade (Fig. 12.8).����������
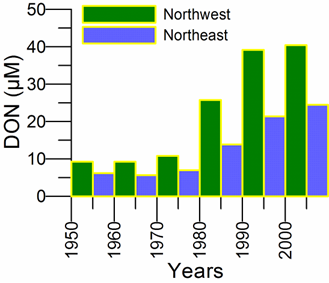
Fig. 12.7b. Decadally-averaged changes of surface dissolved nitrogen (DON) concentration along the western and eastern coastal waters of the NWS.
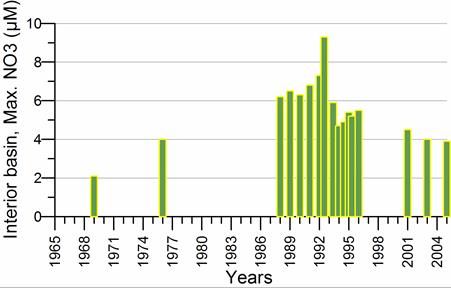
Fig. 12.8. Temporal variations of the subsurface peak nitrate concentration within the interior basin.
Available data suggest regionally and seasonally varying limiting nutrient conditions along the western shelf waters. In general terms, brackish coastal waters with salinity lower than 17 psu, most influenced by the river discharges, are predominantly P-limited as, for example, reported for the Sulina and Constanta measurement sites due to continuing high nitrogen enrichment. On the other hand, the amalgamated data formed by the N-NO3 and P-PO4 measurements in the Romanian and Ukrainian inner and outer shelf waters show weak N or P limitation (Fig. 12.9) whereas the interior basin is strongly N-limited system. The data also suggest an increasing Si limitation along the western coastal waters due to high N-NO3 concentrations relative to SiO4.
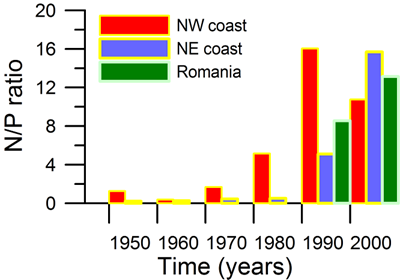
Fig. 12.9. Decadally-averaged changes of N-NO3/P-PO4 ratios in the Ukrainian and Romanian shelf based on the amalgamated data (see Chapter 2 of this report).
Chlorophyll concentration: According to the satellite ocean color data (Fig. 12.10), annual-mean surface chlorophyll concentration in 1998-2007 possesses three-fold higher values in the northwestern region (~3 mg m-3) with respect to the western interior basin (~1 mg m-3). Moreover, in-situ summer chlorophyll-a measurements near the Zmeiny Island reveal summer mean surface Chl-a concentration around 1.0-2.0 mg m-3 (Table 12.1) which are at least twice lower than the mean value of 4.5 mg m-3 for 1980-1995 (Kovalova et al., 2008), therefore supporting a decrease in primary production during the present decade. However, high chlorophyll values up to ~25 mg m-3 are still observed temporarily in spring-summer months. In the subsurface layer, summer mean Chl-a concentration is roughly half of the values measured in the surface mixed layer (Table 12.1). Highest monthly-mean surface chlorophyll concentrations around 2-3 mg m-3 are observed during April-June. The secondary maximum of 2 mg m-3 arises in October-November following the minimum concentration about 1 mg m-3 in August. Thereafter, Chl-a concentration rises from 1 mg m-3 in January up to 3 mg m-3 in April. The corresponding monthly-mean chlorophyll concentration variations provided by the SeaWiFS ocean colour data for the NWS shelf (Fig. 12.10) attains an increasing trend from 2.0 mg m-3 in March to 4.0 mg m-3 in July.�� Equally high peak concentrations also arise in November. The satellite data however do not show a well-defined spring peak as in the case of the Zmeiny island data.
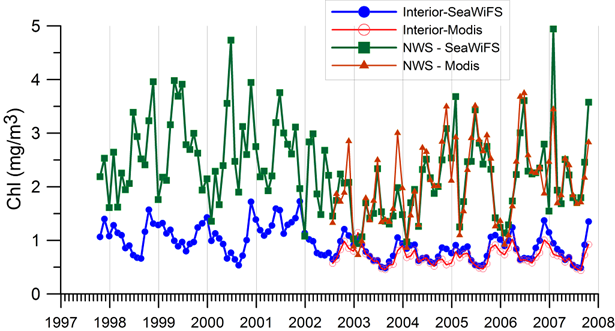
Figure 12.10. Average surface chlorophyll concentration for the northwestern shelf and the interior basin obtained from 8-daily 9 km resolution SeaWiFS and Modis ocean colour products after the original data is smoothed by 5 point moving average.
Table 12.1. Ranges and average values of Chl-a concentration (mg m-3) near the Zmeiny Island of the northwestern shelf during summer months of 2003�����2007 (after Kovalova et al., 2008).
| Surface Layer | Bottom Layer | |||
| Range | Average | Range | Average | |
| V-IX���� 2003 | 0.28-7.75 | 1.25 | 0.25-1.26 | 0.76 |
| VI-XI�� 2004 | 0.22-12.02 | 2.41 | 0.26-5.72 | 1.48 |
| IV-XI�� 2005 | 0.19-28.03 | 2.90 | 0.18-2.93 | 1.03 |
| IV-XI�� 2006 | 0.13-7.29 | 1.53 | 0.13-5.55 | 0.75 |
| IV-XI�� 2007 | 0.13-16.80 | 1.33 | 0.15-1.44 | 0.78 |
The interior basin depicts a different annual chlorophyll structure (Fig. 12.10). Surface chlorophyll concentration decreases linearly from a peak in November (1.5 mg m-3 as an average of 1998-2007) to a minimum in July (0.75 mg m-3), followed by an increase from August to November again. A weak chlorophyll peak may occasionally exist in spring. This structure implies that the phytoplankton production initiates in September, gradually intensifies and spreads over the basin in October, and finally reaches a basin-wide bloom stage in November. The autumn bloom episode generally terminates in January and is followed by a continuous decreasing trend during winter and spring months. The strong chlorophyll signal in February or March, which was the most robust feature of the annual structure in the 1980s, appears as a slight increase in concentrations by about 0.1-0.2 mg m-3 either in January or February, except no peak in 2002 and its shift to spring in 2001.
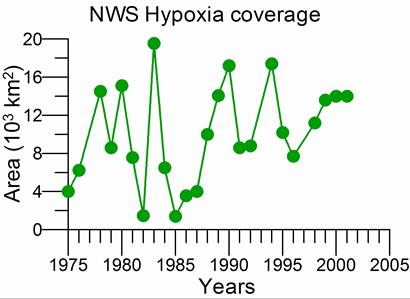
Fig.12.11. Long-term variations of spatial coverage of hypoxia in northwestern coastal waters. The data are taken from the Ukrainian National Reports, UkrNCEM.
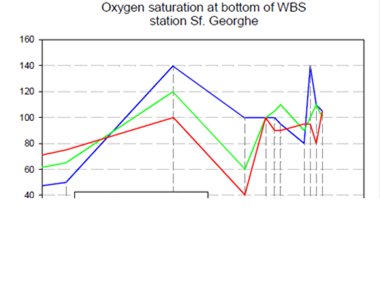
Fig. 12.12. Changes in summer oxygen saturation values of bottom waters at three locations along the Sf. Georghe transect immediately to the south of Danube discharge zone (after GEF-UNDP Project Report, 2006).
Hypoxia coverage: According to the data shown in Fig. 12.11, the Ukrainian sector of northwestern shelf continued to experience successive large scale hypoxia shocks (> 10,000 km2) once every few years. Although no published data are available after 2001, the hypoxic areas were reported to decrease in the present decade except some short-term events in localized shallow regions upstream and downstream sides of the Danube delta region (e.g. summer 2005). No hypoxia was reported in Bulgarian waters as well as national waters of other Black Sea states. Fig. 12.12 displays the summer 2001hypoxia event in terms of variations of oxygen saturation values at different locations off the Sf. Georghe transect.
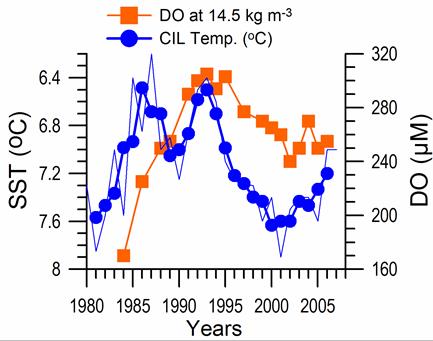
Fig.�� 12.13. Long-term variations of winter dissolved oxygen concentration within the layer of density surfaces σt ~14.45-14.6 kg m-3 in the offshore region the eastern coastal waters during 1984-2004 and summer-autumn mean CIL temperature of the interior basin. The oxygen data are provided by Yakushev et al. (2008).
Subsurface oxygen concentration in the interior basin: The level of sub-surface oxygen concentration in the deep region of eastern basin provides an independent assessment for the present state of basin-scale eutrophication. The long-term data of winter dissolved oxygen concentration within the layer of σt ~14.45-14.6 kg m-3 density surfaces (i.e. immediately below the euphotic zone) in the offshore region of the eastern basin during 1984-2004 reveal an increasing trend from 170�� μM at 1984 to 300 μM during the early 1990s, and a reverse trend during the 1990s with the values varying in the 240-270 μM range during the present decade (Fig. 12.13). Lower values in the present decade with respect to the early 1990s can however be hardly explained by higher rate of oxygen utilization during the remineralization of organic matter provided the fact that the present decade is known to be less eutrophic and hence less productive than the 1980s. This structure therefore contradicts with a priori expectation from the eutrophication perspective.�� A more likely explanation is the degree of ventilation from the surface in response to climatic changes. The former process (i.e. the oxygen utilization) is particularly important during the warm and more productive period of the year and causes oxygen depletion whereas the latter (i.e. the surface ventilation) contributes to its enrichment in winter months. In the case of higher rate of ventilation, more oxygen stored within the oxycline reduces the rate of oxygen depletion in subsequent months and thus support more favourable oxygen conditions during summer months. This link is shown in Fig. 12.14 using the summer-autumn CIL temperature as a proxy variable of climatic changes. The decadal trend of increase of subsurface oxygen coincides with the cold climate period associated with higher rate of atmospheric oxygen flux at the surface. On the contrary, subsequent milder and warmer winter years of the 1990s (i.e. the warming trend of CIL temperature) with more limited atmospheric oxygen supply coincide with the decreasing trend of subsurface oxygen concentration. Cold years 2003-2004 coincide again with relatively higher subsurface oxygen concentrations.
Recalling that the 1985-1993 period was characterized by highest level of plankton production, the accompanying cold winter climatic conditions, on the one hand, pre-conditioned the system for more intense spring production and, on the other hand, prevented excessive oxygen depletion of subsurface levels by storing more oxygen below the euphotic layer, which otherwise would likely cause a broader suboxic layer. Conversely, relatively mild winters after the early 1990s set unfavourable conditions in terms of oxygen ventilation even though biological production was lower than the previous decade.
12.5. Chemical pollution
Discharge of insufficiently treated sewage introduced microbiological contaminants into the Black Sea and posed a threat to human health, development of sustainable tourism and aquaculture. The Black Sea was particularly vulnerable to solid wastes dumped into the sea from ships and coastal towns as any floating or half-submerged waste was inevitably washed ashore. Some beaches have had a high accumulation of garbage presenting a risk to marine animals and humans.
Ballast water and other types of illegal discharges continued to be an important source of petroleum pollution with a high level of spatial heterogeneity. Oil enters the sea as a result of operational discharges of vessels and accidents, as well as through land-based sources. The present level of oil pollution is not high in the open sea but is unacceptable in many coastal areas. The total amount of oil spilt into the Black Sea was generally less than 50 tonnes during 1996-2004 except 260 tonnes in 1997 and 530 tonnes in 2003 (Fig. 12.14). They were discharged by spill accidents of around 10-30 per year with the exception of 61 relatively low spill accidents reported in 2001.
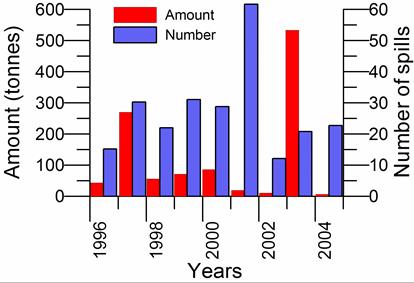
Fig. 12.14. Total of number of oil spills and amount of oil spilt during 1996-2006 on the basis of data reported by countries to the BSC.
The mean concentration of total petroleum hydrocarbons (TPHs) in general exceeded the Maximum Allowed Concentration limit (MAC~0.05 mg/l) almost everywhere in the sea, but increased up to 25.0 mg/l along tanker and shipping routes between Odessa, Novorossiysk and Istanbul, as it may be inferred from the composite satellite map shown in Fig. 12.15. The extremes in coastal shallow waters (Fig. 12.16) must be a result of local spills from ships calling at ports and bunkering and discharges from the waste water systems of large cities. The current monitoring network is not dense enough to monitor oil spills at a desired level. It will be useful to support field monitoring by routine satellite and/or aircraft images, as this is done in Europe.
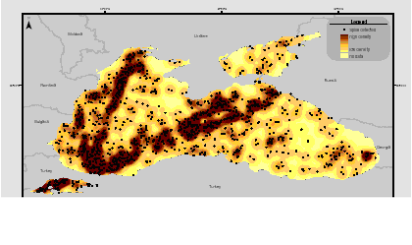
Fig. 12.15. Composite map of oil spill anomalies in the Black Sea during 2000-2002 and 2004 based on the images taken by Synthetic Aperture Radars (SARs) of European satellites ERS-2 and Envisat (http://serac.jrc.it/midiv/ maps/). The oil spill density has been spatially normalized to the spill widths. The darker areas signify the high anomaly regions.
Pesticides and heavy metals continue to pollute hot spots near certain well-identified sources. PCBs which are or have been produced for industrial use are now mostly restricted to closed systems, and the use of DDT has been banned or restricted in most countries of the Black Sea. For example, the use of organochlorine pesticides was controlled in the late 1970s in Turkey and Romania, but effective restrictions were not imposed in Turkey until the 1980s. Despite these restrictions, recent studies have shown high concentrations of DDT in Turkish rivers, streams, and domestic and industrial discharges, which indicate their illegal use. The use of these chemicals in other Black Sea countries is currently unclear. Nevertheless, on the basis of available data, pesticide (total DDT and HCH) concentrations in surface waters were typically below their detection limit (0.05 ng/l), except for some very dense patches being detected occasionally. Generally, the present pesticides pollution arises due to their huge amount stored in the agricultural fields or old dilapidated storage places in the past. Concentrations of DDTs, HCHs and PCBs in Black Sea fish and mammals are also high in comparison to those reported for some other regional seas.
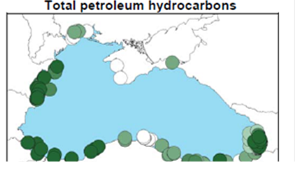

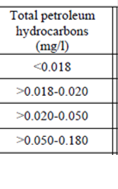
Fig.12.16. Mean concentration of total petroleum hydrocarbons in surface waters (0-10m depth) around the Black Sea periphery during 2000-2005 (after TDA, 2007).
Except some hot spot regions with clear anthropogenic influence from the main land-base sources, heavy metal concentrations are generally lower than their Maximum Allowed Concentration (MAC) levels in coastal waters, and close to their natural background values in offshore waters. In particular, the copper and chromium pollutions were wide-spread over the NWS. High chromium concentration was also found along the Crimea coast. A tendency of decreasing maximum mercury and cadmium concentrations in the Danube Delta region has been noted during last 10 years. ��
The rather sparse data set makes it difficult to realistically assess the long-term trends of either TPHs or total DDT and HCH concentrations in sediments. Nevertheless, it may be stated that bottom sediments of almost the entire coastal waters around the sea presently contain high levels of total DDT and HCH pollutions without any clear indication of reduction over the last 13 years of measurements. Sediments in many hot spots contain total DDT and HCH concentrations 5 times higher than their MAC levels, but most serious of them are limited to�� the NWS. Highest concentrations of DDTs are traced in lipid rich sediments in the Romanian and Ukrainian coastal waters that are under the influence of River Danube discharge. Elevated concentrations are also reported for sediments in the vicinity of Odessa and Port Constanta. Other pesticides were close to their detection limits except rather high concentrations of hexachlorobenzene in sediments along the Romanian and Bulgarian coasts.
Selected chlorinated compounds in sediments and organisms are ranked as DDTs > HCHs ≥ PCBs > HCBs. As with hydrocarbons, highest concentrations are situated in the Danube delta region and the port Constanta. Among the PCBs, the toxic di-ortho and mono-ortho compounds predominate. The pattern as well as the major sources of PCBs in other countries surrounding the Black Sea are unclear. Concentrations of lindane and other HCH isomers are low in samples from the Ukrainian coastline, Russian Federation and Turkey. Elevated concentrations in samples from Romanian coast stations, under the influence of the River Danube, indicate substantial usage of HCH as a pesticide in the River Danube watershed. The values found at Odessa, the Bosporus entrance region, and Sochi suggest HCH contamination. HCB were found in sediments at much lower concentrations than the other compounds. Its highest values were recorded along the Romanian and Ukrainian coastlines adjacent to the River Danube.
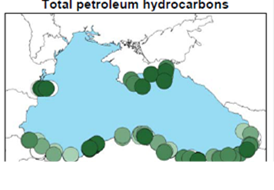

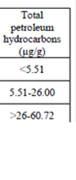
Fig. 12.17. Mean concentrations of total petroleum hydrocarbons in sediments around the periphery of the Black Sea during 1996-2006 (after TDA, 2007).
During the last 10 years, mean concentration of TPHs in bottom sediments of coastal regions was about 1 MAC (50 ��g/g), but much higher concentrations were recorded in sediments collected from large ports, oil refinery and terminals in Romanian, Turkish and Russian waters (Fig. 12.17). They generally decreased offshore. Irregular and often patchy sampling in many parts of the sea greatly limited a better evaluation of the TPH pollution. A more systematic monitoring program is desired for a better description of petroleum hydrocarbons pollution in bottom sediments especially in the vicinity of main oil sources.
Radioactive substances which have been introduced to the Black Sea by the Chernobyl accident in 1986 do not pose a risk any more.
12.6. Biodiversity change, habitat destruction, alien species invasions
Phytoplankton: The annual-mean phytoplankton biomass over the Ukrainian, Romanian and Bulgarian shelf waters (Fig. 12.18a) experienced a decreasing trend from ~10 gm-3 during the late 1980s and the early 1990s to less than 4 g m-3 during the 2000s. Relatively high values greater than 20 g m-3, however, occasionally measured in hot spot regions along the entire coast, an example of which is shown in Fig. 12.18a near Batumi (Georgia) in 2005. A decreasing trend of phytoplankton biomass from 20 g m-2 to 4 g m-2 was also observed in interior basin up to 2002 followed by an increase to more than 10 g m-2 in the subsequent years (Fig. 12.18b). Assuming that phytoplankton biomass in western coastal waters is homogeneous over 10-15 m layer, its integrated biomass of 40-60 g m-2 is roughly five-folds higher than the interior waters biomass that imply extensive ongoing phytoplankton production within the inner shelf waters of the western basin. On the other hand, a two-fold increase in species diversity from roughly 20 to 40 (Fig. 12.19a), decreasing phytoplankton:zooplankton biomass ratio (Fig. 12.19b) together with diminishing bloom frequency and tendency of shift of annual maximum algal development from summer to the classical spring and autumn forms during the present decade indicate a tendency of algal community towards its normal status. In fact, the shifts in phytoplankton taxonomic composition have become more and more evident since 2000. The blooms of non-traditional species (Dactylosolen fragilissimum, Pseudosolenia calcar-avis, Akashiwo sanguinea, Emiliana huxleyi, microflagellates) are more frequently observed and a high number of new species have successfully adapted to the Black Sea environment, some of them however potentially toxic.
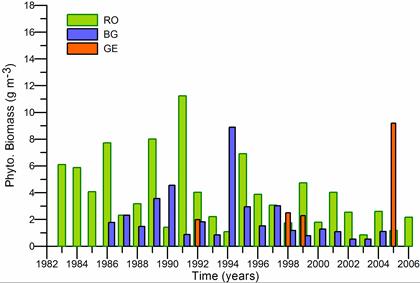
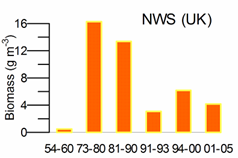
Fig.12.18a. Long-term variations of annual-mean phytoplankton biomass (g m-3) averaged over all stations in the Romanian (RO), Bulgarian (BG), Georgian (GE) shelves as well as the coastal northwestern sector of Ukrainian shelf (NWS-UA, after Nesterova, 1987, see Chapter 5 of this report).
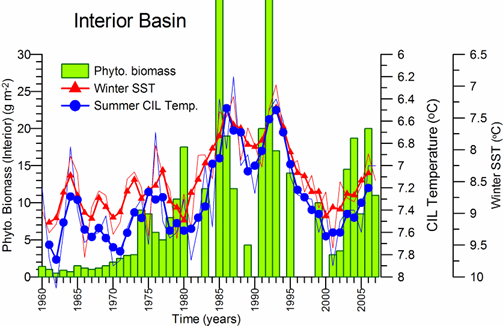
Fig. 12.18b. Long-term variations of summer-autumn mean phytoplankton biomass (g m-2) (vertical bars; after Mikaelyan, 2005), the mean CIL temperature (oC) (blue dots; after Belikopitov, 2005) averaged over all stations within interior basin and mean winter (December-March) sea surface temperature (SST) as an average of Hadley2, NCEP-Reynolds and Pathfinder5 data sets. The phytoplankton biomass is expressed in terms of euphotic zone integrated values.
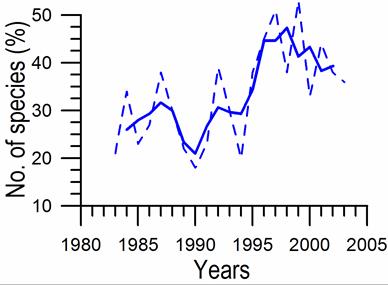
Fig. 12.19a. Long-term changes in species number contributing to annual phytoplankton biomass along the Bulgarian coastal waters (after Moncheva, 2005).
Diatiom/dinoflagellate biomass ratio is normally considered as an indicator for the change in phytoplankton taxonomic structure. Its classical spring-summer value of 10:1 for an undisturbed system was used to be maintained in the Romanian coastal waters during the 1960s and 1970s by 92% and 75% contribution of diatoms, respectively. This ratio then altered in favor of dinoflagellates during the 1980s when its biomass constituted almost 60-70% of total phytoplankton (Fig. 12.20). The diatom constituted more than 50% of the total phytoplankton during the 1990s whereas dinoflagellates became the dominant group again during the recent decade. Similar changes were also observed in the Bulgarian coastal waters and within the interior basin.��
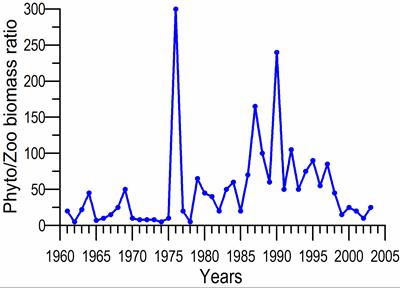
Fig. 12.19b. Long-term changes annual-mean phytoplankton to edible zooplankton biomass ratio along the Bulgarian coastal waters (after Moncheva, 2005).
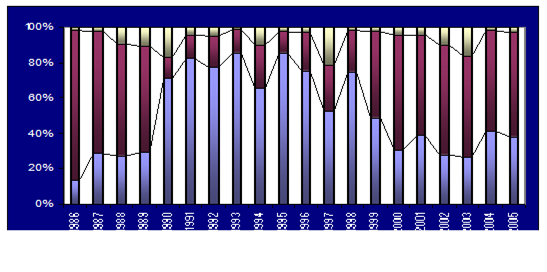
Fig. 12.20. Long-term change in percentage of biomass of main algal groups in Constanta monitoring station during 1986-2005 (after Boicenco, see Chapter�� 5 of this report). ����
The shift in phytoplankton species composition from diatom (siliceous) to dinoflagellates (non-siliceous) during the 1980s is consistent with the decreasing silicate concentration and thus reduction in Si:N ratio of the Danube nutrient load during the 1980s. As the Danube SiO4 load increased in the 1990s, diatoms were no longer limited and started dominating the community structure against dinoflagellates. In the present decade, decreasing SiO4 load (except 2005) led to domination of the community structure by dinoflagellates again.�� Furthermore, cooler (warmer) spring-summer conditions in the 1980s (1990s) provide growth advantage for dinoflagellates (diatoms) (Stelmakh, 2008).
The phytoplankton data from the interior basin indicate domination of phytoflagellates and coccolithophores in the annual bloom structure during the present decade. The species shift towards carbonate-producing coccolithophores in coastal waters during May-June has significantly affected sea water chemistry in terms of alkalinity and pH. Predominance of small-sized flagellates during the recent years may be a major reason for the proliferation of gelatinous zooplankton (e.g. Noctiluca scintillans) at the expense of edible mesozooplankton and fish eggs and larvae.������
Trends in phytoplankton biomass may not always be a firm indicator for the state of eutrophication due to strong modulation of bloom intensity and species structure by climate-induced changes. For example, anthropogenic-based nutrients that were accumulated into the subsurface waters of the interior basin and/or sediments of the shelf waters are brought into the surface layer more effectively in cold winters that then promote more intense new production-based spring blooms and subsequently stronger regenerated production in summer months. This is clearly shown by the correlation between increasing and decreasing trends of interior basin phytoplankton biomass and the cooling and warming phases of the mean May-November CIL temperature during the 1980s and 1990s, respectively (Fig. 12.18b). The subsequent increase of phytoplankton biomass in 2003-2007 may also be explained by the recent climatic cooling trend. Moreover, the phosphorus limitation constitutes as an additional factor for the decrease of phytoplankton biomass along the western coastal zone during the 1990s and the present decade.
Even if the phytoplankton biomass has been improved recently, it does not indicate a stable structure; instead it implies a transitional phase with fragile ecological conditions under relatively high nutrient concentrations. ����������
Bacterioplankton: The annual-mean bacterioplankton abundance within the northwestern shelf during 1979-2008 (Fig. 12.21a) resembles closely the long-term changes in phytoplankton biomass. It reveals an increasing abundance from the average value of 1.2 million cells ml-1 during the late 1970s and the early 1980s (the range: 0.3-2.6�� million cells ml-1) to 3.3 million cells ml-1 (the range 1.0-7.3 million cells ml-1) in 1990-1991. It was followed by an abrupt drop to ~2.5 million cells ml-1 in 1993-1994 and a steady decreasing trend to 1.5 million cells ml-1 up to 2008. The average bacterioplankton abundance was therefore reduced during 2003-2008 by more than twice with respect to 1990-1992. This reduction was most likely caused by the decrease in total concentration of autochthonous and allochthonous organic matter that are more easily assimilated by bacteria; thus implying a reduction in organic pollution in the northwestern Black Sea. This should be connected to the decrease in the intensity of algal blooms and lower mortality rates in bottom fauna. Higher abundance was particularly observed in the vicinity of Danube delta. The measurements in the Bulgarian coastal zone also showed a stable annual abundance remained around 1.0 million cells ml-1 since 1994.
The NWS bacterioplankton abundance (Fig. 12.21b) attains lowest values in winter (January-February) and highest in summer under high organic matter accumulation in water column. During the intense eutrophication phase (1983-1997), abundance greater than 2 million cells ml-1 prevailed from March to October with the highest population close to 3 million cells ml-1 in August. During 2004-2007, maximum abundance reduced to 1.5 million cells ml-1 and summer abundances varied around 1 million cells ml-1 from April-to-September.
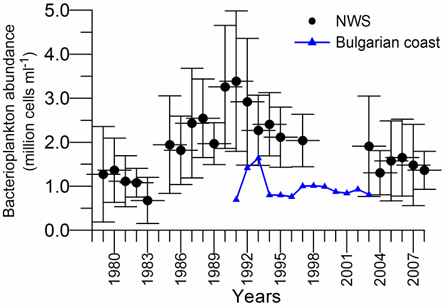
Fig. 12.21a. Long term annual-mean changes of bacterioplankton abundance in the surface layer of northwestern and Bulgarian coastal waters (redrawn from Kovalova et al., 2008).
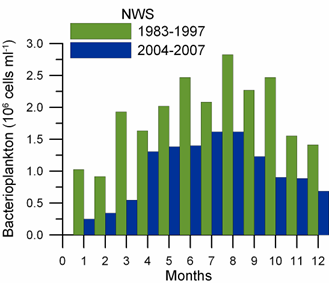
Fig. 12.21b. Long term monthly-mean changes of bacterioplankton abundance in the surface layer of northwestern coastal waters in the Black Sea (redrawn from Kovalova et al., 2008).
Edible Zooplankton: The annual-mean edible zooplankton biomass formed by averaging of the Ukrainian, Romanian and Bulgarian data sets exhibited a declining trend from ~300 mg m-3 in 1960 to 20 mg m-3 in 1990, persisted this level up to 1995, and then fluctuated interannually within 50-200 mg m-3 range during 1996-2004 (Fig. 12.22). These fluctuations were mostly provided by the intermittent recovery of edible zooplankton (up to ~300 mg m-3) within the Romanian shelf contrary to only a slight improvement (~100 mg m-3) in the Ukrainian NWS and the Bulgarian shelf. According to this amalgamated data, the highest biomass registered within 1996-2004 was almost half of the biomass attained prior to the 1970s.
On the other hand, edible zooplankton biomass followed a different track of changes in the northeastern basin; it fluctuated around 10��5 g m-2 during 1960-1990, maintained its minimum level (2.0 g m-2) during 1991-1993, and then experienced a pronounced rising trend to 20 g m-2 in 2000-2004 and 25.0 g m-2 in 2005-2008 (Fig. 12.22). Its values during the present decade were the highest ever registered since the 1960s. Assuming that zooplankton population is uniformly distributed within the upper 50 m layer, integrated biomass of the western coast during 1996-2004 varied between 2.5 and 7.5 g m-2 that were comparable with the Cape Sinop�� but substantially lower than the northeastern basin (Fig. 12.22).��
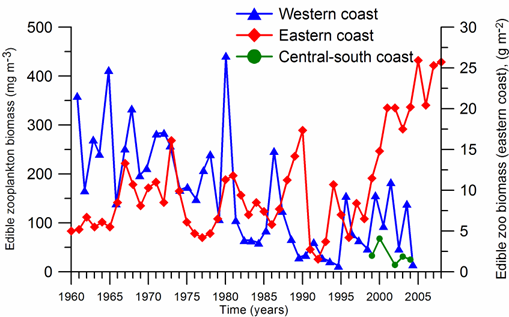
Fig.12.22. Long-term variations of the annual-mean edible zooplankton biomass in the northeastern basin (g m-2) and the western coast (mg m-3) obtained by averaging the Romanian, Bulgarian, and the northwestern Ukrainian data sets. Also included for comparison is the edible zooplankton biomass (g m-2) measured near the Cape Sinop in central part of the Turkish coast (after�� Shiganova et al., see Chapter 6 of this report).
Although fodder zooplankton biomass has not yet increased to a level observed in the 1970s in the NWS and western coastal waters, its community was partially recovered in terms of species diversity. The community structure was re-organized by an increase in abundance and biomass of copepods and cladocerans, such as A. tonsa, P. mediterranea, C. euxinus and A. patersoni which were almost absent during 1980s-1990s. The extinct species P. mediterranea, being an indicator of non-eutrophic waters, has re-appeared since 2000 as a sign of positive ecosystem changes. Similar changes were also noted within the northeastern basin.
Fig. 12.23 depicts distribution of the summer edible zooplankton biomass over the basin based on the compilation of all the available data during 1954-1995. It reveals considerable patchiness in accord with the meso-scale circulation structure (Fig. 12.2). Biomass variations follow closely meanders of the Rim Current with higher biomass within coastal anticyclonic eddies at onshore side of meanders. Its most distinctive example is shown near the southeastern corner of the sea occupied by the well-known quasi-permanent Batumi gyre.����������
Gelatinous zooplankton: According to recent observations (1998-2004), Mnemiopsis biomass had a decreasing trend following its population control by Beroe after 1998. Nonetheless, M. leidyi can occasionally be abundant in the northwestern and western coastal waters (Figs. 12.24), in contrast to deeper part of the western shelf and the northeastern basin where the share of A.aurita was increased due to its competitive advantage under low Mnemiopsis populations. As one of the worst cases, edible zooplankton biomass in the Danube delta region constituted only 10% of the total zooplankton structure during 2003-2007; the rest was dominated by the combination of Mnemiopsis, Aurelia and the opportunistic species N. scintillans. On the premise of low edible zooplankton and high gelatinous and opportunistic species, the western-northwestern inner shelf waters therefore do not show a stable zooplankton structure within the present decade, but a sign of recovery of mesozooplankton community structure is well-marked within the northeastern basin.
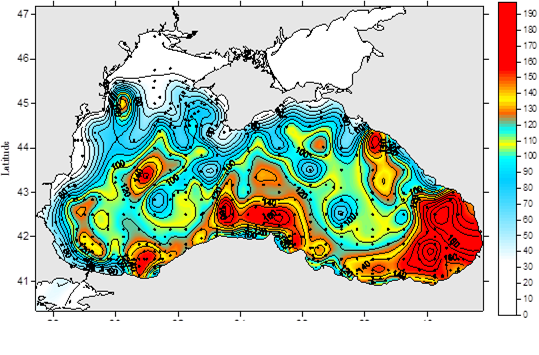
Fig. 12.23. Distribution of summer edible zooplankton biomass (mg m-3) during 1954-1995 (after Temnykh, 2006).
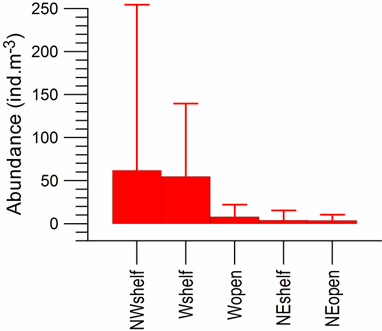
Fig. 12.24. Mean Mnemiopsis leidyi abundance (ind.m-3) in the Northeastern (NE), North-Western (NW), and Western (W) Black Sea inshore and offshore waters during the summer 1998-2004 (redrawn from Kamburska et al. 2006).
As for the long-term variations of phytoplankton, zooplankton biomass and community structure also appear to be strongly regulated by climatic variations. Relatively mild years with warmer winter temperatures favour more efficient Mnemiopsis and edible zooplankton growth, whereas severe years with colder winter temperatures limit edible zooplankton production albeit producing stronger spring phytoplankton blooms and promote more favourable N. scintillans and A. aurita development. The spring temperature conditions are particularly critical for the intensity and species succession of zooplankton production. Mnemiopsis attained higher biomass when August surface temperature was relatively high as in the case of 2000-2001 and 2005 or lower biomass as in the case of relatively cold August temperatures during 1996-1998 and 2003-2004.
Macrophytobenthos: The red algae Phyllophora field in the northwestern shelf was known to be one of the most extensive macrophytobenthos habitats in the world. It was not only an important generator of oxygen but also the nucleus of benthic community involving more than 100 species of invertebrates and more than 40 species of fish. Following the deterioration of environmental conditions since the early 1970s as a combination of reduced transparency, lifting of mud particles in the water column during bottom trawling and hypoxia, the settlement size and stock of phyllophora field reduced from about 9 million tons to 8 thousand tons in 2000. Phyllophora harvesting therefore ceased practically after 1996. The recent observations indicated a sign of their re-establishment within the outer shelf whereas no apparent recovery has yet been evident close to the mouths of Danube and Dniester Rivers in particular and shallow coastal zone of the NWS in general. Its total harvesting of 0.5 thousand tons during the recent years had no significant commercial value, but suggests their ongoing degradation. A similar deterioration of Phyllophora biomass also continues along the northeastern coastal zone. For example, its biomass of 1.4 kg m-2 along 20 m isobath during the 1970s reduced to 0.5 kg m-2 during 1998 and disappeared during 2005. The same also holds in shallower regions.
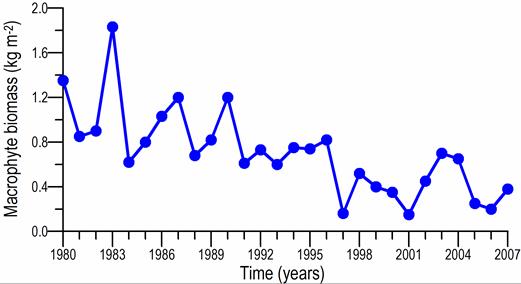
Fig. 12.25a. Long-term change of total macrophyte biomass (kg m-2) in the northwestern shelf dominated by small, opportunistic species (after Minicheva, see Chapter 7 of this report).
Due to intense eutrophication, Cystoseireta phytal zone has been reduced to a narrow inshore strip shallower than 10 m due to the lack of sufficient light for photosynthesis in deeper regions. Beyond 10 m depth zone, large perennial macrophytes with a thick talus and longer life cycle were replaced with a few small branchy, filamentous, opportunistic-type algae species having rapid growth but relatively short life cycle. Nevertheless, the overall biomass of opportunistic species group had a declining trend by the beginning of 1990s and their present level suggested a three-fold reduction (Fig. 12.25a). Similarly, along the northeastern coast, Cystoseira fields that were used to stretch up to 20-30 m in the 1970s with biomass >3.0 kg m-2 were limited into the innermost 5 m zone during the 1980s (Fig. 12.25b). The present status shows a slight recovery at depths shallower than 10m zone (Fig. 12.25b). Floristic diversity of macrophyte communities in Zernov�����s Phyllophora field started increasing even though the tendency of increase in Ochrophyta species is minor with respect to ongoing intensive development of ecologically active filamentous algae in relation to the increase of transparency and availability of high nutrient content in the bottom sediments (Fig. 12. 25c). In spite of such positive signs, it is still difficult to assert an appreciable basin scale restoration. Full recovery of historical Phyllphora field is still not evident. Its coverage both in winter and summer is less than 10% with respect to the pristine state, and its role as habitat was taken over by filamentous algae.
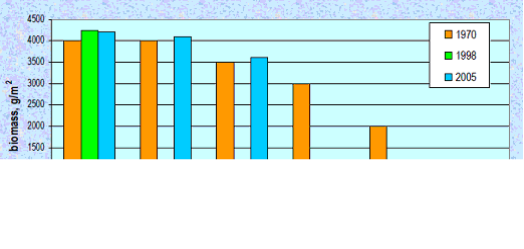
��Fig.12.25b. Cystoseira spp. biomass at different depths along the northeastern coastal zone during 1970, 1988 and 2005 (after Kucheruk, 2006).����
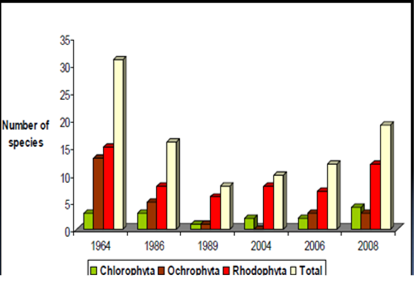
Fig.12.25c. Changes in floristic diversity of macrophyte communities in Zernov�����s Phyllophora field (after Friedrich et al., 2008).
Macrozoobenthos: The most notable changes in zoobenthos community of the 1980s and 1990s in response to intensifying eutrophication and sustained organic enrichment of sediments were lower species diversity, reduced abundance and biomass of benthic populations, and thus a more simplified community structure dominated mostly by opportunistic and invasive species with high total abundance but low total biomass, increasing role of hypoxia-tolerant groups (bivalve molluscs), high fluctuations of populations. Despite such severe changes, observational studies since the mid-1990s were limited and were based on random samplings with irregular periodicity. The measurements suffered from deficiencies in sampling quality and processing, organism identification, lack of general consensus on benthic biodiversity methodology, and insufficient experts. Therefore, the current state of knowledge on the existing state of zoobenthos structure involves many uncertainties to make a reliable assessment.
Available data for the western shelf suggest a slight improvement of zoobenthos community structure in terms of species number during the last 10 years (Fig. 12.26). Some species sensitive to hypoxia which became almost extinct started re-appearing. But, the recovery of the crustaceans is incomplete despite their population increase. The mussel Mytilus galloprovincialis population seems to grow under more favourable conditions as they can sustain more than one year life cycle. The current abundance level of opportunistic molluscs����� species, the predatory gastropod Rapana venosa, the bivalves Anadara inequivalvis and Mya arenaria, however continue to dominate the macroobenthos system due to rich trophic resources and their hypoxia tolerance.
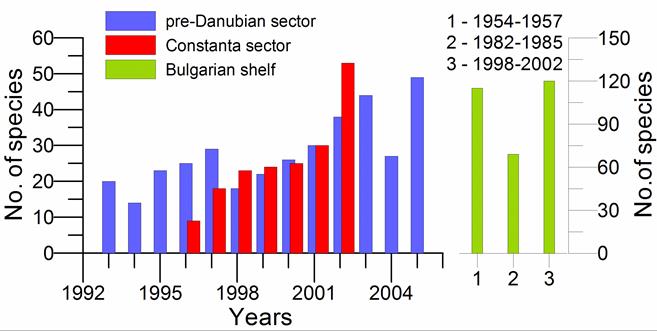
Fig. 12.26. Temporal changes in species diversity of total macrozoobenthos community in the Romanian pre-Danubian and Constanta sectors (left) and the Bulgarian shelf (right) (after Abaza, Todorova et al., see Chapter 8 of this report).
As these modifications signaled beginning of the rehabilitation trend, the general state of this biotic component of the marine ecosystem is still fragile over large areas of the Ukrainian and Romanian shelves and represents clear symptoms of undesirable disturbances, such as patchiness, domination of the zoobenthos system by opportunistic and hypoxia tolerant species as indicators of organic pollution. Shallow, coastal regions remain to be vulnerable to anthropogenic disturbances as compared to offshore areas deeper than 30-50m. The muddy bottom biocoenoses of Modilus phaseolinus at deeper than 50 m has not yet recovered due to impact of hypoxia, opportunistic species, and degradation of bottom by dredging and trawling. Therefore, there are great deals of uncertainty to claim the recovery. On the other hand, the classification algorithm based on the empirical AMBI model (Fig. 12.27) suggests a rather optimistic view that even the Danube delta region has rather moderate pollution level and most part of the NWS is in ecologically good conditions. The conditions gradually progress to the south along the western coast and to the east away from the source region of the pollution and eutrophication.
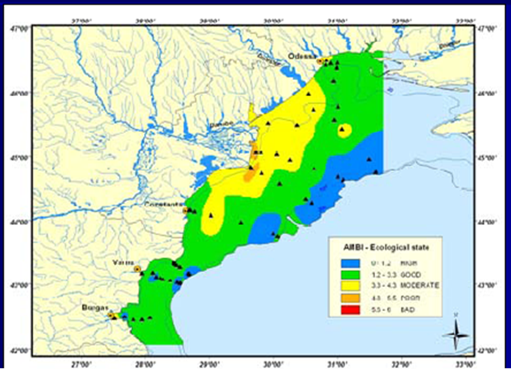
Fig. 12.27. Recent ecological state of he northwestern and western shelves according to the AMBI classification. Yellow and green colours signify moderate and good ecological state, whereas the brown spots are degraded regions of macrozoobenthos (after GEF-UNDP Project Report, 2006).
Introduction of Beroe and its predation on Mnemiopsis introduced a major transition in macrozoobentic populations. As shown in Fig. 12.28a for the northeastern coastal zone, over-comsumption of bivalve larvae and the subsequent reduction in the settlement of young bivalves observed during the 1990s were ended after the weakening of Mnemiopsis population. This led to mass settlement of opportunistic alien Bivalvia species Anadara inequivalvis larvae that is a major competitor of the native species Chamelea gallina. Simultaneously, the niche emptied by Mnemiopsis was immediately occupied by the opportunistic invasive predator Gastropod species Rapana venosa. Starvation due to food shortage for such high populations and their predation by Rapana venosa concomitantly led to their population decline which was followed by the population decline of Rapana due to food shortage. The opportunistic polychaeta group took advantage of these conditions in the absence of Rapana and increased at a significant level. It is not clear whether this transient system observed during 2000-2005 is gradually stabilizing in recent years or still continuing to persist.
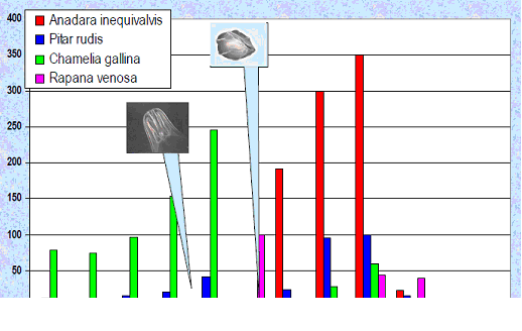
Fig. 12.28a. Changes in dominant zoobenthos species biomass ( g m-2) at the 10-30 m depth range of northeastern Black Sea coast during 1936-2005 period (after Kuchreruk, 2006).
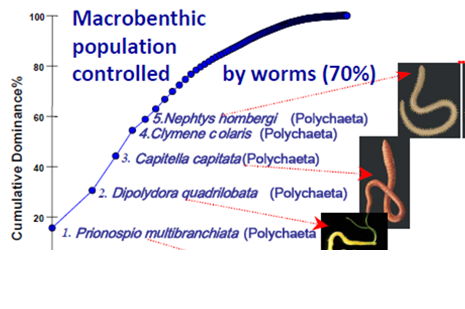
Fig. 12.28b. Species rank of macrozoobenthic population indicating its overwhelming domination by worms in the northwestern shelf (after Friedrich et al., 2008).
The 2008 Poseidon cruise in the NWS indicated a similar spectacular population development of Polychaeta species on soft sedimentary and hard substrate (Friedrich et al., 2008). As they formed 70% of the benthic population, filter feeders constituted only 9% that is a typical indication for eutrophication (Fig. 12.28b). Overall findings of the cruise were small recovery of macrozoobenthos community, strong biomass perturbations, high ecological pressure in coastal areas especially the vicinity of Danube and Dniestr discharge regions, ongoing ��high pressure from Mya arenaria, Anadara inaequivalvis, Rapana venosa survivors, and domination of the macrozoobenthos community by Polychaeta species.
12.7. Status of marine living resources
Pelagic fishes in general and their small-sized plankton-eating types in particular are most abundant species in the Black Sea ichthyocenosis. The total catch main target species European anchovy (Engraulis encrasicolus) constituted 31-75% of the total Marine Living Resources (MLR) during the last 15 years. European sprat (Sprattus sprattus), Mediterranean horse mackerel (Trachurus mediterraneus), Atlantic bonito (Sarda sarda) and bluefish (Pomatomus saltatrix) are the other pelagic fishes in terms of fishing value. The latter three species are large-sized predators which migrate into the Black Sea from the Marmara and Aegean Seas for feeding and spawning in spring and return their native places for wintering in late autumn. The catch around 350,000 �� 100,000 tons suggest partial recovery of major pelagic species after the fishery collapse at 1991 (Fig. 12.29).
From the fisheries perspective, the most important demersal fish species in the Black Sea are whiting (Merlangius merlangus), picked dogfish (Squalus acanthias), turbot (Psetta maxima), striped and red mullets (Mullus barbatus, M. surmuletus), four species of the family Mugilidae, including so-iuy mullet (Mugil soiuy). The total catch of these demersal fish species had a tendency of reduction after 2000. Its present catch size is approximately half of the 1990s (Fig. 12.29).
Among fishes by capture volume, the anadromous fish species pontic shad (Alosa pontica) and three sturgeon species Acipenser gueldenstaedtii, Acipenser stellatus, Huso huso take the last place, but their high consuming and economical value determines their specific role in the structure of the MLR. Stocks of anadromous fishes are formed mainly by the Danube populations. The catch data (Fig. 12.29) suggested their order of magnitude decline from about 5000 tons in 1994 to 500 tons in 1999-2001. A slight increasing trend of their annual catch after 2000 was due particularly to the recovery of Pontic shad.
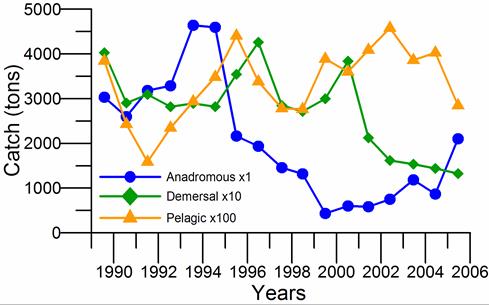
Fig. 12.29. Total catches of main anadromous, demersal and small pelagic fishes in the Black Sea during 1989-2005. The demarsal and pelagic fish catch values need to be multiplied by 10 and 100 to get the observed magnitudes, respectively (after Shlyakhov and Daskalov, see Chapter 9 of this report)
��
During 2000-2005, the most significant threats for fish resources appear to be the illegal fishing and use of destructive harvest techniques as well as the lack of regional cooperative management of fisheries, in addition to eutrophication-induced instability in the food web structure. At present, no recovery of sturgeons spawning and nursery habitat occurred, restocking size of the Dnieper sturgeon populations reduced considerably and the state of sturgeon stocks deteriorated definitely after 1999 with the possibility of collapse not being excluded. The state of Danube shad stocks did not improve; nevertheless the situation is less disastrous as compared to sturgeons. The sprat, anchovy, picked dogfish, and mullet stocks partially recovered in 1995-2005, but the current level of relatively high fishing efforts and catches impose a risk of deterioration of their stocks. The horse mackerel stock continues to be in a depressed state with low stock size and there is no sign of its recovery. The whiting and turbot stocks are exploited rather intensively and declining.
Among the mollusks, the clams (Chamelea gallina, Tapes spp.), the Mediterranean mussel (Mytilus galloprovincialis), and the sea snail (Rapana venosa) have the greatest commercial value. The former two species are harvested only by Turkey and the latter species by all countries of the region except Romania. In 2000�����2005, mussel harvesting has had a decreasing trend in the Ukrainian sector but as a whole the state of mussels improved in the Black Sea (Fig. 12.30).
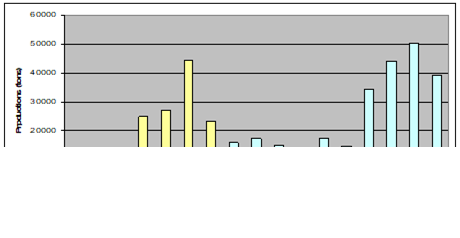
��Fig. 12.30. Total catch of main mollusks in the Black Sea in 1989 -2005 (after Shlyakhov and Daskalov, see Chapter 9 of this report).
The current status (2000-2005) of the MLRs, in general, suggests an improvement with respect to the collapse period (1989-1992), but the overall situation is inferior when compared with the baseline state (1970-1988). The highly variable stock dynamics and lack of effective control measures may quite likely lead to sharp stocks decline in the future. In order to avoid this risk and to achieve sustainable fishery development, implementation of a regional management strategy is essential.
The harbour porpoises (Phocoena phocoena relicta), common dolphins (Delphinus delphis ponticus) and bottlenose dolphins (Tursiops truncatus ponticus) are the top predators without any natural enemies in the Black Sea except humans. Their populations were badly damaged during the last four decades due to anthropogenic-induced habitat degradation, depletion of food resources and commercial and intentional killing until the early 1980s. They are supposedly protected by the international agreements, but in practice their conservation status has not been adequately assured yet.
12.8. Conclusions
Briefly, our assessments indicate a tendency of improvement and rehabilitation of coastal ecosystems of the Black Sea after 1995 under constraints for implementation of environment politics and restructured economic activities. The trends of improvement are visible both for water quality parameters and structural and functional properties of biota, when compared with conditions observed from the mid 1970s to the early 1990s. On the other hand, oil pollution still appears to be an ongoing concern along major shipping routes and in coastal areas around river mouths, sewerage outfalls, industrial installations and ports. There is no evidence of significant heavy metal, pesticides and other persistent organic pollutants (such as polychlorinated biphenyls, PCBs, or polyaromatic hydrocarbons, PAHs) in surface waters although elevated levels of these substances in hotspots around industrial centres and ports suggest their continuous monitoring. Following the 1986 Chernobyl accident, the present level of radioactivity does not pose a health hazard to humans and environment but it is important to monitor its changes. Bottom sediments in many coastal regions around the sea continue to possess high levels of TPHs, DDT and HCH pollutions without any major reduction over the last 10 years. Nevertheless, conditions gradually progress to the south along the western coast and to the east away from the source region of the pollution and eutrophication.
The pelagic ecosystem of western Black Sea coastal waters improved noticeably due to weakening of anthropogenic pressures. It is inferred by reduced nutrient inputs and fewer algal blooms, lower algal biomass, recovery of some algal populations, increasing plankton biodiversity, decreasing opportunistic and gelatinous pressures, and re-appearance of some native fodder zooplankton and fish species and increasing edible zooplankton biomass. The current relatively low nutrient inputs, especially phosphorus, were mainly due to the economic recession after the collapse of the former Soviet Union. The phosphorus limitation prevails most notably along the coastal zone whereas the nitrogen limitation dominates within the outer shelf and deep basin. The climatic warming during the 1990s and the early 2000s also played an important role for the limitation of primary production. Its relative contribution to the overall improvement of the pelagic system of the western coastal and shelf waters remains to be substantiated by the modeling studies. A switch to the cold climatic conditions in the future (as in the 1980s) may promote more intense phytoplankton production and thus disturb the present quasi-stable pelagic ecosystem structure.
The prominent changes were encountered in the structure of benthic communities of the Romanian and Ukrainian coastal waters. However, recovery of the benthic ecosystem appears to be less certain although an improvement on regeneration of macrophytobenthos and macrozoobenthos is suggested by the available data. In the western Black Sea, large areas of the seabed that had been suffering from anaerobic conditions ����� a clear symptom of eutrophication ����� started now returning to conditions prior to the 1970s. Hypoxic events are now less severe and less frequent than they were used to be in the past. The available data also show some unavoidable indications that the present status of benthic ecosystem is highly fragile and susceptible to further anthropogenic and environmental impacts. The regions shallower than 30-40 m depths still show symptoms of some undesirable disturbances, the most important of which is exerted by the alien opportunistic species such as bivalve species Mya arenaria, soft-clam species Anadara inequivalvis, gastropod species Rapana. Once again, higher organic load to the benthic community which likely develops during cold-climatic conditions may further disturb the benthic structure.��
Fish stocks over the basin are still out of balance, mainly as a result of overfishing but also due to eutrophication. For example, eutrophication-induced unfavourable conditions reduced sharply catches of demersal fish with high commercial value such as flounder and turbot and replaced them with large quantities of small pelagics such as sprat in the western shelf. As a consequence, the Ukrainian and Romanian fishing fleet in the Black Sea almost collapsed. The additional impact of overfishing exacerbated the decline of high trophic level fishes relative to low trophic level fishes and multispecies fishery is unsustainable during the present decade. Anchovy remains to be the top predator species of the Black Sea ecosystem together with sprat along the western coast. Illegal fishing and destructive harvest techniques, lack of regional cooperative fishery management, eutrophication-induced instability of the food web structure constitute ongoing major threats for fish resources.
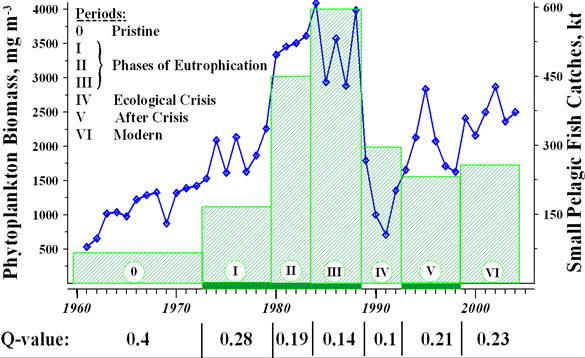
Fig. 12.31. Long-term changes of Q-value defined as the ratio of pelagic fish catch (in ktons y-1) to phytoplankton biomass (in mg�� m-3) as a measure of ecosystem vulnerability to the changes by external stressors (after Yunev et al., 2008).
Recently, Yunev et al (2008) proposed a diagnostic method to assess the long-term improvement of pelagic ecosystem. It was based on the ratio of pelagic fish catch (in ktons y-1) to phytoplankton biomass (in mg�� m-3) referred to as Q-value to measure efficiency of the high energy food web chain (phytoplankton-zooplankton-small pelagic fish) since the 1960s. Phytoplankton biomass was constructed from the station network of all available measurements from the Bug River region in the north to the Cape Kaliakra region in the south. The Q-value (=0.4) was highest during the pristine state and deteriorated gradually up to 0.10 during the early 1990s of anchovy collapse and Mnemiopsis population outburst. Thereafter, it increased to 0.21 during the 1990s and 0.23 during the present decade in response to decrease in phytoplankton biomass and increase in small pelagic stock recovery. The current Q-value of 0.23 was still roughly half of its pristine value and indicated low resilience of the Black Sea ecosystem and high vulnerability to external stressors.
The present ecosystem structure is still different from that documented during the 1960s, and most likely it will never revert back to the pristine state. A more likely scenario is adaptation of the system to new conditions where it will eventually be stabilized. However, it is too soon to assert its stabilization today due to prevailing relatively high nitrogen concentration in the water column and sediment. The complexity and inherent nonlinear response of the ecosystem to external drivers and their internal feedbacks make unclear how the pelagic and benthic systems will respond to further stresses that may likely be introduced by climate changes, future agricultural and industrial development as economies of the riparian states recover. Its stabilization partly depends on natural evolution of the system under the concurrent impacts of climate change; eutrophication level, invasive species populations, and sustainable consumption of fishery resources. But it may partly be controlled by a carefully designed and implemented integrated and adaptive management strategy that ultimately needs to take firm decisions by policy-makers in the riparian countries.
Restoration of ecosystems is generally a long-lasting process that depends on the accomplishment of the conservation, protection and management measures both at national and regional level. In this respect, stress reduction interventions should be implemented in order to achieve improvement of environmental conditions in the coastal zone of the Black Sea and the sea itself. The most critical ones are the reduction of the terrestrial nutrient load from the catchment basin by investing in high technology waste-reduction projects and intensive agricultural practices, firm control on commercial fishery by effective regulation of trawls and dredges.
Moreover, the present assessment study indicates some gaps in our knowledge due to the absence of sufficiently comprehensive monitoring data. ��For the success of ecosystem restoration, routine monitoring of the key ecosystem indicators, e.g. set by EEA within the DSPIR framework, should be effectively implemented. This approach will further set a basis for the policy-relevant assessment of the state of the Black Sea environment in the EU context. The DSPIR protocol, however, may require some adaptations to the Black Sea conditions in terms of network of coastal stations, sampling frequency, and sampling depths in order to allow detection of temporal trends and inter- comparison of different areas. To this end, measurements of nutrients, oxygen, chlorophyll concentrations, as well as phytoplankton and zooplankton biomass, abundance and diversity need to be measured on monthly basis at some selected critical sites around of the basin. Also of critical importance is to monitor them not only in surface waters but also below the seasonal thermocline, and close to the bottom. Because majority of processes governing the pelagic ecosystem take place at time scales less than a month either in the surface layer or different parts of sub-surface layer, such high temporal resolution in observational strategy is indeed necessary. Either temporally, spatially and/or vertically coarse resolution measurements may be adequate for a stable ecosystem but will indeed carry a high risk of false assessments for the unstable Black Sea ecosystem.
Monitoring benthic communities needs to be designed to detect subtle changes in community structure through some indices and environmental conditions that drive these changes (e.g. sinking organic carbon flux, organic carbon content in sediments, deep-water oxygen concentration). The most practical approach is to choose some indicator species among the groups known to be opportunistic, disturbance-sensitive or insensitive. Great natural variability of the benthos requires seasonal monitoring at critical sections with many replicate samples. Monitoring chemical pollution level in sediments may be sufficient once a year. Large uncertainty exists on the amount of nutrients entering from the atmosphere and sediments, which therefore need to be monitored regularly around the basin. For example, the continuous measurement on the Zmeiny Island located 40 km away from the Danube Delta and therefore isolated from the local sources of atmospheric pollution indicated approximately 240 ktons y-1 and 16 ktons y-1 of atmospheric nitrogen and phosphorus fluxes when extrapolated over the Black Sea (Medinets and Medinets, 2008). Similar measurements during 2004-2005 in Sevastopol revealed 240 ktons y-1 nitrogen load (Chaykina et al., 2006). These figures are comparable with the loads supplied by the River Danube in recent years.
Ecosystems damaged by human actions for long periods of time show very slow recovery rate later despite of rehabilitation efforts. For example, after all efforts and progressive implementation of EU Directives, so far there has been only limited reduction in eutrophication of the Baltic and North Seas. ��
References
Chaykina A.V., Dolotov V.V., Ilyin Y.P., Konovalov S.K., Kuznetsov A.S., Repetin L.N., Voitsekhovich O.V. (2006) Observational studies of nutrient loads on the Black Sea with atmospheric precipitations. In: Proceedings of The First Biannual Scientific Conference: Black Sea Ecosystem 2005 and Beyond, May 8 2006, Istanbul, Turkey.
Cociasu, A., Lazar, L., Vasiliu, D. (2008) New tendency in nutrient evolution from Romanian coastal waters. Cercetari marine, 38, 7-23.
Friedrich, J., Delacruz, J., Gilbert, A., Lowe, C. Mee, L (2006) Analyzing ecosystem state changes on the north-western Black Sea shelf with conceptual models. In: Proceedings of The First Biannual Scientific Conference: Black Sea Ecosystem 2005 and Beyond, May 8 2006, Istanbul, Turkey.
Friedrich, J., et al. (2008) State of the benthic ecosystem on western Black Sea shelf in early spring 2008. In: 2nd Biannual and Black Sea Scene EC project joint conference on climate change in the Black Sea ����� hypothesis, observations, trends, scenarios and mitigation strategy for the ecosystem. 6-9 October 2008, Sofia, Bulgaria.
GEF-UNDP Project (2006) Trends in nutrient loads from the Danube river and trophic status of the Black Sea: Extended version of a briefing note originally provided to GEF Council on 6 June 2006. Joint Report of the GEF-UNDP Black Sea Ecosystem Recovery Project and the GEF-UNDP Danube Regional Project. 22pp+ Figures and Tables (21pp).
Humborg, C, Ittekkot, V., Cociasu, A., Bodungen, B.V. (1997) Effect of Danube River dam on Black Sea biogeochemistry and ecosystem structure. Nature, 386, 385-388.��
Kamburska L., Schrimpf W., Djavidnia S., Shiganova T., Stefanova K., 2006. Addressing the ecological issue of the invasive species, Special focus on the ctenophore Mnemiopsis leidyi (Agassiz, 1865) in the Black Sea. EUR 22310 EN, JRC-EC Publication office, 59 pp.
Korotaev, G.K., Oguz, T., Nikiforov, A., Koblinsky, C. J. (2003) Seasonal, interannual and mesoscale variability of the Black Sea upper layer circulation derived from altimeter data. J. Geophys. Res.
Kovalova, N.V., Medinets, S.V., Konareva, O.P., Medinets, V.I. 2008. Long-term changes of bacterioplankton and of chlorophyll ���œa���� as indicators of north-western part of the Black Sea ecosystem changes last 30 years. In: 2nd Biannual and Black Sea Scene EC project joint conference on climate change in the Black Sea ����� hypothesis, observations, trends, scenarios and mitigation strategy for the ecosystem. 6-9 October 2008, Sofia, Bulgaria.
Kucheruk, N., 2006. Integrated study of eutrophication and biodiversity in the Russian coastal waters. Proceedings of The First Biannual Scientific Conference: Black Sea Ecosystem 2005 and Beyond, organized by Commission on the Protection of the Black Sea Against Pollution, May 2006, Istanbul.
Medinets, S. and Medinets, V. (2008) Results of investigations of atmospheric pollutants fluxes to the surface of Zmeiny Island in western part of the Black Sea in 2003-2007. In: 2nd Biannual and Black Sea Scene EC project joint conference on climate change in the Black Sea ����� hypothesis, observations, trends, scenarios and mitigation strategy for the ecosystem. 6-9 October 2008, Sofia, Bulgaria.
��Moncheva, S. 2005. Phytoplankton shifts in the Black Sea ����� Driving forces and implication for reference conditions. Proceedings of the JRC Workshop, 26-28 October, 2005-Istanbul.
Nesterova D. A. (1987) Some features of succession of phytoplankton in the northwestern Black Sea. Hydrobiologycheskyi. Zhurnal, 23(1), 16 ����� 21.
Oguz, T., Deshpande, A. G. and Malanotte-Rizzoli, P. (2002) On the Role of Mesoscale Processes Controlling Biological Variability in the Black Sea: Inferrences From SeaWIFS-derived Surface Chlorophyll Field. Continental Shelf Research, 22, 1477-1492.
Rayner, N.A., Parker, D. E., Horton, E. B., Folland, C. K., Alexander, L. V., Rowell, D. P., Kent, E. C., Kaplan, A. (2003) Global analyses of sea surface temperature, sea ice, and night marine air temperature since the late nineteenth century. J. Geophys. Res., 108 (D14), 4407, doi:10.1029/2002JD002670.
TDA (2007) Black Sea Transboundary Diagnostic Analysis.
Temnykh, A., Melnikov, V., Zagorodnyaya, Y., Moryakova, V. (2006) The variability of the Black Sea zooplankton as a derivative of long term dynamics in the water hydrological structure. In: Proceedings of The First Biannual Scientific Conference: Black Sea Ecosystem 2005 and Beyond, May 8 2006, Istanbul, Turkey.
Yakushev, E., Kuznetsov, I., Podymov, O., and�� Belokopytov, V (2008) On the role of Bosphorusin the formation of the Black Sea redoxlayer biogeochemical structure (model based estimating). In: 2nd Biannual and Black Sea Scene EC project joint conference on climate change in the Black Sea ����� hypothesis, observations, trends, scenarios and mitigation strategy for the ecosystem. 6-9 October 2008, Sofia, Bulgaria.
Yunev, O., Shulman, G., Yuneva, T., Moncheva, S. (2008) Long-term changes of ecological quality rating (Q-value) of the Black Sea pelagic ecosystem. In: 2nd Biannual and Black Sea Scene EC project joint conference on climate change in the Black Sea ����� hypothesis, observations, trends, scenarios and mitigation strategy for the ecosystem. 6-9 October 2008, Sofia, Bulgaria.
[2] Since 2003, the neighbouring population of common dolphins in the Mediterranean Sea is included as ���œEndangered���� (EN) in the IUCN Red List of Threatened Animals.
[3] Examples of non-market valuation techniques include expressed preference techniques such as contingent valuation, contingent ranking or discrete choice modeling and revealed preference methods such as the travel cost method, hedonic pricing and production function techniques. (Freeman, 1993).
[4] The concept referred to is the Environmental Kuznets Curve (EKC), which postulates an inverted U-shape governing the environmental performance of countries in relation to their per capita income (Dasgupta et al. 2002). The ���œturning point���� is typically in the range of incomes characterizing middle income countries, such as those in the Black Sea region.
[5] Exceptions include regulations governing aspects of fishing (e.g. mesh size, seasonal openings, etc.), but the enforceability and success of these measures is uncertain (Black Sea Commission, 2007).��
[6] A structural change approach was used to capture the shift between marine system regimes. Initially, the concentration of phosphates was set at 5.5 ��M, its average value in the northwest shelf of the Black Sea during the period. A second set of solution values was based upon a hypothetical 50% reduction in the phosphate level (to 2.75 ��M).
[7] Tourism data presented here is from the World Tourism organization website, http://www.unwto.org/facts/menu.html. Accessed December 17, 2007.