
...
The Ministers Responsible for the Protection of Environment of the Conttracting Parties to the Convention on the Protection of the Black Sea Against Pollution take note of the Report on the Environmental Status of the Black Sea prepared by the Permanent Secretariat of the Black Sea Commission. Recognizing the fact that some positive trend in the state of the marine ecosystem has between observed in recent years, the Ministers nevertheless remain concerned about the fate of this unique water body amd call attention to the challenge sustaining this process in the conditions of expected economic recovery in the Black Sea region.
Ministrial Declaration of the Contracting Parties to the , Sofia, June 2002
Acknowledgements
The Report “The State of the Environment of the Black Sea: Pressures and Trends 1996-2000” was prepared based on national reporting of the Black Sea countries, previous studies and expertise from independent experts that have contributed to the preparation of exhaustive number of technical reports and background papers in the framework of the Black Sea Environmental Programme.
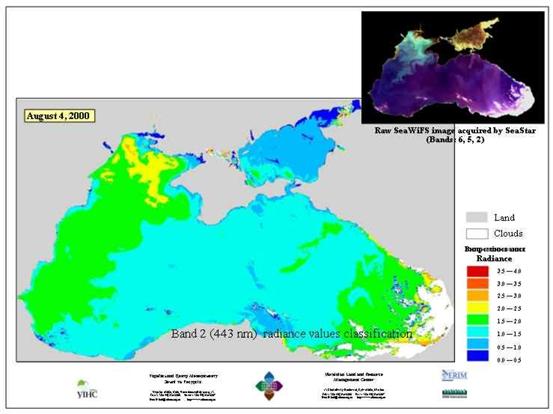
Special appreciation is expressed to the national focal points of the Advisory Groups of the Commission on the Protection of the Black Sea Against Pollution (The Black Sea Commission) and the Permanent Secretariat for the preparation of this report. Special thanks are extended to the Ukrainian Center on Ecological Land Management for its kind permission to use satellite images.
The preparation of this report was financed within the work of the project “Institutional Strengthening of the Commission for the Protection of the Black Sea Against Pollution”, SUB/01/324570, co-financed by the by EC DG Environment. The Black Sea Commission thanks them for their support.
Data presented herein, interpretations, statements, conclusions or any other representations do not represent the view or is in any other way binding to the European Commission.
Table of Contents
1.1 Geography and Hydrography 1-3
1.3 Geographical Scope of the Convention on the Protection of the Black Sea Against Pollution 1-6
2 Pressures on the Black Sea Environment 2-7
2.2 Nutrient Inputs from Land-based Sources 2-7
2.3 Priority Point Sources of Pollution 2-9
2.4 Insufficiently Treated Wastewaters 2-13
2.5 Inputs from Diffuse Sources of Pollution 2-14
2.6 Inputs from Other Pollution Sources 2-15
3.4 Persistent organic contaminants 3-30
3.5 Polyaromatic Hydrocarbons 3-33
3.8 Microbiological pollution 3-34
4 Biology and Biodiversity 4-36
4.1 Bacteria of the Black Sea 4-36
4.2 Phytoplankton and Zooplankton 4-36
Impacts on Benthic Animals 4-44
Commercially Important Species of the Black Sea. 4-47
Key Commercial Conservation Status 4-49
5.1 Fish Nursery and Spawning Grounds 5-54
Annexes
References
List of Tables
Table 2-2 The Estimated Input of Total Nitrogen into the Black Sea [37] 2-7
Table 2-3 The Estimated Input of Total Phosphorus to the Black Sea [22] 2-8
Table 2-4 Total Inputs from Priority Point Sources of Pollution, Georgia, 1996-2000 [21] 2-10
Table 2-6 Total Inputs from Priority Point Sources of Pollution, Ukraine, 1996-2000 [30] 2-13
Table 3-3 Trace Metals in Sediments (μg/g dry weight), mean values [23] 3-28
Table 4-1 Phytoplankton Values in the Ukrainian Black Sea Shelf from 1996-2000 [22] 4-39
Table 4-3 Zooplankton Biomass in the Ukrainian Black Sea Shelf from 1996-2000 [24] 4-42
Table 5-1 Main Wintering Grounds and Fishing Areas of the Black Sea [32, 16, 28, 41, 4, 10] 5-53
Table 5-2 Spawning and Nursery Grounds of Regional Importance in the Black Sea 5-54
List of Figures
Fig. 1 Black Sea Bathymetry [43] 1-4
Fig. 2 Profile of the Hydrogen Sulfide Zone in the Black Sea [43] 1-4
Fig. 3 Satellite Derived Water Surface Temperature 1-5
Fig. 4 Black Sea Currents [22] 1-5
Fig.5 Long-term Inputs of Nitrogen in Coastal Waters of the Russian Federation [36] 2-8
Fig.6. Total Discharges of the Waster Waters into the Black Sea, million m3/year, Ukraine [37] 2-8
Fig. 8 Oil Spills in the Black Sea, 1996-2001 [11, 14, 17, 29, 33, 37 ] 2-15
Fig. 10. Annual Fluxes from Bulgarian Black Sea Rivers - tonnes/year [5] 3-19
Fig. 13. Concentrations of Nutrients in the Territorial Waters of Turkey [7] 3-21
Fig. 13. Concentrations of Nutrients in the Territorial Waters of Turkey [7] (cont€™d) 3-22
Fig. 16. Statistical Estimation of the Probability of Hypoxia [24] 3-24
Fig. 17. Concentrations of Nutrients and Their Ratios in the Black Sea Waters [34]. 3-26
Figure 18 Heavy metal concentrations along the Black Sea coast, Georgia [12] 3-27
Fig. 18a Inputs of Major Pollutants in the Black Sea Shelf, Ukraine [24] 3-28
Fig. 19. Concentrations of Hydrocarbons in the Bottom Sediments in the Black Sea, 1999 [22] 3-29
Fig, 20. Concentration of Petroleum Hydrocarbons in the Waters of Major Ukrainian Ports [22]. 3-29
Fig. 23 Concentrations of DDT in Bottom Sediments of the Black Sea, 1995 [22] 3-31
Fig. 26 Traditional Phytoplankton Bloom in the Black Sea and Azov Sea 4-36
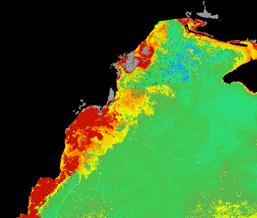
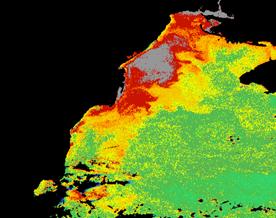
Fig. 27. Comparison of Satellite Images of the North-Western Shelf for Alga blooms [EEA images] 4-37
Fig.28 Chlorophyll A in the Black Sea (1998) [EEA images] 4-37
Fig.29 Chlorophyll A in the Black Sea (2000) [EEA images] 4-38
Fig. 30 Turbidity Map of the Black Sea. 4-38
Fig. 31. Change in Abundance of Mnemiopsis Leidyi, August-September [38] 4-40
Fig. 32. Changes in Biomass of Mnemiopsis Leidyi, August-September [38] 4-40
Fig. 33 Changes in the Biomass of Food Zooplankton in August€“September in the Black Sea [38] 4-41
Fig. 35. Reduction of Zernov€™s Phyllophora Fields [24] 4-43
Fig. 36. Total Fish Catches in the Black Sea, 1996€“ 2000 [32, 18, 28, 41, 4, 10] 4-46
Fig. 37 Dolphinaria in the Black Sea Coastal States [10] 4-50
Fig. 38. Wetlands of the Black Sea [43]. 5-55
Introduction
The environment of the Black Sea including its fragile and vulnerable ecosystem and recreational and aesthetic value as well as wellbeing of the coastal population shows the first attributes of recovery:
Concerted actions of the Black Sea coastal states and assistance of international communities in identifying and resolving problems is ongoing process now. It received its new momentum after Brussels Ministerial Declaration, 2001 that adopted a Black Sea basin wide approach to pollution reduction and enhancement of cooperation of coastal and non-coastal states towards strategic goal of achieving the ecological status of the Black Sea similar to the one observed in 60s€“ abundant in fish, clear in waters, and of natural beauty preserved for current and future generations.
The political will and commitments of the governments of the Black Sea coastal states expressed in Strategic Action Plan for the Rehabilitation and Protection of the Black Sea proved its efficiency in spite of difficulties of transitional economies the most of the Contracting parties are currently experiencing.
Executive Summary
The purpose of this report is to provide policy and decision makers with a brief summary on major regional threats and changes to the Black Sea ecosystem and the environment as whole. The policy measures and management tools for further progress are analyzed in the€˜Report on The Implementation of the Black Sea Strategic Action Plan€™ that presents a clear focus on coordinated regional actions. Annexes to the “Report on the Implementation of the Black Sea Strategic Action Plan€™ present the national answers to a set of questions related to the BSSAP implementation on the national level.
In order to achieve the main objectives of the Convention on the Protection of the Black Sea Against Pollution, the BSSAP requests from the Contracting Parties a set of coordinated policies and measures that are to be implemented in order to preserve, protect and rehabilitate of the Black Sea ecosystem from further pollution and degradation.
The structure of this report was based on the needs of the decision makers and requirements of the Strategic Action Plan for Rehabilitation and Protection of the Black Sea. This Report is complimentary to the Black Sea Commission Report of the Implementation of the BSSAP for the period 1996-2000.
The Report describes in brief the major trends in reduction of pollution inputs with particular attention to the high priority sources of pollution, discharges of the wastewaters that are not in full compliance with national environmental norms, and oil pollution. It also expresses some trends in biodiversity.
The lack of agreed indicators and reporting formats resulted in many omissions and some not well justified conclusions. To the extent possible, these omissions are redressed during consultations with the Black Sea coastal states.
A comprehensive scientific assessment of the state of the environment of the Black Sea is provisioned in the GEF Ecosystem Recovery Project, 2002-2004. Along with data of national monitoring programs, this assessment will form a basis for the State of the Environment of the Black Sea Report in 2006.
The draft Report was circulated, amended and agreed by the Contracting Parties prior to the final publication.
1 Black Sea Geography and the Area of the Convention on the Protection of the Black Sea Against Pollution.
1.1 Geography and Hydrography
|
Black Sea in Figures: Geographical Coordinates 46°33' - 40°56' N. and 27°27'-41°42' E. Drainage Area 2 000 000 km2 Total Shoreline: 4 340 km
The
Area of Water Surface 432000 km2 River inflow 340,6 km3 Water volume 547 000 km3 Maximal depth 2,212 m Salinity 18 % o - 22% o Average fresh water balance 3.7 - 441 km3 Black Sea biological species Fungi, algae, higher plants 1,619 Invertebrates 1,983 Fishes 168 Marine mammals 4 |
The Black Sea is the most isolated from the World Ocean - connected to the Oceans via the Mediterranean Sea through the Bosphorus, Dardanelle and Gibraltar straits and with the Sea of Azov in the northeast through the Kerch Strait. The ratio of its surface and its catchment area exceeds 6. For this reason, the Black Sea is very vulnerable to pressure from land based human activity and its health is equally dependent from the coastal and non-coastal states of its basin.
The large European rivers, the Danube, Dnieper and Don via the Sea of Azov, flow into this sea but its only tenuous link with other seas is with the Mediterranean through the Bosphorus Strait, the Sea of Marmara and the Dardanelle. The Bosphorus is essentially a narrow elongated shallow channel approximately 31 km long, with a width varying between 0.7-3.5 km and a depth of 39 to 100 m.
The main rivers: Rioni, Kodori and Inguri Chorokh, Kyzyl-Irmak, Eshil-Irmak, Sakarya, Southern Bug and Dnister also flow into the Black Sea.
The seabed is divided into the shelf, the continental slope and the deep-sea depression. (Fig.1) The shelf occupies a large area in the north-western part of the Black Sea, where it is over 200 km wide and has a depth ranging from 0 to 160 meters. In other parts of the sea it has a depth of less than 100 m and a width of 2.2 to 15 km. Near the Caucasian and Anatolian coasts the shelf is only a narrow intermittent strip.
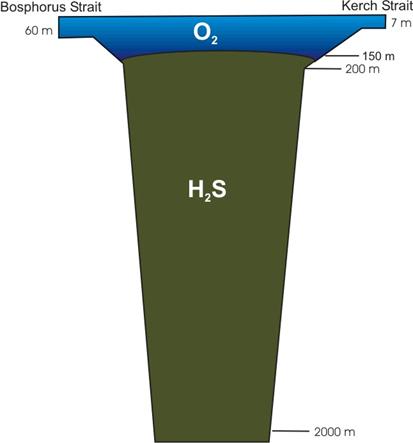
The thin upper layer of marine water (up to 150 m) supports the unique biological life in the Black Sea ecosystem. The deeper and more dense water layers are saturated with hydrogen sulfide, that over thousands years, accumulated from decaying organic matter in the Black Sea. Due to the unique geomorphological structure and specific hydrochemical conditions, specific organisms, basically on the level of protozoa, bacteria, and some multi-cellular invertebrates inhabit the deep-sea waters. Knowledge about biological forms of life in the deep waters of the Black Sea is very limited. The disturbance of the natural balance between the two layers could trigger irreversible damage to the people and ecosystem of the Black Sea. (Fig.2)
Fig. 1 Black Sea Bathymetry [43]
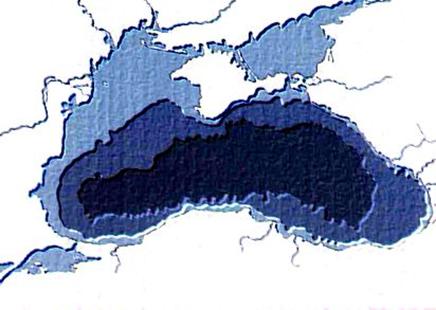
Fig. 2 Profile of the Hydrogen Sulfide Zone in the Black Sea [43]
1.2 Climate
Geography and macro circulation processes existing in the Mediterranean Basin influence the climate of the Black Sea Basin. In a major part of the Black Sea Basin, the climate is similar to the Mediterranean climate (warm humid winters and hot dry summers). The south-eastern part, surrounded by the mountains, is characterized by a humid subtropical climate (abundant precipitation, warm winter, hot summer)
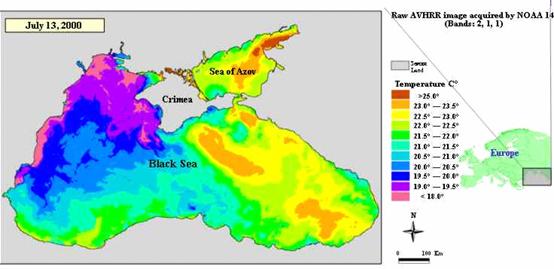
Average sunny periods vary throughout the region€“ 2,432 hours in the Bosphorus area, 2,237 hours in Varna area and 2,223 hours per year in Yalta area. (Fig. 3).
Fig. 3 Satellite Derived Water Surface Temperature
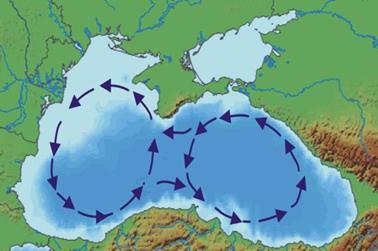
The Black Sea circulation is characterized by a cyclonic system of currents that is common for the basin. In years with intensive thermodynamic conditions, a distribution of the general dynamic system into sub-basin systems€” western and eastern cyclonic whirls€” can occur in the air above the sea.
The dynamic system of the Black Sea has a distinct yearly cycle. Maximum circulation intensity takes place in winter and spring when the sea accumulates potential and kinetic energy due to intensive winter thermodynamic interaction within the sea-atmospheric system. (Fig 4.)
Fig. 4 Black Sea Currents [22]
 Total amount of precipitation from the Bosporus to Varna is about 500-700
mm per year, in the north, near Odessa€“ 300-400 mm, in the southern
coast of Crimea (Yalta)€“ 586 mm. The amount of annual precipitation
increases eastward€“ 1,600 mm between Novorossiysk and Sukhumi, to 2,465
mm€“ in Batumi.
Total amount of precipitation from the Bosporus to Varna is about 500-700
mm per year, in the north, near Odessa€“ 300-400 mm, in the southern
coast of Crimea (Yalta)€“ 586 mm. The amount of annual precipitation
increases eastward€“ 1,600 mm between Novorossiysk and Sukhumi, to 2,465
mm€“ in Batumi.
In general, the Black Sea Basin climate is very favorable for tourism and recreation.
1.3 Geographical Scope of the Convention on the Protection of the Black Sea Against Pollution
The geographical scope of the Convention on the Protection of the Black Sea Against Pollution is applied to the Black Sea proper, with the Southern limit constituted, for the purposes of this Convention, by the joining Capes Kelagra and Dalyan. The purpose of the Convention is to prevent, reduce and control pollution thereof in order to protect and preserve the marine environment of the Black Sea.
2 Pressures on the Black Sea Environment
2.1 Population
The Black Sea coastal zone is densely
populated with approximately 16 million inhabitants and with 4 million
tourists visiting the seacoast in summer seasons. For all Black Sea
coastal zones except of
Table 2-1 The Population of Black Sea Costal Zone and Black Sea Basin, 1997-1999 [20, 31, 21, 36, 15, 30, ]
|
Country |
Costal Population* |
Basin Wide Population |
|
Black Sea Coast |
Black Sea Basin |
|
|
|
714,000 |
|
|
|
650,000 |
20,000,000 |
|
|
745,954 |
|
|
|
1,159,000 |
18,288,000 |
|
|
6,700,000 |
17,998,440 |
|
|
6,800,000 |
47,412,000 |
|
Non-coastal States |
||
|
Total |
16,768,954 |
A few decades of inadequate management of marine resources and pollution from the economic activities by the population in the Black Sea basin destroyed the ecosystem of the Black Sea and drastically reduced its biological resources.
2.2 Nutrient Inputs from Land-based Sources
Based on available scientific assessments and findings of the Transboundary Diagnostic Analysis (1995), the overall yearly input of nutrients from human activity amounts to 647,000 tons of nitrogen and 50,500 tons of phosphorus. (Black Sea Pollution Assessment, 1998). These estimates included also the river discharges. (Tab. II.2, Tab.II.3).
Table 2-2 The Estimated Input of Total Nitrogen into the Black Sea [37]
|
Country |
Inputs, thousand tons per year |
|||
|
Domestic |
Industrial |
Riverine |
Subtotal |
|
|
|
2.5 |
71.0 |
19.2 |
92.7 |
|
|
0.9 |
44.4 |
132.0 |
177.3 |
|
|
9.5 |
31.0 |
36.3 |
78.6 |
|
|
0.4 |
0 |
62.3 |
62.7 |
|
|
1.6 |
0 |
0.0 |
1.6 |
|
|
5.4 |
0.6 |
32.0 |
38.0 |
|
Other countries |
198.3 |
|||
|
Subtotal |
20.3 |
146.9 |
281.8 |
647.3 |
Table 2-3 The Estimated Input of Total Phosphorus to the Black Sea [22]
|
Country |
Inputs , thousand tons per year |
|||
|
Domestic |
Industrial |
Riverine |
Subtotal |
|
|
|
0.7 |
0.0 |
1.9 |
2.6 |
|
|
0.3 |
0.3 |
11.111.6 |
|
|
|
2.6 |
1.7 |
5.79.9 |
|
|
|
0.5 |
0.0 |
6.16.6 |
|
|
|
0.4 |
0 |
00.4 |
|
|
|
2.2 |
0.1 |
3.6 |
5.9 |
|
Other countries |
13.6 |
|||
|
Subtotal |
6.7 |
2.0 |
28.2 |
50.5 |
The input of nutrients and other pollutants from land-based sources is reflected in sets of data presented in the national reporting to the Black Sea Commission for the period 1996-2000. The available data, although not presented in a harmonized manner, explicitly shows a steady decline in the discharges of wastewaters and individual pollutants and nutrients in the territorial waters of the Contracting Parties. The figures 5, 6, 7 and tables in the Annexes present a clear evidence of these trends.
Fig.5 Long-term Inputs of
Nitrogen in Coastal Waters of the
Fig.6. Total Discharges of the
Waster Waters into the Black Sea, million m3/year,
Fig.7. Discharges of Organic
Matter and Suspended Solids into the Black Sea, thousand tons per year,
1997-2000,
As expected, the GEF Black Sea Ecosystem
Recovery Project will conduct a more accurate assessment of nutrient and
pollutant inputs after which a corresponding report will be produced.
Nevertheless, the national reporting on discharges from priority point
sources of pollution shows a distinctly decreasing trend in the period of
1996-2000. The reasons for such reduction might be attributed partially to
the economic difficulties in those countries with transitional economies.
At the same time, the Black Sea coastal states made profound progress in
developing and enforcing legislative and regulatory tools in accordance
with the main principles of the Black Sea Strategic Action Plan. They also
managed to allocate national financial resources although still scarce and
insufficient. An extended EU investment program for the accession
countries€“
2.3 Priority Point Sources of Pollution
Articles 32 and 33 of the Black Sea Strategic Action Plan request from the Black Sea coastal states a regular reporting on the progress made in the elimination of priority sources of pollution. The Black Sea Transboundary Diagnostic Analysis, 1995 as well as the National Black Sea Environmental Studies (Turkey, 1998, Ukraine, 1998) specifically studied and ranked pressures on the Black Sea environment from land-based sources and indicated the most dangerous of them, the so called “hot spots” that required particular attention and urgent actions. The total number of priority point sources of pollution in the Black Sea coastal state was 49. In all the Black Sea coastal states, industries are, as a rule, connected to the municipal wastewater treatment systems, therefore mixed discharges from municipal sources that enter the marine environment are typical for the region. For this reason, the priority point sources of pollution, sometimes referred as “hot spots” and described in Black Sea Transboundary Diagnostic Analysis, are presumably presented by municipal wastewater treatment plants or port treatment facilities. As follows from the national reporting the input of nitrogen, phosphorus, suspended solid, and BOD5 decreased or were stabilized in 1996-2002. (Annex II)
In Bulgaria nine priority point pollution sources were identified as follows [5]:
Rosenets............................................. Oil Terminal
Varna................................................. Port
Burgaz................................................ Port
Asparuhopvo....................................... Domestic
Balchik............................................... Domestic
Sodi.................................................... Soda Ash
Tsaravo.............................................. Domestic
Neftochim........................................... Refinery
Sozopol............................................... Domestic
The discharged harmful substances are:
Neftochim€“ oil, Cd, Cu, phenols, sulfides, Cr;
Oil terminal “Rosenetz”€“ oil, Cd, Cu, phenols, sulfides, Cr;
Agropolichim€“ Devnia€“ SS, ammonia, Cd, phosphorous, Fl ;
Sodi€“Devnia€“ ammonia, phosphorous, SS, Cl, high pH (6-11,5).
The enterprises in Devnia discharge their wastewater in the Provadiiska River, which flows to the Black Sea. Draft IPPC permits are prepared for Agromolichim and Sodi .
Kutaisi................................................ Domestic
Batumi................................................ Domestic
Chiatura.............................................. Manganese
Poti..................................................... Domestic
Zestafoni............................................. Metallurgy
Tskhaltobo.......................................... Domestic
Zugdidi................................................ Domestic
Table 2-4 Total Inputs from
Priority Point Sources of Pollution,
|
Parameters |
1996 |
1997 |
1998 |
1999 |
2000 |
|
Total inorganic nitrogen, t/year |
not appl. |
not appl. |
not appl. |
not appl. |
not appl. |
|
Total inorganic P, t/year |
not appl. |
not a ppl. |
not appl. |
not appl. |
not a ppl. |
|
Total oil, t/year |
3,0 |
3,0 |
3,0 |
2,0 |
1,0 |
|
BOD, t/year |
5889 |
5909 |
1025 |
920 |
516 |
|
Total suspended solids, t/year |
9469 |
10253 |
5044 |
5000 |
2506 |
|
Heavy metals (Mn+2), t/year |
2,0 |
2,1 |
1,1 |
1,0 |
0 |
At the same time the data obtained for a very
limited number of parameters and with insufficient financial and technical
resources available in the country for monitoring of actual discharges do
not fully reflect the current situation of priority pollution sources in
In Romania fluvial discharges,
municipal waste waters discharges, industrial wastewater discharges,
maritime traffic and offshore oil activities influence the water quality
and environment of the Romanian coastal waters. Although six enterprises
situated on the seacoast are still classified as “hot spots” decreasing
trends are evident in the overall loads of nutrients, pollutants and
concentrations of these substances in the
Table 2-5 Total Inputs from the
Three Priority Point Sources of Pollution,
|
Parameters |
1996 |
1997 |
1998 |
1999 |
2000 |
|
BOD, t/year |
3268.8 |
8049.7 |
4660.1 |
3520.7 |
3040.2 |
|
Cd, t/year |
1.375 |
0.266 |
0.1717 |
0.065 |
0.872 |
|
Cu, t/year |
0.62 |
0.719 |
0.148 |
3.54 |
2.87 |
|
Heavy metals. t/year |
1.209 |
0.812 |
0.88 |
2.065 |
0.32 |
|
Pb t/year |
0.6 |
458.3 |
1456.7 |
1356.2 |
1208.9 |
|
Total inorganic nitrogen, t/year |
844 |
8.98 |
83.8 |
78.2 |
50 |
|
Total inorganic P. t/year |
13.4 |
25.55 |
31.05 |
39 |
55 |
|
Total oil, t/year |
44.2 |
1748 |
3822 |
4146 |
3304 |
|
Total suspended solids, t/year |
4042 |
The impressive progress in the reduction of
direct industrial discharges or untreated municipal discharges into
In the Russian Federation five ” hot spots “ were reported for the Black Sea and three “hot spots for the Sea of Azov, namely:
Rostov oblast
1. Municipal treatment plant / drinking water supply system in the city of Rostov-on-Don.
2. Municipal treatment plant/drinking water supply system in the town of Taganrog.
3. Municipal treatment plant/drinking water supply system in the town of Azov.
Krasnodar kraj
- Municipal treatment plant in the town of Anapa.
- Municipal treatment plant in Gelendzhik.
- Municipal treatment plant in Dzhoubga.
- Ballast water treatment plant in oil bulk plant “Sheskharis”, located in Novorossiysk.
- Ballast water treatment plant in the port of Tuapse.
Table 2-6 Total Inputs from
Priority Point Sources of Pollution, Krasnodar Kraij, the
|
Parameters |
1996 |
1997 |
1998 |
1999 |
2000 |
|
Aromatic Hydrocarbons, t/year |
1.06 |
0.646 |
0.608 |
0.5 |
1.012 |
|
Total BOD, t/year |
165.5 |
157.9 |
159.3 |
173 |
178.9 |
|
Total Detergents, t/year |
2.677 |
1.93 |
2.035 |
1.738 |
1.796 |
|
Al, t/year |
0.075 |
0.163 |
0.189 |
0.176 |
0.322 |
|
Fe, t/year |
1.56 |
1.178 |
1.161 |
0.968 |
2.208 |
|
Phenols, t/year |
0.063 |
0.030 |
0.035 |
0.032 |
0.064 |
|
Total Suspended Solids, t/year |
231 |
158 |
141 |
236 |
226 |
|
Total Nitrogen, t/year |
243.270 |
208.935 |
227.079 |
218.745 |
212.565 |
|
Total oil, t/year |
6.96 |
5.2 |
4.58 |
4.19 |
|
|
Total Phosphorus, t/year |
34.278 |
31.826 |
29.528 |
26.376 |
32.109 |
The overall reduction of inputs of total nitrogen, phosphorus, BOD5, suspended solids and detergents was reported for the wastewater treatment plants in Anapa and Dzhoubga. The loads of the same substances from the wastewater treatment plant in Gelendzhik increased slightly. A rising trend was also reported for ballast water treatment plant “Sheskharis” in Novorossiysk. No impacts were observed in the vicinity of the “hot spots” except for the ballast waters treatment plant in Novorossiysk.
A project for the reduction of discharges of biologically active substances and methane emissions from the Municipal Waste Water Treatment Plant in Rostov on Don is being negotiated between World Bank (GEF/WB Partnership) and the Government of the Russian Federation (19,000,000 USD).
KBI Samsun....................................... Copper
TUGSAS Samsun................................ Fertiliser
Trabzon.............................................. Domestic
KBI Murgul........................................ Copper
Samsun............................................... Domestic
Zonguldak........................................... Domestic
Giresun............................................... Domestic
Ordu................................................... Domestic
Bafra.................................................. Domestic
Eregli.................................................. Domestic
The information on concentrations in the impact areas of “hot spots” was not presented. At the same time, the improvement of wastewater treatment facilities of Samsun and Trabzon resulted in significant reduction of loads of nitrogen, phosphorus, BOD, and suspended solids. A number of projects for the improvement or construction of wastewater treatment facilities are continuing or are in the planning stage. In the 2001 investment portfolio, there are plans for five waster water management improvement projects for the year 2001. (Annex II).
In
Pivdenni ............................................. Domestic
Pivnichni............................................. Domestic
Balaklava............................................ Domestic
Yevpatoriya........................................ Domestic
Sevastopol0......................................... Domestic
Yalta.................................................. Domestic
Gurzuf................................................ Domestic
Kamish Burunsky................................ Iron ore
Illichevsk............................................. Port
Krasnoperekopsk................................. Bromide
Table 2-6 Total Inputs from
Priority Point Sources of Pollution,
|
Years |
1996 |
1997 |
1998 |
1999 |
2000 |
|
Arsenic (As).t/year |
0.017 |
0.004 |
0.0002 |
0 |
0 |
|
Iron, total, t/year |
0.452 |
0.432 |
0.5008 |
0.6 |
0.54 |
|
Manganese (Mn), t/year |
0.103 |
0.021 |
0.0001 |
0 |
0 |
|
BOD5, t/year |
8126.154 |
6724.73 |
6289.229 |
6024.9 |
5945.1 |
|
Nitrogen (Nitrates), t/year |
595.4 |
596.3 |
730.5 |
740 |
725.2 |
|
Nitrogen (Ammonium), t/year |
9189.7 |
7869.2 |
7898.6 |
7296.2 |
6823.5 |
|
Nitrogen (Nitrites), t/year |
172 |
282.08 |
298 |
264.4 |
196 |
|
Total Inorganic Nitrogen, t/year |
9957.1 |
8747.58 |
8927.1 |
8300.6 |
7744.7 |
|
Oil, t/year |
310.18 |
242.18 |
232.65 |
218.56 |
216.69 |
|
Phosphorus, t/year |
1113.7 |
1047.94 |
1119.94 |
986.29 |
857.48 |
|
Total suspended solids. t/year |
4855.1 |
4235.3 |
4312.712 |
4236.3 |
4051.1 |
|
Heavy metals, t/year |
210.2 |
77.5 |
74.4 |
72.7 |
70.4 |
The operation of existing wastewater
treatment facilities improved or stabilized in 1996€“ 2000 resulting in
decreasing trends of pollutant inputs for most of the indicated “hot
spots” in
The recently reported growth of the Gross Domestic Product in those Black Sea states with transitional economies implies increasing pollution pressures on the environment and requires from the Black Sea states full implementation of the necessary measures in compliance with the BSSAP precautionary principle in order to prevent a new wave of pollution of the Black Sea.
2.4 Insufficiently Treated Wastewaters
All Black Sea coastal states, in particular,
those countries with transitional economies, do not have sufficient
economic power to resolve the existing problems in the municipal sector to
which most of the priority sources of pollution belong. In a majority of
the Black Sea coastal states the construction of wastewater treatment
facilities is not sufficient for eliminating pollution from priority
sources of pollution. Their sewer systems, built in 1960 -1970s, also need
upgrading. For example, in
Regardless of the reported progress with the
reduction of pollution from the priority sources, non-compliant wastewater
discharges with respect of national water quality standards were reported
for the most of the Black Sea coastal states. The discharge of wastewater
not fully meeting compliance requirements was reduced in
Developing national legislative and
regulatory tools to control the discharges by the Black Sea coastal states
includes the basic principles of the BSSAP, such as permits and the
polluters pay principle. In addition, being accession countries,
The sustainable progress in this sector is hampered by current economic conditions in all Black Sea countries. Therefore, investment programs in the municipal sector should also be directed at the development and modernization of the municipal infrastructure.
2.5 Inputs from Diffuse Sources of Pollution
The greatest sources of diffuse pollutions are related to agricultural activities, to households not connected to sewer systems, and to atmospheric depositions
Inadequate land use and the excessive application of mineral and organic fertilizers result in high nutrient inputs into the rivers and ultimately into the Black Sea.
The quantities of inorganic fertilizers used
in those Black Sea states with transitional economies were drastically
reduced due to high prices and to the inability of population involved in
agricultural sector to pay for fertilizers. For example, in
There are estimates that atmospheric inputs of total nitrogen to the Black Sea amount to 400 thousand tons per year and is comparable in magnitude to the total input of this nutrient from rivers, domestic and industrial sources (647 thousand tons per year). If these estimates are correct, the air emissions are significant sources of nitrogen input into the marine environment. Adequate policies and measures have to be introduced by the Black Sea coastal states in order to control emission sources. As expected, an accurate assessment of airborne pollution inputs will be carried out in the second phase of the Black Sea Ecosystem Recovery Project. Meanwhile, the countries reported an overall decreasing trend in atmospheric emissions. (Annex II).
Assessments of the pollution inputs from diffuse pollution sources in the Black Sea will be carried out in the second phase of the GEF Ecosystem Recovery project in the agreed methodologies and unified reporting formats.
2.6 Inputs from Other Pollution Sources
The intensive marine traffic and offshore
exploration of oil and gas constitute additional sources of marine
pollution. Incidental oil spills pose particularly high risks for the
Black Sea due to its isolated position. The general trend indicates a
reduction of incidental oil spills. At the same time, an expected increase
of oil transport from
Fig. 8 Oil Spills in the Black Sea, 1996-2001 [11, 14, 17, 29, 33, 37 ]
Dumping of the dredged spoils, originating from routine operations in harbors, creates additional sources of trace metals and oil pollution.. The concentrations of these pollutants at dumping sites could exceed the background values. The current number of dumping sites for dredged spoils is about 12-15 and will grow with increasing intensity of marine traffic. The volume of dumped dredged spoils exceeds 2000 th.m3 per year.
Table 2-8 Dredged spoils dumped into the Black Sea between 1996-2000, th m3 [38, 21, 31, 33, 17, 29]
|
Country |
1996 |
1997 |
1998 |
1999 |
2000 |
2005 |
|
|
No dumping |
|||||
|
|
No dumping |
|||||
|
|
148 |
123 |
26 |
23 |
138 |
161 |
|
|
325 |
325 |
325 |
525 |
||
|
|
No dumping |
|||||
|
|
2020 |
|||||
3 Pollution Levels.
The Transboundary Diagnostic Analysis (1995) and a number of other reports that focused on the issues related to the state of the environment of the Black Seas ranked the environmental problems as follows:
Excessive input of nutrients provoked the development of the eutrophication phenomena that in turn affected Black Sea biota and biological resources. Black Sea new comers favored the eutrophic conditions and their populations, in the absence of natural enemies, greatly multiplied.
Recent data shows some lessening of past ecological problems although the situation is still unstable. An irreversible collapse of the Black Sea ecosystem may result with additional pressures.
3.1 Nutrients
The elevated concentrations of nutrients are recognized as the main cause of eutrophication in the Black Sea and cause severe environmental pressure on the Black Sea ecosystem. During the last decade, the available scientific and monitoring data provide the evidence of an overall reduction of nutrients in the marine environment. National findings were supported by a number of scientific cruises and regional projects including the IAEA Technical and Economic Program RER/2/003 “Marine Environmental Assessments in the Black Sea Region” 1995-2000. This project paid particular attention to the issues of quality assurance€“ quality control and training in order to ensure the reliability of obtained data and the assessment of processes.
National monitoring systems reported lower concentrations of nutrients for impact areas in the vicinity of “hot spots” in the national coastal territorial waters of the Black Sea costal states (Annex 1).
For the coastal waters of
Fig.9 Mean Annual
Concentration of the Nutrients in the Territorial Waters of
|
|
1. Shabla Cape 2. Kaliakra Cape 3. Kavarna 4. Balchik 5. Varna 6. Kamchia 7. Obzor 8. Nessebar 9. Pomorie 10. Bourgas 11. Drujba Oil Pipeline 12. Sozopol 13. Primosrko 14. Ahtopol |
|
|
1. Shabla Cape 2. Kaliakra Cape 3. Kavarna 4. Balchik 5. Varna 6. Kamchia 7. Obzor 8. Nessebar 9. Pomorie 10. Bourgas 11. Drujba Oil Pipeline 12. Sozopol 13. Primosrko 14. Ahtopol |
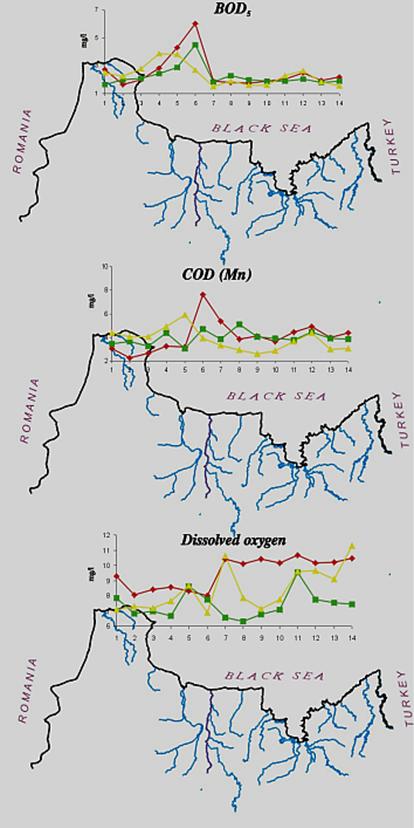
Fig. 10. Annual Fluxes from Bulgarian Black Sea Rivers - tonnes/year [5]
|
Total inorganic nitrogen |
P-PO4 |
|
|
|
|
Total suspended solids |
BOD 5 |
|
|
|
|
Fe |
Mn |
|
|
|
No regular monitoring data for
Chemical oxygen demand ................... 0.8 -17.6 mg/l and (average 6.96)
Dissolved oxygen ................................ 5.36 - 10.28 mg /l (average 7.66)
Nitrates............................................... 0.03 - 7.40 mg/l (average 1.25)
Nitrates did not exceed ....................... 0.02 mg/l
Total organic carbon............................ 0.05 - 3.15 mg/l (average 0.23)
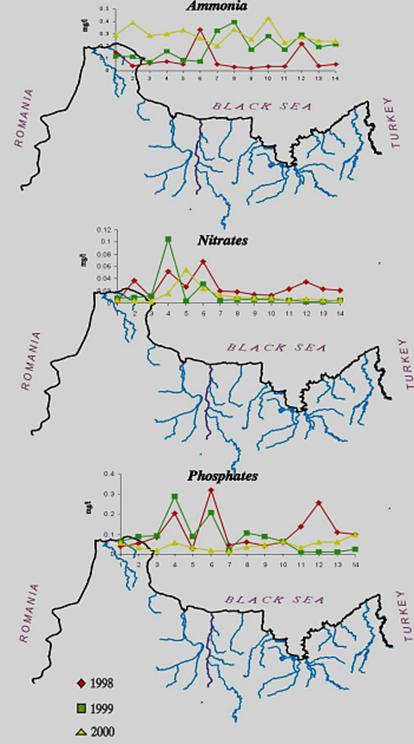
In Romanian coastal waters a slight decrease in the concentrations of nitrogen was supported by the analysis of valid monitoring data. It is obvious that the more likely causes of the decrease are the low application of fertilizers and the effective enforcement of the EU Nitrate Directive in the countries of the Danube basin (Fig. 11, 12).
Fig. 11. Mean Annual
Concentrations and Fluxes of Nutrients in the Territorial Waters of
|
|
|
|
|
|
|
|
|
Fig. 12. Mean Annual
Concentrations and Fluxes of Nutrients in the Territorial Waters of
|
|
|
|
|
|
In the
Table 3-1 Concentrations of
Phosphates, Nitrites, Silicates, and Oxygen in Territorial Waters of the
|
Location |
Parameter |
1996 |
1997 |
1999 |
2000 |
|
Tuapse |
O2,% |
95.2-115 |
95.4-104 |
90.1-112 |
94.7-107 |
|
PO4, μg/l |
0-13 |
10 |
0-10 |
0-10 |
|
|
SiO4, μg/l |
120-890 |
230-1000 |
340-620 |
340-780 |
|
|
NO2, μg/l |
5-17 |
5-11 |
5-6 |
5 |
|
|
Sochi |
O2,% |
95.4-106 |
96.3-106 |
91.1-106 |
94.8-103 |
|
PO4, μg/l |
0-10 |
0-10 |
0-10 |
0-10 |
|
|
SiO4, μg/l |
90-840 |
340-780 |
280-620 |
230-780 |
|
|
NO2, μg/l |
6-9 |
5-10 |
5 |
5 |
|
|
Novorissiysk |
O2,% |
95.3-103 |
95.6-106 |
91.1-106 |
94.8-103 |
|
PO4, μg/l |
0-10 |
0-10 |
0-10 |
0-10 |
|
|
SiO4, μg/l |
120-620 |
340=840 |
280-400 |
400-890 |
|
|
NO2, μg/l |
5-13 |
5-12 |
5 |
5 |
|
|
Gelendzhyk |
O2,% |
93.3-106 |
94.1-104 |
90.9-106 |
95.9-103 |
|
PO4, μg/l |
0-10 |
0-10 |
0 |
0 |
|
|
SiO4, μg/l |
90-560 |
280-840 |
280-450 |
500-840 |
|
|
NO2, μg/l |
5-8 |
5.9 |
5 |
5 |
|
|
Anapa |
O2,% |
95-103 |
90.6-105 |
90.9-104 |
96.1-110 |
|
PO4, μg/l |
10 |
0-19 |
0 |
0 |
|
|
SiO4, μg/l |
90-560 |
230-730 |
280-340 |
400-890 |
|
|
NO2, μg/l |
5-8 |
5-10 |
5 |
5 |
The data from Turkish scientists confirm a steady decline of nitrogen at the entrance of Bosphorus while the concentrations of phosphorus decreased somewhat less. As a positive signal of the shift to recovery, a slight increase of silicates was reported (Fig.12).
Fig. 13.
Concentrations of Nutrients in the Territorial Waters of
|
|
|
Fig. 13.
Concentrations of Nutrients in the Territorial Waters of
|
|
|
|
|
Considering that Ukrainian portion of the Black Sea shelf is affected by the some of the largest European rivers such as the Danube and Dnipro, and by some of the smaller but equally important rivers such as the Dnister and Southern Bug, the reduction of nutrient fluxes is not so obvious in this area. Data of the Ukrainian Center of the Sea Ecology shows that during the past couple years some increased levels of nitrogen and phosphorus, clearly connected with high water flows from the rivers, were observed. In addition, the very hot summers strongly influenced the processes of mobilization of nitrogen and phosphorus accumulated in the bottom sediment and increased biosedimentation rates. An increase of nitrogen, organic matter, and silicates were reported for the last two years when water levels were high in the rivers discharging into the Black Sea. (Fig. 14)
One of the most negative consequences of the elevated inputs of nutrients and the subsequent eutrophcation is a disturbance of the oxygen regime with further hypoxia and anoxia. (Fig.15). Development of hypoxia phenomenon, the level of eutrophication of water, river discharge, and hydrodynamic, hydro chemical, hydro biological, and hydro-meteorological conditions, as well as the physical and chemical processes in sediments etc. are all interrelated. Beginning in the 1970€™s, hypoxia developed annually in the northwestern shelf of the Black Sea. It usually covered progressively larger areas though there are fluctuations connected with flow of the rivers and climactic factors. In the worst case scenario, hypoxia and mass mortality areas in the NWBS might cover over 30€” 40 thousand km2.
Fig. 14 Average Annual Nutrient Concentrations in the Surface Layer of the North Western Shelf of the Black Sea (Ukrainian territorial sea and economic zone), 1959-2001 [24]
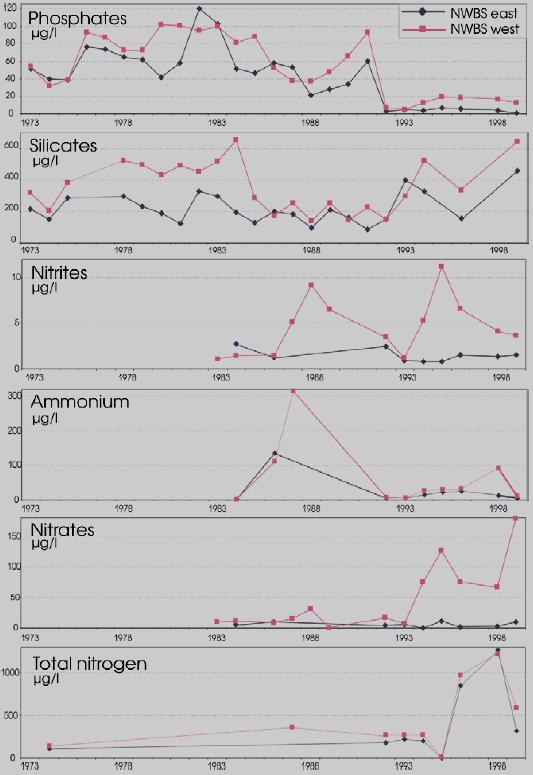
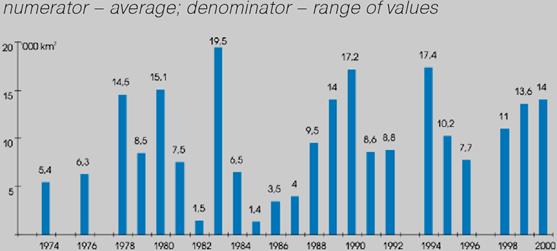
Fig. 15. Hypoxia Zones at the Black Sea Shelf, Ukrainian Bottom Layer of the North-western shelf of the Black Sea, 1973-2000 [24]
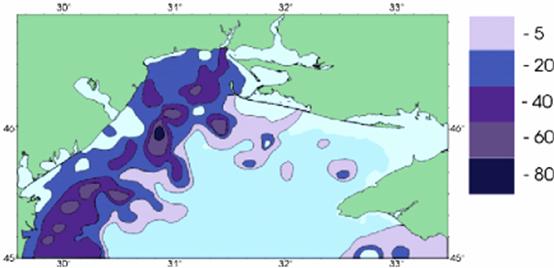
A statistical estimation of the probability of hypoxia for the period 1973€” 2000 is shown in Fig. 16. After studying the geography in the bottom layer zones of the north-western shelf of the Black Sea that experienced deficit of oxygen, three characteristic sites were revealed, where hypoxia was registered most often: `Odesa', `Central' and `Danube'. `Central' refers to the area between the Dniester and Danube rivers. The geographic position of the other sites is indicated by their names.
Fig. 16. Statistical Estimation of the Probability of Hypoxia [24]
In the year 2000, the total area exposed to hypoxia reached 14 thousand km2 (38 % of the northwestern shelf). This is three times less when compared to 1983 figure - when more than 50 % of the northwestern shelf of the Black Sea was exposed to hypoxia.
The shelf regions where hypoxia and anoxia were registered are characterized by anomalous oceanographic conditions: vertical gradients of density reach 6 conventional units, temperatures of €” 15°C, salinity of€“ 6 %o per 1 m; aeration of bottom water with oxygen is suppressed as the result of vertical exchange (the indicator of the intensity of the process€” Richardson number€” exceeds the critical point for the Black Sea and reaches 10). A characteristic feature of nutrients' distribution is the absence of zero values in the surface water layer. However, in early summer the pH level on the surface reaches 9.25 and is over-saturated with oxygen - 170 %. In the bottom layer, the pH level of the water decreases to 7.8. Consequently, an intense development of destructive processes is observed€” BOD5 value reaches 2-4 mg/l, and the constant of organic matter oxidation speed exceeds the same value for the open part of the sea by 3-5 times.
Table 3-2 Average Multi Annual Values of Nutrients€™ Concentration in the Surface Layer of Some Region of the Black Sea [24]
|
Average Multiannual Value of Nutrinets€™ Concentration (mg/l) in the Surface Layer of Some Regions of the North West Black Sea Shelf (1955-2000) |
||||||
|
Polygone |
Phosphate |
Total Phosphorus |
Nitrite |
Nitrate |
Ammonium |
Total Nitrogen |
|
Megapolis |
45.2 |
71.8 |
3.4 |
24.1 |
53.5 |
268.5 |
|
Danube |
42.5 |
140.6 |
20.9 |
385.4 |
38.0 |
890.0 |
|
Dniester |
30.1 |
58.4 |
3.5 |
92.5 |
23.3 |
538.0 |
|
Dnipro-Bug |
94.4 |
136.5 |
4.7 |
18.4 |
27.9 |
816.7 |
|
Reference |
40.9 |
42.4 |
1.2 |
3.8 |
12.9 |
211.2 |
In general, the following changes took place in the hydrology and hydrochemistry of the western part of the shelf in the last decade: salinity decreased, oxygen content somewhat changed, content of phosphate decreased, and the content of nitrogen containing substances increased.
Biological Oxygen Demand, used to monitor the
input of organic substances in the Black Sea, had been reduced or
stabilized in the period between 1996€“ 2001. However, it may increase
significantly in recreational waters in high seasons as was reported for
The observed trends, derived from reported national sources, were further supported by the data from the NATO project for the open sea that studied areas not be covered by the national studies due to current economic conditions. (Fig. 17)
Available historical scientific data show that the two to three fold increase in nitrate concentrations and the shifting maximum nitrate concentrations from 15.7-15.9 to 15.3-15.5 occurred between 1969 and 1991. This was due to structural changes of the phytoplankton community and to the dominating nitrogen and silicate cycles in the upper layer of the Black Sea. A scientific assumption explains that the variation of basic chemical properties in the water column of the Black Sea is caused by this increase in nutrient inputs due to a more intense flux of particulate organic matter to the depth thereby causing a temporal increase of nitrate fluxes from late 1960s to the early 1990s. As most of the sinking particulate organic matter is oxidized in the oxycline, the temporal changes seem to be more profound at the upper boundary of the oxic/anoxic transition zone. Furthermore, it has been estimated that the residence time of nitrate in the layer of the main pycnocline is fairly short and small changes in the fluxes could result in substantial changes in nitrate concentrations over a period of years. Phosphate concentrations were slightly lower in the upper layer than in the deeper layer resulting in a shifting from a nitrogen limitation of primary production to a phosphorus limitation in 1990s.
Assessment of the temporal variations of nutrients in recent years showed that depletion of NO3, occurred after mid 1990s and that NO3+NO2 and PO4 reached their lowest levels in 2000-2001. This followed an increase of both for NO3+NO2 and PO4 in the first half of 1990s with stronger increase for in NO3+NO2 and reduction of in (NO3+NO2)/PO4 ratio. Thus, the PO4 and nitrate stocks of this layer dropped to its lowest level of the last decade.
Fig. 17. Concentrations of Nutrients and Their Ratios in the Black Sea Waters [34].
3.2 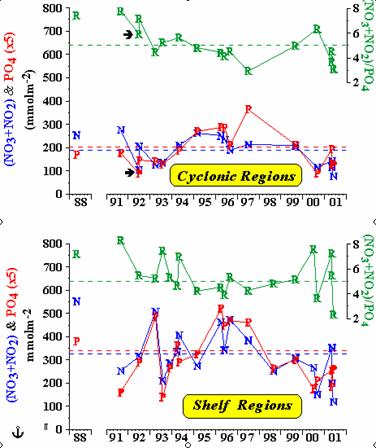 Trace Metals.
Contamination by trace metals does not appear to be a basin wide problem in the Black Sea. Heavy metals like cadmium, mercury, and lead, referred to as the priority pollutants in marine waters, do not present a threat to the marine ecosystem. The concentrations of heavy metals in bottom sediments and biota, collected in areas of influence of rivers and nearby ports and priority point pollution sources, are usually higher although decreasing or no trends have been observed. Accurate assessments of trends in biota and sediments are limited due to lack of long-term observations.
In the territorial sea of
In the territorial sea of Georgia, a spatial distribution of trace metals was studied during a joint American-Georgian Survey in 2000. (Annex I) The trace metal concentrations did not differ significantly from data of the other states.
In Romanian coastal waters, levels of trace metals in the bottom sediment were monitored randomly and there are insufficient data to detect any trends. (Table 3-3).
Figure
18 Heavy metal concentrations along the Black Sea coast,
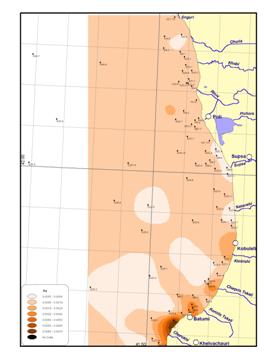
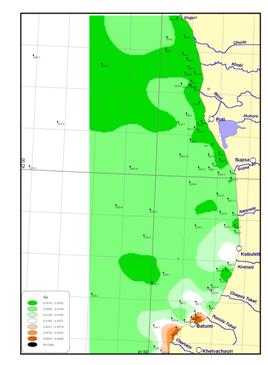
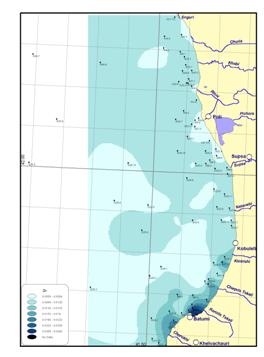
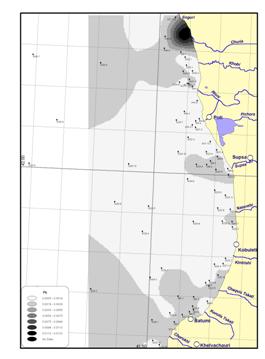
Table 3-3 Trace Metals in Sediments (μg/g dry weight), mean values [23]
|
Cu |
Cd |
Mn |
Fe |
Ni |
Pb |
|
|
Navodari€“ Vama Veche |
66.37 |
2.56 |
95.55 |
117.89 |
77.51 |
61.39 |
|
Constanta Port |
122.49 |
4.38 |
136.74 |
185.70 |
58.27 |
147.28 |
In the territorial sea of the
In
Cadmium pollution of marine waters is insignificant and usually higher at the dumping sites for dredged spoils.
Analysis of the spatial distribution and trends in the concentration of mercury, one of the most toxic for marine living organisms, shows that, at present, pollution of marine water with mercury is not registered.
Elevated concentrations of copper are usually detected at the discharging point of Odesa Biological Treatment Plant "Southern"; marine dumping sites; in mixing areas where the water of Dnieper, Bug, and Limans enters the sea; and near the biological treatment plant of the town of Illichivsk.
Arsenic concentrations in marine water are insignificant. In the coastal zone where the Danube enters the Black Sea and in the Karkinit Bay area, the concentration of arsenic is somewhat higher and reaches 2-3.5µg/l.
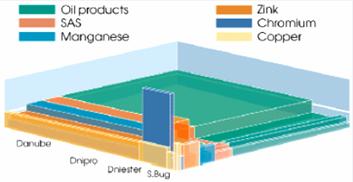
Fig. 18a Inputs of Major
Pollutants in the Black Sea Shelf,
3.3 Oil Pollution
Currently overall decreasing trends are reported for oil related pollution in marine waters of all Black Sea coastal states. (Fig 19).
Fig. 19. Concentrations of Hydrocarbons in the Bottom Sediments in the Black Sea, 1999 [22]
 Only in harbors of Constanta port and near the petrochemical plant in
However oil pollution is a concern for the
Black Sea environment in particular due to increasing risk of accidental
spills that may result from the expected twofold increase of oil transit
by tankers. The freight flow of this oil resource from Middle Asia and
Fig, 20. Concentration of Petroleum Hydrocarbons in the Waters of Major Ukrainian Ports [22].
3.4 Persistent organic contaminants
Persistent organic contaminants, mostly
polychlorinated byphenils and organochlorine pesticides do not seem to be
a problem for marine waters. The
The concentrations of PCBs in bottom
sediments (Fig. 21) are low in comparison with other inner seas of Europe.
The highest concentration of PCBs (24.3 ng/g) was found in a sample from
the Constanta Port harbor. Elevated concentrations of lindane and other
isomers of HCH along Romanian and
 Fig.
21. Concentrations of Polychlorinated Byphenils in the Bottom Sediments of
the Black Sea, 1995 [22]
Fig.
21. Concentrations of Polychlorinated Byphenils in the Bottom Sediments of
the Black Sea, 1995 [22]
Fig. 22. Concentrations of Lindane and HCH Isomers in Bottom Sediments of the Black Sea , 1995 [22]
 Fig. 23 Concentrations of DDT in Bottom
Sediments of the Black Sea, 1995 [22]
Fig. 23 Concentrations of DDT in Bottom
Sediments of the Black Sea, 1995 [22]
3.5 Polyaromatic Hydrocarbons
Polyaromatic hydrocarbons (PAHs) constitute a
critical part of oil pollution having proven carcinogenic and mutagenic
effects. Due to low solubility, their concentrations in marine water shall
not be monitored. In bottom sediments, the highest levels were detected
near Odesa, the Danube coastline and in Sochi, the
Fig.24 Concentrations of Polyaromatic Hydrocarbons in the Bottom Sediments of the Black Sea, 1995 [22]
In Bulgarian territorial waters the maximum concentration of PAHs was 58.13 and the minimum 5.15 ng per L. There is no positive trend on this type of pollution.
In
The
In the territorial waters of
This pollution in mostly related with port activities. In the ports with long histories of operation, the concentrations of polyaromatic hydrocarbons could reach rather high levels. Unexpectedly, the studies in the Odesa port, chosen as one of six worldwide demonstration sites in the framework of the UN GLOBALLAST projects, showed high biodiversity including some fish species and five to six new exotic species. The pollution of mussels by oil components is rather high. The elevated concentrations of oil were revealed in the Phylopora from Zernov€™s field (Annex I)
3.6 Radionuclides
Levels and trends of radionuclide pollution do not present a threat to human health and biota. Since Chernobyl accident, the radioactivity is gradually decreasing and currently has almost reached the previous values although, in general, the background values in the Black Sea are twice as high compared to the Mediterranean. The preliminary results of the “Marine Environmental Assessment of the Black Sea Region” IAEA project, show that radioactivity levels have no significance in terms of human health and environmental safety. However, the reliable data accumulated as a result of this monitoring programme will have great importance for the further assessment of the Black Sea marine environment and the emergency response programs. The transboundary environmental pollution problems, ecological degradation and the rehabilitation efforts of the Black Sea is a complex international cooperation issue that has been gaining great importance in recent years (GEF, BSEP, 1997). It is recommended that the regional cooperation projects supported by the IAEA should be extended further in order to cover chemical and organic pollutants which are known to be the major causes of the degradation of the Black Sea ecosystem. This should be done by the using nuclear and isotopic techniques and with the continuation of the radioactivity monitoring [22].
3.7 Litter
The littering of beaches and ultimately marine waters is illegal in all Black Sea Costal States. Nevertheless due to a poorly developed tourist infrastructure and the illegal disposal from marine transport and households, the problem still exists. The scope of the problem and an assessment of the impact of litter on marine life were never studied although required under the Bucharest Convention.
3.8 Microbiological pollution
Microbiological pollution of bathing waters creates an imminent threat to human health. Echerihia colli, Streptococus facaelis, and other pathogenic bacteria are widely used for assessment of microbiological pollution. From the chemical point of view, corpostanol is one of the important indicators of faecal pollution in bottom sediments. The highest levels of this pollution were found near the Danube delta and in Sochi in 1995 (IAEA, 1995). There is no national data on this particular indicator. (Fig. 25)
Fig. 25 Concentrations of Coprostanol, an Indicator of Faecal Pollution in the Bottom Sediments of the Black Sea [22]
 |
The closure of beaches to the public is an immediate response to the high levels microbiological pollution in every country. This might be indicative as a response indicator for microbiological pollution.
Overall improvement in the conditions of bathing waters is progressing in the Black Sea countries, especially in the accession countries.
In
In
In
In the
In
4 Biology and Biodiversity
The biological components of the Black Sea
ecosystem are strongly dependent on its geographical position and
morphology. The water layer supporting biological life and the
biodiversity of species is so thin and fragile that the effects of
pollution or destruction of habitats and landscape result in the
ecological changes of great economic and social impacts. Those areas
affected, depending on exploitation or use of living marine resources or
their aesthetic values, include fisheries, tourism, and other sectors As
reported for the period before 1996, a total of 3774 biological species
were identified in the Black Sea including: 1619 fungi, algae and higher
plants; 1983 species of invertebrates; 168 species of fishes and 4 species
of mammals. It is impossible to assess how accurate these figures are for
small organisms because the Black Sea ecosystem contains a great variety
of bacteria, protozoa and other groups of organisms that have not yet been
studied systematically. In addition, the life forms in the water column
saturated with hydrogen sulfide have not been studied sufficiently
although evidence exists for a rather diverse biological life and for the
presence of multi cellular animals. Examples of conservation status for
species in the
4.1 Bacteria of the Black Sea
The most studied groups of Black Sea bacteria are those that inhabit the pelagic zone. Usually the microbiological studies refer to genera or morphological and physiological groups of bacteria but very seldom specify species due to very complicated techniques for identification.
As Black Sea eurtophication evolved, the number of saprophytic bacterial plankton sharply increased particularly the cocci and bacilli. This is a result of the higher levels of dissolved and particulate organic matter that is a source for nutrition of saprophytic microorganisms. Bacteria populations, particularly pathogenic organisms have reacted to changing marine conditions particularly in the increase of organic matter in the water column and in bottom sediments with a sharp increase in numbers and diversity
4.2 Phytoplankton and Zooplankton
Phytoplankton
The structure and abundance of the phytoplankton species were heavily affected by eutrophication that has been progressively developing from the late seventies to the nineties when, after the collapse of the former Soviet Union, there was pressure against polluting and the inputs of nutrients were reduced due to the economic crisis.
Eutrophication, pollution, and climatic changes affected the phytoplankton communities and resulted in a number of processes with very adverse effects on the Black Sea ecosystem.
The main manifestation of these changes in the phytoplankton communities includes:
As a general rule, the most favored species in eutrophic conditions are the small size plankton algae such as Dinoflagellates, Coccolithophores, Euglenoids and some others.
The recently conducted surveys (1999-2000) in
In Romanian coastal waters, the stocks of nutrients are still higher than in the 1960s. Therefore in unfavorable conditions, such as high solar radiation in the summer season of 2001, could provoke a recurrence of aestival ample blooms (blooms which in the last decade of XX century, proved an important decline).
Intensive phytoplankton blooms increased biosedimentation of decaying plants and detritus inducing a sharp decline of dissolved oxygen and a silting of benthic communities. (Fig. 26)
Fig. 26 Traditional Phytoplankton Bloom in the Black Sea and Azov Sea
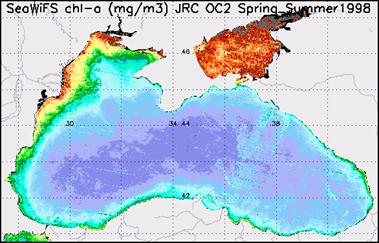
For example, these two monthly composites of chlorophyll-a for June 1979 and 1983 show the variability of the plume extension of the Danube River. (Fig. 27, 28, 29)
Fig. 27. Comparison of Satellite Images of the North-Western Shelf for Alga blooms [EEA images]
June 1979 CZCS June 1983

Fig.28 Chlorophyll A in the Black Sea (1998) [EEA images]
![]()
Chlorophyll A in the Black Sea (2000) [EEA images
Fig.29 Chlorophyll A in the Black Sea
(2000) [EEA images] 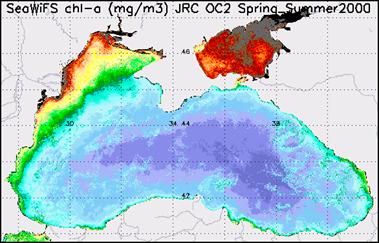
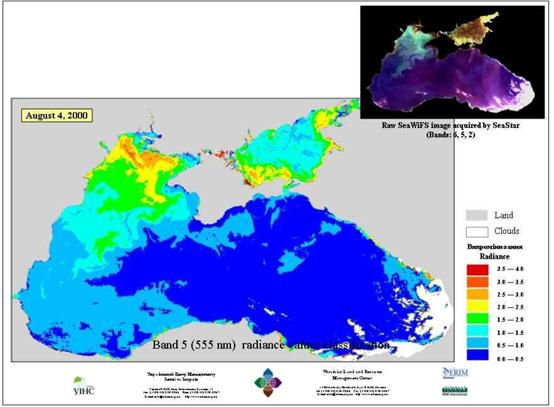
The alga blooms and subsequent decay of dead algae reduce the transparency of marine waters and reduce light penetration to the bottom plants, like Phylophora, in deeper waters (Fig. 30).
Fig. 30 Turbidity Map of the Black Sea.
Ukrainian data show that the phytoplankton biomass in coastal waters of the northwestern shelf of the Black Seas reduced by 15 times compared to 1996 (Table 3.1). However, these data are not regular and do not allow final conclusions to be drawn on the trend in phytoplankton biomass.
Table 4-1 Phytoplankton Values in the Ukrainian Black Sea Shelf from 1996-2000 [22]
|
Season |
Coastal zone |
Open sea |
||
|
Phytoplankton, mg/m3 |
Phytoplankton, mg/m3 |
|||
|
min |
Max |
Min |
Max |
|
|
Summer, 1996 |
0.1 |
158.6 |
0.6 |
84.2 |
|
Summer, 1998 |
3.8 |
112.0 |
- |
- |
|
Autumn, 1998 |
6.0 |
199.2 |
0.2 |
77.8 |
|
Winter, 1998 |
2.9 |
6.2 |
- |
- |
|
Spring, 1999 |
0.8 |
4.4 |
0.9 |
23.4 |
|
Summer, 1999 |
1.3 |
96.9 |
- |
- |
|
Winter, 2000 |
0.1 |
0.3 |
0.1 |
38.6 |
|
Summer, 2001 |
1.3 |
10.6 |
- |
- |
Zooplankton
Changes in phytoplankton lead to the corresponding changes in zooplankton. Some zooplankton species that were abundant before the 1970s have become sparse or have even disappeared. These include the population of copepods, Pseudocalanus elongates, Paracalamus parvus, Centropages krojeri pontica, Pontella middeterranea, Anomalocera patersoni and cladoceran Penilia aavirostis. As a general rule, large species of crustacean zooplankton were replaced by smaller species. Of the original seven species of cladocerans in the Black Sea, four currently form part of the zooplankton community in the northwestern shelf of the Black Sea - the smallest of them Pleopis polyphemoides, being the most abundant.
Another drastic change in the zooplankton communities was an outburst in the number of gelatinous species, including the largest Black Sea jellyfish Rizzhosstoma pulmo, and the moon jellyfish - Aurelia aurita.
Although relationships between phytoplankton blooms and these two species are not very obvious, the correlation between Noctiluca, which feeds on phytoplankton and detritus is clear. In the 1960s, the total summer biomass of this protozoa in the north-western shelf was estimated as 260 tons. In 1975 the total biomass increased to 3,000,000 tons and in the period between 1980-1985€“ to 17,000,000 tons.
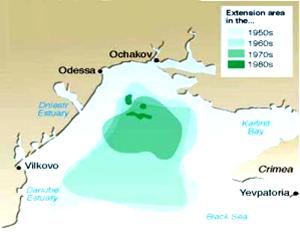
The invasion of the exotic ctenophore - Mnemiopsis leidyi and its outbreak in the late 1980s - is another example of a gelatinous plankton outburst in eutrophic marine waters. The highest Mnemiopsis biomass was recorded also for the northwestern shelf of the Black Sea.
The new comer - Beroye ovata - that feeds on
Mnemiopsis leidyi seems to be a useful exotic species able to control the
development of the Mnemiopsis. The data from
The abundance (A) and biomass (B) of Mnemiopsis leidyi both in the coastal and offshore waters (Fig.29, 30,31.) reduced sharply in the Black Sea according to estimates of Russian scientists [38].
Table 4-2 Biomass of Memiopsis
Leidyi and Beroye Ovata in
|
Country |
Exotic Species |
1996 |
1997 |
1998 |
1999 |
2000 |
2005 |
|
|
Mnemiopsis Leidyi |
0.546 |
0.503 |
1.163 |
No records |
Drastically reduced |
|
|
|
Beroye ovata |
Identified |
No statistics |
no statistics |
no statistics |
||
|
|
Identified |
Identified |
Fig. 31. Change in Abundance of Mnemiopsis Leidyi, August-September [38]
Fig. 32. Changes in Biomass of Mnemiopsis Leidyi, August-September [38]
A zooplankton survey was actively conducted in the Sarpi-Rioni area from 1998-2001. During that study, zooplankton species were documented that were not listed in the Georgian Black sea biodiversity report published in 1998, including: Cirripedia-2, Coelenterata-2, Infuzoria-3, Nemathohelminthes-2, Cladocera-4, Molusca- larval form of 2 species, Decapoda- larval form of 2 species, and Chordata-2 [12].
In Romanian waters [2] the third pattern of zooplanktonic development from the period of 1994-2000 was registered. It indicated that the annual mean trophic biomass was of 98.1 mg/m3, almost equal to the value obtained in 1995 (89.4 mg/m3) (first year when a perceptible improvement in the state of this biotic components of ecosystem was noted), but 1.15 times smaller then that of 1999 (113.4 mg/m3). The most important characteristic of this zooplankton quantitative structure is the significant development of the populations of three species: the copepod Centropages ponticus, cladocer Penilia avirostris and chetognat Sagitta setosa, which had not seen such abundance for almost 20 years.
The non-trophic zooplanktons were represented by three species: the cystoflagellate - Noctiluca scintillans, the ctenophore - Pleurobrachia rhodopis, the Mnemiopsis leidyi and Beroe ovata. The Noctiluca maintains its prevalence in the spring and summer communities. The Mnemiopsis' cidipid larvae were present only in spring but were absent in summer and autumn. During the summer, the autochthonous ctenophore P. rhodopis was present in almost all the samples. The larvae of the new immigrant - ctenophore B. ovata - were identified only in one sample.
There are also indications that the forage zooplankton is slowly recovering followed by the growth in the stocks of the small pelagic fishes according to Russian information (Fig 33, 34 Turkish and Ukrainian reports). In 1999, this stock was as high as 11 g/l in open sea and 13 g/l in coastal waters exceeding by several times the values of the last decade since the invasion of the Mnemipsis leidyi
Fig. 33 Changes in the Biomass of Food Zooplankton in August€“September in the Black Sea [38]
. 
Fig. 34. Changes in the Abundance of (A) Eggs and (B) Larvae of Anchovies in the Northeast Part of the Black Sea [39]
Fig. 34. Changes in the Abundance of (A) Eggs and (B) Larvae of Anchovies in the Northeast Part of the Black Sea [39]
Table 4-3 Zooplankton Biomass in the Ukrainian Black Sea Shelf from 1996-2000 [24]
|
Season |
Coastal waters |
Open Sea |
||
|
Zooplankton, mg/m2 |
Zooplankton, mg/m2 |
|||
|
min |
Max |
Min |
max |
|
|
Summer, 1996 |
40.3 |
355.1 |
||
|
Summer, 1998 |
31.7 |
869.7 |
||
|
Autumn, 1998 |
8.0 |
47.5 |
||
|
Winter, 1998 |
- |
- |
||
|
Spring, 1999 |
0.01 |
31.2 |
||
|
Summer, 1999 |
199.6 |
11394.0 |
||
|
Winter, 2000 |
2.0 |
148.9 |
||
|
Summer, 2001 |
0.01 |
3.8 |
||
4.3 Benthic Communities
Benthic Macroalgae.
Since the 1970s, insufficient insolation became a limiting factor for macro algae growth at a depth of 25 m and more in the offshore areas, and at a depth of 8 m and more in the coastal zone. The sharp reduction of the famous Zernov€™s Phyllophora field (a submerged meadow of algae harvested for agraroid), located in the central part of the northwestern shelf occurred. It shrank from 10,000 km2 to 500 km2 in the 1990s while its biomass decreased from 10,000,000 tons to 500,000 respectively (Fig. 35).
Table 6-4 Biomass and Abundance
of Zooplankton in North Eastern Part of the Black Sea,
|
Years |
Zooplankton |
|||
|
April |
September |
|||
|
Abundance Thousands/m3 |
Biomass mg/m3 |
Abundance thousands/m3 |
Biomass mg/m3 |
|
|
1996 |
8,0 |
447,8 |
- |
- |
|
1998 |
29,72 |
2173,1 |
1,95 |
160,0 |
|
1999 |
- |
- |
8,40 |
3556 |
|
2000 |
1,74 |
77,7 |
3,92 |
105,2 |
|
2001 |
3.,0 |
189,4 |
20,0 |
766,1 |
|
2002 |
1,71 |
127,0 |
- |
- |
|
Forage zooplankton |
||||
|
1996 |
3,80 |
112,2 |
- |
- |
|
1998 |
3,32 |
61,2 |
0,54 |
52,6 |
|
1999 |
- |
- |
8,10 |
330,9 |
|
2000 |
1,53 |
61,1 |
3,43 |
65,7 |
|
2001 |
1,16 |
42,2 |
19,85 |
754,0 |
|
2002 |
1,18 |
85,0 |
- |
- |
Fig. 35. Reduction of Zernov€™s Phyllophora Fields [24]
At the same time, a small Phylophora field, situated at a depth of 10-15 m in the eastern part of the Black Sea, still develops normally. The loss in the Phyllophora field was disastrous because of its valuable resources and more importantly because of its unique biocenoesis with its specific red color fauna (Phillophora fauna) and its important sources of oxygen.
The Black Sea brown alga - Cystoseira barbata
- that inhabits rocky coasts, began disappearing from the coastal waters
of
Impacts on Benthic Animals
The development of large-scale eutrophic phenomena and the resulting depletion of oxygen occurred due to decay of massive quantities of dead algae and due to sedimentation on benthic communities. This provoked frequent occurrences of hypoxic and anoxic conditions at the Black Sea shelf. First observed in 1973, oxygen poor zones were frequently observed every year in summer and autumn. The mass mortality of benthic animals was caused by this phenomenon. The biological losses over 18 years (1973-1990) were estimated as 60 million tons of living marine resources including 5 million tons of fish. As a consequence, the vastest community of mussels in the Odessa Gulf that were exported in the beginning of century completely lost its commercial significance.
As a result of the research conducted in 1999-2001, the following groups create the benthos biodiversity of Georgian coastline: Sarcodina S. Rhizopoda, Spongia S. Porifera, Turbellaria, Nematoda, Polychaeta, Oligochaete, Phoronidae, Crustacea, mollusca, Echinodermata. 177 benthos species were recorded in Georgian territorial waters, which is more than described in the Georgian Black Sea Biodiversity Report published in 1998 (128 species). According to this new data, the above groups are represented as follows: Polychetae-64, molluscsc-59, from which Gastropoda€“28 and Bivalvia-31, and Crustacea €“36 species. Seven groups of invertebrates listed in the report were added and 5 more groups of organisms: Sarcodina-2 species, and Spongia, Turbellaria, Nematoda and Oligochaeta as single species. Also, for the first time in the region, the Bivalvia mollusc - Cunearca cornea R. has been recorded. Thus, benthos biodiversity of the Black Sea Georgian shelf is represented by 177 species from 12 groups [18].
In Romanian coastal waters [1], in the two benthic communities on the muddy bottoms, the biological diversity of these communities showed an increase. The predeltaic sector at a depth range of between 15-50 m represents the transition from sandy to muddy bottoms (15-30 m depth) and mud with mussels (Mytilus galloprovincialis) at a depth of between 30-50 m. The number of zoobenthic species continually increased from the year 2000 to 2001 (the macro-benthic fauna was represented by 30 species in 2001compared to 26 species identified in the previous year); and more than in 1999 when only 22 species were identified. The qualitative structure of this fauna was dominated by versatile species with great ecological flexibility represented by the polychetae worms Neanthes succinea and Polydora limicola. The quantitative structure recovered slightly, although only in density, in particular at a depth of between 15-30 m (3,000 ind/ m2); the density was two times greater then that of 2000 (1,500 ind/m2).
In the last few years, benthic communities are characterized by considerable instability. There are always some zones where communities are affected by mortalities and other zones where the communities are recovering following a temporary improvement in environmental conditions. One result of this process has been a change in the structure of the bivalve populations. In this particular case the soft clam (Mya arenaria) populations though flourishing at the beginning of the 70€™s diminished in the last few years and currently represent only 10% of the total biomass.
In the marine sector of Constanta, the benthic communities exhibited in 2001 a slight qualitative improvement, i.e. 30 species were identified. In the absence of the blooming phenomena, the response to this improvement was reflected in the increased biodiversity in the Constanta area. According to data obtained during 2001, it is clear that in this marine sector:
In the southern zone, at Mangalia, 20 macrobenthic species were identified. Small values of abundance and biomasses were recorded: the mean abundance and biomasses for the whole area with mussels living in muddy bottom sediments from depths of 30-50 m was 2140 animals/m2 respectively, 373.4 g/ m2
Meiobenthos
Between 1985-1999, about 40 representatives of benthic organisms identified as to species or genera, and family and 20 forms of organisms whose taxonomy was identified conditionally were found in the deep-water layers (450-2250 m). The deep-water fauna differs considerably from fauna of the surface strata of the Black Sea and represent a unique endemic species of deep water saturated with hydrogen sulfide that has not yet been studied. But it does show that the anoxic zone of the Black Sea is not lifeless as was assumed earlier. The results of the studies, fulfilled between 1985-2001 by researchers of the Institute of Biology of the Southern Seas, NASU (Sevastopol), testify to a possibility for the existence of multi-cellular benthic animals in the Black sea hydrogen sulfide rich strata (at 470-2250 m depth range). It was revealed that in the anaerobic zone bottom fauna was represented by the common Black Sea species, peculiar for the shelf zone, and by hydrobionts, unknown previously to the Black Sea and to scientists. About 40 species of benthic organisms of Ciliata, Foraminifera, Nematoda, Kinorhyncha, Harpacticoida, Amphipoda, Ostracoda, Acarina and 20 unknown forms, whose taxonomy even now is conditional, have been found [9].
4.4 Ichthyofauna
The Black Sea ichthyofauna is considered rather poor compared to that in the other European Seas although the biological diversity of ichtyofauna has increased when compared to the 1950s and 1960s. Two far eastern species, Mugil soiuy and Centracanthus cirrus entered the Black Sea. The major changes occurred in the fish species€™ composition, including the number of fishes in specific populations. For many fish species, these changes were so drastic that their commercial value was completely lost and they dwell in the Black Sea only as representatives of the species.
There are a few reasons for the decline of fish stocks and for the structural changes of ichthyofauna. Over-exploitation has affected fish stocks. Commercial fishing in the Dnipro and Dnister estuaries has been reduced. Some valuable species such as mackerel, bonito, horse mackerel in the Black Sea and pike, perch, roach, bream in the Sea of Azov have practically disappeared. Of the 26 commercial fish species in the period from 1960s to 1970s, only five were left by 1980s.
Table 4-5 Mean Annual Catches (in tons) of the Commercially Valuable Fish Species in the Black Sea during the Period 1967-1994 and from 1996-2000 [32]
|
Species |
Mean catch 1967-1994 |
Mean Catches 1996-2000 |
% |
|
1967 |
1996 - 2000 |
||
|
Anchovy |
237966.3 |
56.57 |
|
|
Mediterranean horse mackerel |
46089.8 |
10.6 |
|
|
Sprat |
36963.0 |
8.79 |
|
|
Whiting |
17172.2 |
4.08 |
|
|
Bonito |
9517.4 |
2.26 |
|
|
Blue fish |
7121.7 |
1.69 |
|
|
Spiny dogfish |
4057.1 |
0.69 |
|
|
Chup mackerel |
3396.8 |
0.81 |
|
|
Turbot |
2427.7 |
0.58 |
|
|
Shad |
1931.7 |
0.46 |
|
|
Atlantic mackerel |
247.1 |
0.06 |
|
|
Total |
366890.8 |
87.22 |
|
|
Others |
53751.8 |
12.78 |
|
|
Overall total |
420642.6 |
364297 |
100.00 |
Fig. 36. Total Fish Catches in the Black Sea, 1996€“ 2000 [32, 18, 28, 41, 4, 10]
Commercially Important Species of the Black Sea.
Anchovy is one of the most important target
species of commercial fishing in the Black Sea. Its total catch in 1984
reached the maximum level of 600,000 tons. In general, anchovy is
harvested with purse seines in the cold period of the year. Since 1988,
the previous relatively satisfactory situation with respect to the Black
Sea anchovy stock has drastically changed, with a major decline of the
population. This was evidently caused by an excessive harvest of this fish
near the former
Sprat Srattus sprattus phalericus is a
small-sized planktonophagous fish with a life span of up to 5 years. Sprat
was in second place for volume of harvesting in the waters of the former
Black Sea horse mackerel Trachurus
mediterraneus ponticus is represented at present in catches with only
small-sized fish of up to 20 cm long. In the north western and
northeastern waters of the Black Sea, horse mackerel constantly occur in
summer when this fish reproduces and goes to the upper layers of the sea.
The inhabiting area of horse mackerel is sharply extended during times of
abundance, when juveniles in particular, are found in the center of the
sea as well. Horse mackerel almost disappeared from catches in the waters
of
Whiting - Merlangius merlangus euxinus
- is distributed all over the shelf of the Black Sea. However, mainly the
Turkish population consumes it as food. Consequently, fishing for whiting
is done primarily in
Spiny dogfish - Squalis acantias
inhabits the layer of the sea nearest to the bottom all over the shelf
zone. It reaches the age of 20 years and a length 140 cm. It is a
viviparous fish and a typical predator. Recently, yields of spiny dogfish
in
Turbot - Psetta maeotica - is
distributed all over Black Sea coast down to the depth of 100 m. It can
grow to 1 m in length. The Sea of Azov has its own subspecies that is
identified by its much smaller size and an almost complete absence of
scales on the skin that are characteristic of these fish in the Black Sea.
In the mid 60s the state of the commercial population was satisfactory.
Then, due to the impact of intensified fishing and a deterioration of the
ecological situation there was a great decrease in stock. This was
particularly the case in the northwestern Black Sea where mass mortality
had developed on the shelf. From 1964-1984 the stock of Black Sea turbot
was reduced more than ten times. In the mid 80€™s, after delimitation of
the sea area between Black Sea countries,
Sturgeons are marked by a long life period, late maturation (10-16 years) and by non-annual spawning. The largest representative of this group is the giant sturgeon - Huso huso - that reaches 3 m in length. Rarely even larger sturgeon may be caught. Due to their extremely low abundance, in the Sea of Azov in particular, the giant sturgeon was entered into the Red Book of Ukraine in 1992 and its harvesting was prohibited. The Russian sturgeon - Acipenser guldenstadti - is second in size of sturgeon species. It reaches a maximum length of 2.5 m and constitutes the biggest share in catches of sturgeon species. The smallest of this species, with a length of up to 1.5 m, is the stellate sturgeon - Acipenser stellatus - which constitute 25-30% in sturgeon catches.
At the same time in the area of the Black
Sea, efficient measures were not taken to cover reduction in stocks. In
Mullets. Among the fishes of the coastal complex mullets are a main commercial target species. The golden mullet - Liza aurata - (body length up to 42 cm) traditionally made up the most considerable part of the catch, grey mullet - Mugil cephalus - (body length up to 75 cm) took the second place in catches, and the leaping grey mullet - Liza saliens - (maximum length 36 cm) was caught in small quantities in the northern part of the Black Sea.
Recently Pacific mullet (haarder, pelingas) Mugil so-iuy undoubtedly took first place in catches of all countries, when it acclimatized itself for the first time in the estuary connected with the northern part of the Azov Sea (the territorial waters of Ukraine). In its new home, the Pacific mullet began to reach an even larger size (up to 80 cm) than those in the Pacific.
Atlantic bonito (Sarda sarda). Atlantic bonito played an important economic role among the medium-sized pelagic species distributed along the Turkish seas. It has a small sized biomass, but a high price. Due to their predatory effect on those small pelagic species mentioned above, its importance in the Black Sea ecosystem is increasing
The size of its stock changes between the Sea of Marmara and the Black Sea in space and time due to the migration that takes place from the Aegean Sea to the Black Sea through the Turkish Straights System and the Sea of Marmara. Turkish fishermen harvest them extensively and their catch always shows great fluctuation due to the changing of their year-class strengths and to the variations in the proportion of fish migrating into the Black Sea from the Aegean Sea and the Sea of Marmara.
The Red mullet (Mullus barbatus), Striped mullet (Mullus surmuletus) are also economically important demersal fish distributed along the Turkish Black Sea coast. However Turkish fishermen often do not discriminate these species from each other. Due to special research, carried out by Turkish scientists, information exists only for M. Barbatus.
M. Barbatus reaches the sexual maturity at the age of one year. It spawns from June to September, at a maximum in July. The eggs and the young fish are pelagic. After one and half months from hatching they change their life style from pelagic to benthic.
Bluefish (Pomatomus saltator) has a more economic importance in Turkish fisheries. It is caught during their spawning, feeding and hibernation. Migration takes place by the way of the Turkish Straits system between the Mediterranean (Aegean Sea) and the Black Sea. In the ecosystem, blue fish can do serious harm as a predator to the stocks of commercially important fish of the small pelagic species, e.g. anchovy, sprat, twaite, shad and mackerel etc.
Key Commercial Conservation Status
Pelagic fishes
Sprat - the sprat stock is rather high, especially in the northwestern part of the Black Sea. In 2001, both the average number and the abundance of sprat eggs have been higher than in the previous years in Romanian waters; and the situation was even better concerning larva, both the distribution and the average number.
Whiting stocks remain high; consequently a moderate increase of fish catches could be allowed. In the Romanian waters, the spatial distribution of the juveniles was increasing until the whiting catches reached 3138 tons in the year 1985, then gradually decreased.
Anchovies€“ some recovery of sprat stocks occurred but was restricted by uncontrolled exploitation. In the period analyzed, the abundance of eggs, larva and juveniles was increasing. Due to climate conditions in the Romanian coastal waters, the years 1998 and 2000 were less favorable for anchovy spawning and recruitment. The biomass of the spawning fishes that reached 20000 tons reflects conditions of recovery of the anchovy stocks.
Horse mackerel€“ some recovery of stocks occurs; but the
situation would improve if Mnemiopsis leidyi could be controlled by its
predator. In Romanian waters the abundance of eggs has decreased every
year. The horse mackerel juveniles were recorded in the higher abundance
in September 1999. The year 2001 was an exceptional year for the horse
mackerel juveniles, it appeared in a majority of the samples. The horse
mackerel catch has decreased from a few hundred tons in 1982, to 1-3 tons
in 1999. This increased to 17 tons in the last two years in
Demersal fishes
Turbot stocks are severely depleted due to the poor environmental quality of shelf waters that prevents recovery of these species, unsatisfactory fishing practices (fishing gears) and illegal fishing. In the case of turbot as well as for other species with high economic value (sturgeons), the statistical data of catches are almost entirely lacking. In the last decade intense illegal fishing was recorded. Until a regional estimate of the actual state of the stock, turbot fishing, at least in the spawning period, should be prohibited.
Spiny dogfish stock has declined in most areas, although relatively immune to Mnemiopsis leydyi. Commercial fishing should not exceed a sustainable level, and the migration routes should be protected.
Anadromous fish
Sturgeon€“ some species, such as the giant sturgeon, are endangered, while others are depleted. Their stocks are maintained due to the operation of hatcheries especially where spawning rivers are unusable.
Shad stocks are recovering. The shad population depends on the water quality in the Danube River. In the Romanian waters, there is an increasing trend for the number of the specimens with lengths of over 100 mm. This indicates good conditions for these species although the catches have decreased from over 1000 tons in the years 1986 and 1987, to 45 tons in 1997 and 22 tons in the year 2000.
Pomatomus saltatrix (blue fish) stock, again recorded in the Romanian waters from 1994, has a tendency toward population recovery; its reappearance in the northwest part of the Black Sea is related to the improvement of the quality of environmental conditions in this area.
4.5 Marine Mammals
There are four species of mammals - the monk seal (Monachus monachus) on the verge of extinction and three species of dolphins, the bottlenose dolphin (Tursiops truncatus ponticus), the common dolphin (Delphinus delphis ponticus) and the harbour porpoise (Phocaena phocaena relicta). At the beginning of the 1950s, the Black Sea was home to about 1 million dolphins [22,10]
The following assessments of marine mammals for the middle eighties varied from 454,440 (extrapolation from Turkish data) to 60,000-100,000 individuals (assessment of Russian and Ukrainian scientists). The discrepancy between these two assessments resulted from the differences in assessment methodologies. Since the middle 1980s, there were no assessments that would allow estimates of the current number and conditions of the populations of marine mammals on the regional level. (Fig. 37).
Fig. 37 Dolphinaria in the Black Sea Coastal States [10]
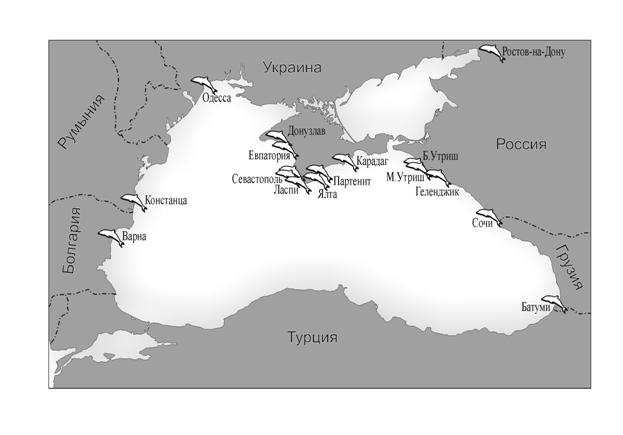
Research institutes in the Black Sea
countries conducted limited assessments and studies of the population of
marine mammals. They were focused on dolphin deaths (Rioni river,
Georgia), assessment of the Dolphinarium, in Constanta, Romania, the
number of animals, Anapa-Novorosiisk, Russian Federation, and threats to
marine mammals (Turkey). More active work in this direction was conducted
in
The ban for hunting dolphins is enforced in all Black Sea coastal states.
4.6 Exotic Species [44]
Intensive marine traffic results in large quantities of discharged ballast waters and the consequent introduction of alien species that compete for food with the indigenous species or, in the absence of the natural enemies, develop an intensive biomass. The exotic species arrive in the Black Sea attached to the ships€™ hulls, and might intentionally be brought for aquaculture purposes.
Among the newly introduced exotic species, 34 % have been imported for aquaculture and 66 % have entered the Black Sea as pelagic larvae in ballast waters and/or fouling organisms on ship hulls. The number of introduced species is continuously increasing. About one fourth of them (8 species) have invaded the Black Sea in the last decade. The ways of introduction are graphically illustrated in Figure 8 in [43], along with the origin of species in known cases. Most of the newcomers are fish imported for fish farming.
Bay barnacle Balanus improvisus were introduced into the Black Sea in 1844. The B. improvisus status is stable in the Black Sea. This species resides in the coastal zone of the whole sea and inhabits the upper layer (0-10 m) in plankton (larvae) and benthic (adult organisms) communities.
Comb jelly Mnemiopsis leidyi. The first records about the Mnemiopsis appearance in the coastal waters of the Black Sea dates back to 1982. In the Sea of Azov they were first recorded in August 1988 (Volovik et al., 1993). Maximum development of this species was registered in 1989 and 1990 (about 1200 g/m3), after which time the abundance of Mnemiopsis started to decrease. For example the average biomass of Mnemiopsis during 1991-1994 in the Romanian littoral zone was 2.2-3.5 g per m-3 but in 1995 decreased to 0.2 g per m-3
Existing trends: After an initial outburst of development of the M. leidyi in 1989-1991, the density and biomass began to decline. Now its number is under the control of another recently introduced predator, the ctenophore Beroe ovata from the North Atlantic. It is possible to predict the undulating development of these species by the predator-prey relationships.
Soft-shelled clam Mya arenaria was discovered in the Odessa Gulf in 1966. Existing trends: the same as for B. improvisus, although for other biotop. This species inhabits the soft muddy bottoms and has progressively developed near the estuaries.
Rapana Rapana thomasiana thomasian was discovered in 1946 in the Novorossiysk Bay. It is now widespread and quite abundant in different areas of the Black Sea shelf. In the Northwestern Black Sea shelf in the Zmeiny Island (Snake Island) coastal waters (a marine reserve) up to 14-15 animals of Rapana per one m2 can be observed. .
Existing trends: R. thomasiana has progressively developed in the Black Sea living and preying on mussel beds. Their beds are presently intensively exploited for commercial purposes.
White-fingered mud crab Rhithropanopeus harrisi tridentata was discovered in the liman (estuary) of the Dnipro and South Bug rivers in 1939. Now it is widely distributed in those Black Sea areas with low salinity (less than 15€°) and in coastal wetlands. In the last decade, there has been further development in brackish water lagoons, estuaries and bays.
Haarder Mugil soiuy The first breeding of this naturalized fish in the Black Sea was noted in 1982, and commercial catches started in 1988. Annual catches of this commercially important fish exceed 10,000 tons in the Black Sea. The last decade has seen its progressive development in the whole of Black Sea and in the Sea of Azov. As expected, the stocks of this fish species will grow due to an abundance of the available food (microalgae and detrit) and the adaptation of this species to wide range of changes in its habitat conditions.
The Turkish Straits system, once major biological corridors for pelagic fish migrating between the Mediterranean and the Black Sea, has ceased to be so due to the destabilization of the pelagic and benthic ecosystems. On the other hand, the straits allow the acclimatization of certain species of Mediterranean origin, such as decapod crustaceans, anthozoans and sponges, entering the Marmara Sea and the Black Sea. Alien species, such as Rapana venosa=R. thomassiana, Mnemiopsis leidyi and Anadara inaequivalvia=Scapharca, have also become resident there. Pollution, over fishing, ship accidents and heavy marine traffic, constitute major threats for the biological diversity of the Turkish Straits system and hence for the ecological balance of adjacent seas. This might have caused the disappearance of resident populations of marine mammals from the Straits.
5 Key habitats.
5.1 Fish Nursery and Spawning Grounds
The commercial stocks of fish strongly depends upon availability of wintering and forage resources and undisturbed spawning and nursery grounds. The wintering and main feeding areas of the Black Sea commercial fish species depends upon particular fish species, nevertheless the Black Sea shelf and in particular Ukrainian Black Sea shelf is of the greatest value.
Table 5-1 Main Wintering Grounds and Fishing Areas of the Black Sea [32, 16, 28, 41, 4, 10]
|
Species |
Type of population |
Wintering ground and main fishing area |
|
Anchovy |
migratory |
Anatolian coast of
|
|
Mediterranean horse mackerel |
migratory |
Anatolian coast of
|
|
Sprat |
local |
Shelf zone of all Black Sea countries |
|
Whiting |
local |
Anatolian coast of
|
|
Bonito |
migratory |
Sea of Marmara, ,Anatolian coast of
|
|
Blue fish |
migratory |
Sea of Marmara and Anatolian coast of
|
|
Spiny dogfish |
migratory |
Shelf zone of all Black Sea countries |
|
Chup mackerel |
migratory |
Close to Bosphorus |
|
Turbot |
local |
Shelf zone of all Black Sea countries |
|
Shad |
migratory |
Large rivers and the southern part of the Sea |
|
Atlantic mackerel |
migratory |
Sea of Marmara and Anatolian coast of
|
The quality of nursery and spawning grounds
plays a crucial role in the reproduction of fish stocks. Construction of
dams and hydraulic structures kept the anadromous species like sturgeons
from their natural spawning grounds in the estuaries of Danube and Dnipro
Rivers. Therefore, these anadromous fish species currently depend on
industrial breeding. The most intensive work for the industrial breeding
of sturgeon is conducted in Azov Sea, in the
5.2 Protected Areas
An exhaustive description of the protected areas in the Black Sea coastal states is given in the “Biological Diversity in the Black Sea. A Study of Decline and Change”, 1997. A large number of wetlands with rich biodiversity and a recognized value for migratory waterfowls continue to be the focus of environmental conservation. The coastal wetlands occupy large areas and serve as a buffer zone between huge catchment areas and the Black Sea itself. The Black Sea wetlands include marsh reeds, forest dominated river flood plains, inland lakes and lagoons, deltas, marine lagoons, etc. (Fig. 38.)
Table 5-2 Spawning and Nursery Grounds of Regional Importance in the Black Sea
|
Country |
Reasons for conservation measures |
|
|
|
Sand bank “Cocketrice” Seacoast. |
The highest bio-diversity of the soft bottom sublittoral along the Bulgarian Black coast |
|
|
Reserve Kaliakra |
High bio-diversity and habitat for the monkseal (Monachus monachus)€“ in most danger of extinction of the marine mammal. |
|
|
Poti-Ochamchire region of the Black sea shelf. |
The main region of anchovy catches during the winter period; Conservation of sturgeon |
|
Supsa, Batumi and Gonio regions. |
||
|
|
The "Danube Delta" Biosphere Reserve - marine zone; |
A traditional zone for spawning and feeding for transboudary species as well as a passage route for anadromous species (sturgeons, shad) |
|
|
The Marine Reserve 2 Mai - Vama Veche. |
Area with a high diversity of the biotops and biocoenosis, being settled on the migration routes of the main pelagic and benthic fish and marine mammals. |
|
|
The most important part of the Black Sea shelf for the Russian fishery sector is located between the Kerch Straits and Adler (river Psou mouth), its area is about 4,2 thous. sq. km. |
The densest accumulations of commercial fish species are observed in these areas: anchovy, sprat, whiting, mullets, red mullet, dogfish, rays, turbot, scad and some others. |
|
|
the Kerch-Taman region€“ its width ranges from 20 to 50 km |
|
|
|
In the Caucasus region€“ from 2 km. near Adler to 18 km. near Sochi. |
|
|
|
No information available |
|
|
|
Mouth of the Danube |
Spawning of sturgeons and Clupeidae |
|
|
Mouths of the Dniester, Dnieper and Bug, |
|
|
|
Dnieper-Bug estuary (foraging area) |
|
|
|
Black Sea Reserve Sivash |
|
|
|
Zepnov's Phyllophora Field, |
|
|
|
North-Western shelf of the Black Sea, |
Fig. 38. Wetlands of the Black Sea [43].

National reports presented a set of data that allow one to present evident progress in each of Black Sea coastal states (Annex I).
In
In
In the
In
Fig.39. The Ecological
Corridors in
Conclusion
Owing to natural factors, the diversity of species of Black Sea fauna is approximately three times lower when compared with that of the Mediterranean. Specific features of the Black Sea make it very vulnerable to disturbances of its environment and ecosystems.
Eutrophication, pollution, and irresponsible fishing resulted in an overall decline of: biological resources, the diversity of species and landscapes, and of the aesthetic and recreational values of the Black Sea, thereby bringing its ecosystems to the edge of collapse.
National efforts and regional - international cooperation in the framework of the Convention on the Protection of the Black Sea Against Pollution expressed in the concerted actions of the Strategic Action Plan for Rehabilitation and Protection of the Black Sea brought the first signs of recovery to the Black Sea:
Along with the first signs of the recovery of
the Black Sea ecosystem, the economies of the Black Sea coastal states in
transition began to recover according to the available macroeconomic
indicators. Accession of
These optimistic signals shall not hinder the pursuit of existing problems:
The national and international efforts of the Black Sea coastal states shall be directed at the two targets:
Intermediate target: prevent the increase of pressures from human activities when transitional economies of the Black Sea coastal states begin to recover;
And,
Strategic target: to achieve environmental conditions in the Black Sea similar to those observed in 1960s.